Higher Education Students’ Dropout Intention: Relational Factors And Life
Management
Manuela Ferreira, Sofia Campos, Raquel Guiné, João Duarte, José Luís Abrantes, Lídia Cabral, Jessica Balula
Another:Instituto Politécnico de Viseu,CI&DETS, ESSV [email protected]
Abstract
School dropouts are a problem with which educational systems have been struggling over the last years. This issue, that may jeopardize the quality of the school institution and of the education system itself, tends to get more and more serious and may be related to the students’ Quality of Academic Life (QAL) and to the formal nature of the learning processes. To identify the relationship between the Quality of Academic Life and higher education students’ dropout intentions and to analyse the impact of some socio-demographic variables on higher education students’ dropout intention were the main objectives that were defined for this study.
A quantitative, cross-sectional, descriptive and correlational study was conducted. In order to collect the data that will be used in our study, we used a questionnaire that allowed us to gather information about the demographic characterization of the students and of their parents and the Brazilian Reasons for Higher Education Dropout Scale (M-ES; 2015). The sample consists of 891 students from polytechnic higher education institutions who were attending courses in different scientific fields. Participants are mostly female (68.2%), with a mean age of 19.68 years (± 2.34 years). Students who are ≤ 19 years old are those who show a better quality of life in dimension that involve their personal and interpersonal lives, their study conditions, their institutional life and their overall quality of life. Female students exhibit higher ratings when they refer to the quality of their personal life, their career, their study conditions, to their institutional and their overall quality of life, while male students reveal a better interpersonal quality of life. The causes of school dropout in higher education are multiple and the implementation of interventions that can provide students with an easier and better academic and institutional integration are increasingly important, a procedure that will involve the strengthening of the support provided by the academic services in order to better monitor and optimize processes and to provide more information about the requirements of academic life.
Introduction
According to Azevedo and Faria (2001), the transition from secondary education to higher education is one of the most important phases in the whole cycle of academic experiences. This phase provides students with an environment which is very different from what they have already known throughout their lives so far, and may constitute a challenge and, at the same time, may represent some sort of a threat, since it requires the adoption of work strategies and personal time management strategies that often represent potential stress and emotional tension-inducing factors (Azevedo & Faria, 2006). These changes may represent the first step that will lead to the autonomy of a young person who is on his way to adulthood, since he/she will be expected to show responsibility in situations that will involve the management of their residence, of their meals, of their allowance and they will still have to be responsible enough to find time for their studies (Lucas, 2014). This is a complex phase in students’ lives, mainly due to external factors: the fact that they had to leave their parents’ house and find a new place to stay, the fact that the level of difficulty they will meet is much higher and that their lifestyles have gone through great changes. These factors can often lead to depression and emotional distress problems, among others (Brites Ferreira, Seco, Canastra, Simões-Dias & Abreu, 2011).
Lifelong training and the enrolment that will allow students to attend a new place of formal learning (usually far away from home) transform their academic experience into a phase that will favour the acquisition of a range of transversal skills that will contribute to the enrichment of the students’ personal and academic growth, as long as the quality standards are ensured (Pedro, 2013).
The structures of the institution, the education policies, the curricular and programmatic units, the services and the environments themselves are regarded as determining factors that may have an impact on the students’ cognitive and affective changes (Ferreira, 2009).
A higher education institution should provide its students, both at an academic and at a social level, with a feeling of well-being and a quality of life that will surely contribute to their happiness and overall well-being. That way, other contexts of life should be valued as well, namely all those that involve leisure, training, work, sports, culture and science, because the quality of academic life depends, above all, on the quality of the experiences and of the conditions provided by the academy, both at a pedagogical and at an institutional level. (Barros, 2002) regards well-being as one of the dimensions of life that will play a crucial role in determining general happiness, satisfaction with life or subjective well-being. The quality of academic life bears, therefore, a close relationship with the need for satisfaction and with the experiences that create positive emotions throughout students’ academic journey (Pedro, 2013). It should be noted that, and according to the same author, this feeling encompasses both the cognitive assessment of the university life and the affective experiences, experiences that will positively
influence the students throughout their academic life. Students’ satisfaction has a positive impact on their motivation, their school loyalty and on their enrolment and thus becomes an essential need that higher education institution will have to meet (Elliot & Shin, 2002; Schertzer & Schertzer, 2004). Academic management, learning support facilities (such as libraries and computer centres), physical facilities (such as classrooms, laboratories, social spaces), social infrastructures (cafeterias, student housing, healthcare offices, sports centres and student support offices) and other external aspects related to students (such as their economic capacity and easy access to public transportation) are dimensions of paramount importance when time comes to assess the quality of academic life. (Leckey & Neill, 2001), (Harvey, 2003).
Thus, the quality of academic life can be assessed in terms of feelings of overall satisfaction with the student's experience of university life (Sirgy et al. 2007; 2010).
Pedro (2013) claims that the increasing importance attached to the quality of academic life should not be strictly centred on the course, on the student’s educational path and on the subsequent graduation, but that it must, above all, be directed towards an evolutionary process of learning that is the result of all the experiences arising from all the dynamics and from the extracurricular, associative, civic, sports, cultural, social, technical, scientific and investigative contexts and environments that took place both inside and outside the higher education institutions. This author concludes that academic life must be understood as a formal active training journey that deeply influences its protagonists learning process and life path.
Satisfaction with life is the students’ subjective perception of their own life that includes the cognitive judgments and the emotional reactions to the contexts where they belong as well as the way in which they experience them. In turn, optimism is the perception of a positive vision of the future and the feeling of self-confidence that will allow students to implement their personal and collective projects.
In his study, Pedro (2013) claims that satisfaction with life correlates positively and moderately with the level of optimism, with positive self-esteem and with positive affections. Self-esteem and negative affections correlate negatively with self-esteem and satisfaction with life.
Method
The characteristics that define higher education and the students’ quality of academic life are regarded as challenging factors in their academic transition and adaptation. These challenges can lead to failure or even dropout situations (Almeida, Casanova & Gonçalves, 2017). Taking these assumptions into account, our objectives were to identify the relationship between polytechnic higher education students’ quality of academic life and possible dropout intentions and to analyse the impact of some socio-demographic variables on higher education students’ quality of academic life.
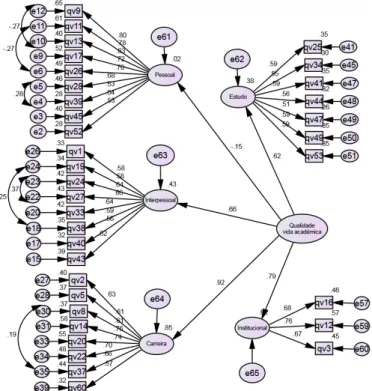
We have developed a descriptive, correlational and analytical research, as our intention was, in addition to studying and describing the relationships between the variables, to analyze and explain the relationship between them. The articulation between the variables present in this study is displayed in a schematic/conceptual representation, where we can find the relationship between the independent variables (the students’ socio-demographic variables, Almeida, Soares and Ferreira’s (2002) Academic Experiences Questionnaire(QVA-R)) and the dependent variable (school dropout) (Figure 1).
Figure 1- Schematic representation of the expected relationship between variables
For this study, we chose a purposive non-probability sample for convenience formed by 891 students who were attending polytechnic higher education institutions and research was conducted in four distinct areas: health, technology, education and agrarian studies.
To understand the personal, interpersonal and institutional processes experienced by students as they enter higher education, we used a shortened version of the academic experiences questionnaire (QVA-R), built and validated
Socio-demographic variables
⋅ Age ⋅ Gender ⋅ Parents’ jobs
⋅ Parents’ academic qualifications
Academic context variables
⋅ Academic year
⋅ 1st enrolment in the course. ⋅ School attended ⋅ Social benefits
⋅ Being away from habitual residence ⋅ Study habits (regularity)
School
dropout
for Portuguese Higher education students by Almeida et al. (1999). The main advantage of that short QVA version is the presence of a range of areas and items ranked according to the different dimensions that will be assessed and that stem from the answers provided by the students.
The definitive version of the shortened format of the QVA (QVA-R) consists of 60 items, in a five-point Likert-like format (1-Very untrue of me, Strongly disagree, Extremely unLikert-likely ; 2- Untrue of me, Disagree, UnLikert-likely; 3- Somewhat untrue of me, Neither agree nor disagree, Neutral; 4-True of me, Agree, Likely and 5-Very true of me, Strongly agree, Extremely likely) disposed in five dimensions (personal, interpersonal, career, studies and institutional).
The Personal dimension includes 13 items associated with personal perceived well-being and self-esteem and with other facets of the students’ identity and self (Seco et al., 2005, quoted by Fernandes, 2011). The second dimension, the Interpersonal dimension, gathers items related to the building of friendship and intimate relationships, to students’ involvement in extracurricular social and/or associative activities, systematized in a factor that will deal with a more interpersonal aspect of their academic adaptation and that will include 13 items (Seco et al., 2005, quoted by Fernandes, 2011). Taking into account the contents of its items, the third dimension, the Career dimension, essentially assesses the students’ adaptation to the course and to their career projects. This factor consists of 13 items and describes the students’ satisfaction with the choice of the course they are attending, the kind of perception they have of the socio-professional achievements they may obtain once they graduate and the existence of vocational project related to the course. The fourth dimension includes items associated with the study and with time management, in other words, the kind of behaviours that will be assessed refer to curricular and learning situations. This QVA-R dimension includes 13 descriptive items about the students’ study skills and routines, about their use of the library and of other learning resources. The last dimension integrates a set of items related to the students’ adaptation to the institution and to their new environment. This dimension, the Institutional dimension, includes 8 items associated with the students’ interest in the institution they are attending, their interest in pursuing their studies in that institution or with their perception of the quality of the services and of the facilities the institution makes available to its students (Seco et al., 2005, quoted by Fernandes, 2011). The studies developed with the QVA-R have proven the good psychometric qualities of the scale in terms of validity and fidelity. In fact, the items’ internal consistency coefficients (Cronbach’s alfa) present acceptable values in a significant set of works that have been conducted to assess the difficulties experienced by students in the transition into college and/or during their academic journey (Almeida et al., 1999).
In our study the scale was composed of 35 items. It was subjected to confirmatory factor analysis and has demonstrated the validity of its structure in five dimensions: Personal (F. 1); Study (F. 2); Interpersonal (F. 3); Career (F. 4); Institutional (F. 5); (c Figure 2).
Findings
The sample consists of 891 students of polytechnic higher education institutions with a minimum age of 17 years and a maximum of 40 years, with a mean age of 19.68 years (± 2.34 years), which corresponds to a coefficient of variation of 11.89%, a value that suggests low dispersion. Among male participants, who represent 31.8% of the sample, the minimum and maximum age fluctuate between 17 and 32 years, while in the group composed of female participants, who represent 68.2% of the sample, the minimum age is 17 and the maximum is 40. Men (m = 19,97 years ± 2.39 years) are slightly older than women (m = 19,55 years ± 2.32 years). The values of skewness and kurtosis reveal that the age variable doesn’t exhibit a normal distribution since the skewness and kurtosis values reveal leptokurtic curves and skewed to the left, both for the global sample and for both genders.
Table 1- Statistics regarding age, according to gender
Gender N Min Max M SD CV (%) Sk/error K/error
Male 283 17 32 19,97 2,39 11,96 13,62 16.38
Female 608 17 40 19,55 2,32 11,86 36,71 98,40
Total 891 17 40 19,68 2,34 11,89 37,15 85,49
The 19 year old age group represents 28.2% of the sample (21.6% of them are male participants and 31.3% are female elements) with statistically significant differences (X2 = 15,242; p = 0,000) among female students who are 19 and males students who are ≥ 20 years old.
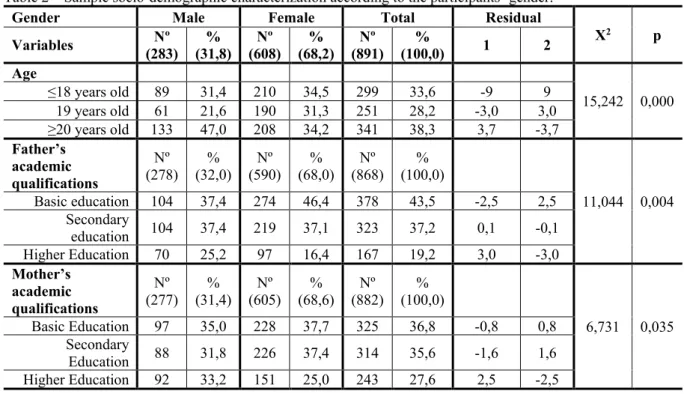
As for the father’s academic qualifications, the highest mean value was obtained by those who have completed basic education (43.5%), a percentage that corresponds to 37.4% of male students’ parents and 46.4% of female students’ progenitors. As far as the mother's academic qualifications are concerned, we found out that 36.8% have finished their basic education.
Table 2 – Sample socio-demographic characterization according to the participants’ gender.
Gender Male Female Total Residual
X2 p Variables (283) Nº (31,8) % (608) Nº (68,2) % (891) Nº (100,0) % 1 2 Age 15,242 0,000 ≤18 years old 89 31,4 210 34,5 299 33,6 -9 9 19 years old 61 21,6 190 31,3 251 28,2 -3,0 3,0 ≥20 years old 133 47,0 208 34,2 341 38,3 3,7 -3,7 Father’s academic qualifications Nº (278) (32,0) % (590) Nº (68,0) % (868) Nº (100,0) % 11,044 0,004 Basic education 104 37,4 274 46,4 378 43,5 -2,5 2,5 Secondary education 104 37,4 219 37,1 323 37,2 0,1 -0,1 Higher Education 70 25,2 97 16,4 167 19,2 3,0 -3,0 Mother’s academic qualifications Nº (277) (31,4) % (605) Nº (68,6) % (882) Nº (100,0) % 6,731 0,035 Basic Education 97 35,0 228 37,7 325 36,8 -0,8 0,8 Secondary Education 88 31,8 226 37,4 314 35,6 -1,6 1,6 Higher Education 92 33,2 151 25,0 243 27,6 2,5 -2,5
Evidence also shows that 7.3% of the students enjoy a student employee status and 43.43% have a scholarship. As for statistics regarding the quality of academic life, the minimum and maximum indices range between 0.00 and 24.29 for the overall sample. The dimensions with a higher mean value are the Institutional dimension (Mean = 69,85; ± 20, 44Sd) and the Career dimension (M = 68,72; ± 16, 19Sd) with moderate coefficients of variation (29.26% vs. 23.55%). The lowest mean value was found for the Personal dimension (M = 46,17; ± 20, 09Sd) with a coefficient of variation of 43.51%, which indicates a high dispersion when compared to the average. The quality of overall academic life has a Mean value of 60.46; ± 10, 02Sd, with a coefficient of variation which indicates a low dispersion (16.57%).
Table 3 – Statistics about the Quality of Academic Life
Quality of Academic Life N Min Max Mean SD (%) CV Sk/error K/error Personal Dimension 891 0,00 100,00 46,17 20,09 43,51 1,58 -0,18 Interpersonal Dimension 12,50 100,00 66,91 16,17 24,16 -2,06 -1,27 Career Dimension 6,25 100,00 68,72 16,19 23,55 -5,21 2,44 Study Dimension 3,57 100,00 57,99 14,33 24,71 0,30 4,20 Institutional Dimension 0,00 100,00 69,85 20,44 29,26 -4,63 -0,58 Quality of Academic Life (overall) 24,29 100,00 60,46 10,02 16,57 3,09 4,38 It is observed that the highest percentages found in relation to gender were obtained by female students: 61.4% show poor quality of academic life, 69.6% show intermediate quality of Academic life and 72.6% a good quality of academic life, with statistically significant differences (X2 = 7,454; p = 0,024) between male students and with poor quality of academic life and female students with good quality of academic life.
In relation to age groups, most of the students who show low quality of academic life can be found among the participants who are 20 or over (39.8%) and among those who are under 20 (35.2%). Many of the students who are 20 or older also show appropriate quality of academic life (39.2%). The same happens with students who are 18 or less: 30.1%) of them exhibit appropriate quality of academic life. In the group of students with a good quality of academic life we can find both younger students (38.0%) and older students (35.0%).
The highest mean values correspond to students who are attending technology and management courses where 35.2% of the students reveal poor quality of academic life, 34.7% of them show appropriate quality and 29.5% good quality of academic life.
In relation to the quality of academic life depending on whether or not students have a student employee status, evidence shows that the highest mean value is obtained by students who do not enjoy that status: 91.1% of those students exhibit poor academic life quality, 95.5% of them show appropriate quality of academic life and 89.5% of them seem to have good quality of academic life, with statistically significant differences (X2 = 9.279; p = 0,010) between students who don’t have their student employee status and who show intermediate quality of academic life and those who have the student employee status and who show good quality of academic life. After carrying out an analysis of the data in relation to the students who have a scholarship, we can observe that 36.0% of them have poor quality of academic life, 43.5% appropriate quality of academic life and 43.9% of them show good quality of academic life.
It can also be noted that the most expressive mean values correspond to students who are living away from their habitual residence: 66.1% of those students reveal poor quality of academic life, 69.1% intermediate quality of academic life and 72.2% good quality of academic life.
During the data analysis carried out according to the students’ study habits (namely in aspects dealing with how often/how much and how long they study) evidence shows that most of those who show poor quality of academic life admit that they don’t study on a regular basis, on the contrary they state that they only study “occasionally”. Students who adopt this kind of study behaviour are those who show the highest percent of intermediate quality of academic life (38.0%). The second highest percent of intermediate quality of academic life is seen among students who study “frequently” (35,9%), with statistically significant differences (X2 = 25,054; p = 0,000) between students who study on a regular basis (“frequently”) and who show good quality of academic life and those who study “occasionally” and show poor quality of academic life.
After analyzing the results according to the parents’ academic qualifications (father/mother), evidence proved that the group of students with poor quality of academic life is mostly formed by youngsters whose fathers have merely completed their basic education (42.1%). Evidence also shows that the fathers of students who show good quality of academic life have graduated from high school (39.4%). In relation to the results obtained according to the academic qualifications of the students’ mothers, it was clear that most of the students who show poor quality of academic life are those whose mothers have finished their secondary education (39.4%); most of the students who reveal intermediate quality of academic life are young people whose mothers have completed their basic education (38.9%) and those who express good quality of academic life have mothers who have left school as soon as they have completed their basic education (35.3%).
Table - 4 – Quality of academic life according to academic and socio-demographic variables Quality of
life Low Intermediate Good Total Residual
X2 p Variables (236Nº ) % (26,5 ) Nº (418 ) % (46,9 ) Nº (237 ) % (26,6 ) Nº (891 ) % (100,0 ) 1 2 3 Gender 7,454
Male 91 38.6 127 30,4 65 27,4 283 31,8 2,6 0, -8 -1, 7 0,02 4 Female 145 61,4 291 69,6 172 72,6 608 68,2 2, -6 0, 8 1,7 Age 5,766 0,217 ≤18 years old 83 35,2 126 30,1 90 38,0 299 33,6 0,6 -2, 0 1, 7 19 years old 59 25,0 128 30,6 64 27,0 251 28,2 1, -3 1, 5 -0, 5 ≥20 years old 94 39,8 164 39,2 83 35,0 341 38,3 0,6 0,6 -1, 2 School 41,80 2 0,000 ESSV 18 7,6 48 11,5 55 23,2 121 13,6 3, -1 -1, 7 5, 0 ESTGV 83 35,2 145 34,7 70 29,5 298 33,4 0,7 0,7 1, -5 ESEV 44 18,6 81 19,4 61 25,7 186 20,9 1, -0 -1, 0 2, 2 ESAV 69 29,2 114 27,3 37 15,6 220 24,7 1,9 1,7 3, -8 ESTGL 22 9,3 30 7,2 14 5,9 66 7,4 1,3 0, -2 -1, 0 Student employee status 9,279 0,010 No 215 91,1 399 95,5 212 89,5 826 92,7 1, -1 3, 0 -2, 2 Yes 21 8,9 19 4,5 25 10,5 65 7,3 1,1 3, -0 2, 2 Social benefits 7,037 0,134 None 147 16,5 231 25,9 126 14,1 504 56,6 2,1 0, -7 -1, 2 Scholarship 85 36,0 182 43,5 104 43,9 371 41,6 2, -0 1, 1 0,8 Scholarship and residence 4 1,7 5 1,2 7 3,0 16 1,8 -0, 1 -1, 3 1, 6 Away from home 2,029 0,363 Yes 156 66,1 289 69,1 171 72,2 616 89,1 1, -2 0, 0 1,2
No 80 33,9 129 30,9 66 27,8 275 30,9 1,2 0,0 1, -2 Students’ study habits 26,05 4 0,000 Frequently 59 25,0 150 35,9 111 46,8 320 35,9 4, -1 0, 0 4,1 Regularly 66 28,0 109 26,1 56 23,6 231 25,9 0,8 0,1 0, -9 Occasionall y 111 47,0 159 38,0 70 29,5 340 38,2 3,3 -0, 1 -3, 2 Father’s academic qualificatio ns 7,136 0,129 Basic Education 96 42,1 195 47,7 87 37,7 378 43,5 -0, 5 2, 3 -2, 1 Secondary Education 90 39,5 142 44,7 91 39,4 323 37,2 0,8 -1, 4 0, 8 Higher Education 42 18,4 72 17,6 53 22,9 167 19,2 -0, 4 -1, 2 1, 7 Mother’s academic qualificatio ns 3,706 0,447 Basic Education 80 34,6 162 38,9 83 35,3 325 36,8 -0, 8 1, 2 -0, 6 Secondary Education 91 39,4 144 34,6 79 33,6 314 35,6 1,4 -0, 6 -0, 7 Higher Education 60 26,0 110 26,4 73 31,1 243 27,6 -0, 6 -0, 7 1, 4
The first dimension of school dropouts to be studied through multiple regression analysis is the Organizational dimension. The results indicate negative correlative values for the Career dimension (r =-0.019) and for the Institutional dimension (R =-0.018).
The second dimension to be studied is the Life Management dimension. The results point out negative correlative values for the Interpersonal dimension (r =-0.008). Statistical evidence is found in the Career dimension (P = 0,000), Study dimension (P = 0,018) and Institutional dimension (P = 0,011).
The third dimension to be studied is the Profession/Career dimension. The results indicate negative correlative values for the Interpersonal dimension (r 0.053), Career dimension (r 0.116), for the Study dimension (r =-0.059) and Institutional dimension (R =-0.073). Statistical evidence is found in the Career dimension (P = 0,000), in the Study dimension (P = 0,039), and in the Institutional dimension (P = 0,015).
The fourth dimension to be studied is the Relational dimension. The results indicate negative correlative values for the Interpersonal dimension (r =-0.091), Career dimension (r =-0.125), Study dimension (r =-0.014) and Institutional dimension (R =-0.125). Statistical evidence is found in the Career dimension (P = 0,000), Study dimension (P = 0,039) and Institutional dimension (P = 0,015).
Finally, school dropout intention was studied using multiple regression analysis as well as the overall dropout intention. In table 5, we can find all the correlations obtained with the different variables analysed in each of the different dimensions and whose results indicate negative correlative values for the Age (r 0.063), Gender (r =-0.078), Interpersonal dimension (r =-0.032), Career dimension (r =-0.038) and Institutional dimension (R =-0.036).
School dropout intention is influenced by Age (P = 0,030), and Gender (p = 0,010), by the Personal dimension (P = 0,025) and the Emotional Perception (P = 0,021) of the quality of academic life.
Table 5-Pearson’s correlation coefficient between independent variables and dropout intentions in different dimensions: organizational, life management, profession/career, relational and overall school dropout.
Organizational Management Profession/Career Relational Life Overall school dropout
Variables R P R P R P R P R P Personal Dimension 0.051 0.065 0.016 0.318 0.052 0.061 0.115 0.000 0.066 0.025 Interpersonal Dimension 0.031 0.174 -0.008 0.402 -0.053 0.057 -0.091 0.003 -0.032 0.171 Career Dimension -0.019 0.288 0.114 0.000 -0.116 0.000 -0.125 0.000 -0.038 0.129 Study Dimension 0.052 0.059 0.070 0.018 -0.059 0.039 -0.014 0.334 0.017 0.311 Institutional Dimension -0.018 0.298 0.077 0.011 -0.073 0.015 -0.125 0.000 -0.036 0.143 Conclusion
Many students who enter higher education have positive expectations about academic experiences. However, the confrontation between the imaginary images and the expectations they had created and built over the last years of secondary education does not always correspond to reality. This contrast can definitely interfere with the kind of quality of academic life they will be experiencing in this new stage of their lives. It is during their first year that students tend to realize how wrong they were about this new life of theirs and that their expectations start to fall apart. This is also during that first year that the students experience the greatest difficulties in adapting to this new reality and to its requirements, that they start experiencing poorer school performance due to the new quality standards they have to meet. These newly found difficulties often lead to school dropouts (Nunes & Garcia, 2010). The same authors stress that those new academic and social requirements, in association with other personal concerns, support the construction of strategies that will be used to solve problems and tasks that have to do with personal, interpersonal and academic management. That way, entering higher education also represents a clear possibility of carrying out personal projects, even if the realization of such projects means that we have to overcome personal and contextual disruptions.
In this study, we have tested a structural model that allowed us to assess the impact that some dimensions of the quality of academic life, such as the Personal dimension, the Study dimension, the Interpersonal dimension, the Career dimension and, finally, the Institutional dimension, have on higher education students’ dropout intentions. The studies we had the chance to analyze unanimously maintain that the transition to higher education represents a decisive moment in the students’ academic journey, and may have a positive or negative impact on their academic performance, quality of life and may create negative environments that can lead to dropout situations (Ferreira; Fernandes, 2015; Moreira et al., 2015; Rabelo, 2017).
Our results show that the quality of academic life of higher education students relates to their well-being, but that this factor is only one of the many dimensions of life that will play an important role in determining their general happiness, satisfaction with life or their subjective well-being. It should be noted that the quality of academic life encompasses both the cognitive assessment of life (which has to do with the degree of satisfaction of life experienced in higher education) and the affective experiences that positively influence students throughout their academic life. School dropout intention is influenced by age and by gender and by the personal dimension and the emotional perception of the quality of academic life. Therefore, these variables should be considered when the institutions are developing intervention plans whose aim will be to promote some sort of institutional affiliation or institution loyalty among their students, or in other words, plans that will prevent students from leaving the institution shortly after they had been admitted.
Acknowledgments
This work is financed by national funds through FCT - Fundação para a Ciência e Tecnologia, I.P., under the project UID/Multi/04016/2016. Furthermore we would like to thank the Instituto Politécnico de Viseu and CI&DETS for their support.
References
Albuquerque, T. (2008) Do Abandono à Permanência num Curso de Ensino Superior. Sísifo – Revista de Ciências da Educação, Nº7, 19-28. Acedido em:
https://www.researchgate.net/publication/28240665_Do_abandono_a_permanencia_num_curso_de_ens ino_superior
Ambiel, R.A.M. (2015). Construção da Escala de Motivos para Evasão do Ensino Superior. Avaliação Psicológica, 14(1), 41-52. Acedido em http://pepsic.bvsalud.org/pdf/avp/v14n1/v14n1a06.pdf
Ferreira, F., & Fernandes, P. (2015). Fatores que influenciam o abandono no ensino superior e iniciativas para a sua prevenção o olhar de estudantes. Educação, Sociedade & Culturas, 45, 177-197. Acedido em http://www.fpce.up.pt/ciie/sites/default/files/ESC45Ferreira.pdf
Lopes, J. & Costa, A. (2012) Desigualdade de Percurso dos Estudantes do Ensino Superior. Atas do VII Congresso Português de Sociologia. Porto, Portugal. Acedido em:
https://repositorio-aberto.up.pt/bitstream/10216/64799/2/76973.pdf
Santos, L. & Almeida, L. S. (2001). Vivências académicas e rendimento escolar: estudo com alunos universitários do 1º ano. Análise Psicológica, XIX (2), 205-217.