An in vitro model of EMT/MET using human near-normal
and cancer-derived breast cell lines
Modelo in vitro de EMT/MET em linhas celulares de mama
normal e de cancro de mama
Mafalda Maria Coelho Azevedo
Dissertação de Mestrado em Oncologia
(especialidade: Oncologia Molecular)
Mafalda Maria Coelho Azevedo
An in vitro model of EMT/MET using human near-normal and
cancer-derived breast cell lines
Modelo in vitro de EMT/MET em linhas celulares de mama normal e
de cancro de mama
Dissertação de Candidatura ao grau de
Mestre
em
Oncologia
(especialidade:
Oncologia Molecular) submetida ao Instituto
de Ciências Biomédicas Abel Salazar da
Universidade do Porto.
Orientador
Doutora Carla Oliveira
Categoria
1Investigadora,
2
Professora Afiliada
Afiliação
1IPATIMUP,
2Faculdade
de
Medicina
da
Universidade do Porto
Co-orientador
Doutora Fátima Gärtner
Categoria
Professora Catedrática
Afiliação
Instituto
de
Ciências
Biomédicas Abel Salazar
da Universidade do Porto
ACKNOWLEDGMENTS
Aos meus pais, que não poderiam deixar de vir em primeiro lugar. Muito Obrigada por todo o apoio, pelo suporte (financeiro também!), pela confiança que sempre depositaram em mim e por nunca duvidarem das minhas opções. Obrigada, principalmente a ti, Mãe, por aturares as minhas casmurrices e dramas, e me fazeres olhar para trás e pensar que estavas certa quando me dizias “Um dia ainda me vais dar razão”. Obrigada a ti, Pai, pela calma e tranquilidade que me transmites a cada momento. Obrigada pelos valores que me transmitiram e transmitem todos os dias, por me ensinarem a acreditar nas minhas capacidades e por me darem amor e carinho sempre. No fundo, Obrigada por serem os Melhores Pais do Mundo!
Aos meus queridos irmãos, João e Carlinhos, que nunca me fizeram desejar ser filha única. A vocês obrigada por serem tão diferentes, mas tão iguais na forma como preenchem a minha vida. Obrigada por todos os momentos de risota, de brincadeiras de crianças, por crescermos e aprendermos juntos, pelas chatices e zangas que muitas vezes aconteceram, mas que nos tornaram pessoas melhores. Gosto muito de vocês e Obrigada por serem os Melhores Companheiros de Vida!
À minha “Bó” e ao meu “Bú”, os meus segundos pais, de quem sempre recebi mimo e carinhos, ensinamentos de uma vida e muita sabedoria. Estão sempre presentes para ajudar no que for preciso, para trazer aquela ternura que só os avós conseguem ter. A vocês, o meu eterno Agradecimento por tudo!
Às minhas meninas, Ana, Flávia, Moni e Su, por não serem da família, mas serem a família que eu escolhi. Já são tantos anos que é difícil recordar tudo aquilo que passamos e ultrapassamos, mas estivemos sempre juntas e isso é o mais importante. Não interessa estarem perto ou longe, estarão sempre comigo. Em memória a todos os nossos momentos de alegria, de risota, de cumplicidade e também a todos os momentos menos bons, um grande Obrigada!
Ao grupo Carla Oliveira, do qual orgulhosamente faço parte: Joana Carvalho, Renata Carriço, Hugo Pinheiro, Patrícia Oliveira, Marta Teixeira Pinto, Daniel Ferreira, Denisa Mateus, Patrícia Pereira e Luís Maia. É um gosto trabalhar com vocês e sentir que há sempre alguém disposto a ajudar quando é preciso! Um Enorme Agradecimento a todos por me terem integrado, pelo apoio e pela animação de cada dia!
À Patrícia, porque sem ela eu não estaria onde estou (apesar de no início achares que eu era uma “choca”!). Foste quem mais contribuiu para aquilo que sei hoje. Obrigada por me deixares fazer parte do teu trabalho, por depositares em mim tanta confiança e me ensinares a cada dia. Ainda me vais ensinar bioinformática! Obrigada por estares sempre disponível e por me teres ajudado tanto, principalmente nestas últimas semanas. A tua boa disposição constante e as piadas que me deixam sem palavras fazem com que todos os dias sejam melhores. Um Enorme Obrigada da tua primeira Mestranda!
Um Obrigada à Joana. A tua ajuda sempre foi uma constante, desde os primeiros dias em que estive no IPATIMUP. Sempre foste paciente comigo e um grande apoio para mim! Obrigada por também tu teres contribuído tanto para a minha formação e teres sempre a palavra certa no momento certo!
A todas as pessoas do Cancer Genetics “residentes” ou não: aqui deixo um GIGANTE Obrigada a todos (porque não quero esquecer-me de ninguém!). De uma forma ou de outra, todos contribuem diariamente para tornar os mês dias melhores. Sinto realmente que dentro daquele laboratório, não existe apenas um grupo de trabalho: existe uma família! Um Muito Obrigada por me ajudarem, por me fazerem rir e por tornarem este trabalho em algo indispensável para mim!
Não poderia deixar de fora a Ritinha, sempre princesa! Andámos sempre par a par quase desde o primeiro dia. Obrigada por me teres ajudado sempre, mas também por todos os momentos de cusquice, de dicas sobre tudo e mais alguma coisa. Não percas essa tua alegria e energia contagiante! Obrigada por seres a melhor colega de mestrado de sempre e por termos partilhado este último ano :)
Um Obrigada à Catarina Salgado (sempre divertida e impecavelmente combinada) e ao João Vinagre (por todas as longas esperas e boleias) que não são do CG, mas é como se fossem.
Muito Obrigada à Doutora Fátima Gärtner por ter aceite co-orientar este trabalho sem reservas.
E por fim, um Obrigada muito muito especial à Carla por me ter acolhido no grupo, por me ter dado a oportunidade de aprender e crescer cientificamente, pela ajuda constante e pela disponibilidade. Mas claro pela simpatia sempre presente, pelo apoio e disponibilidade. Um Imenso Obrigada!
TABLE OF CONTENTS
Acknowledgments ... 7
Abstract ...15
Resumo ...17
General Introduction ...21
Novel avenues for cancer research ...23
EMT as a cancer-relevant biological pathway ...23
EMT, TGF-β pathway and cancer...25
MET and cancer ...26
Aims and Thesis Outline ...31
Material and Methods ...37
Near-normal and cancer-derived breast cell culture ...39
RNA isolation and RT-PCR ...39
Western Blot for E-cadherin, β-catenin and Fibronectin ...40
Immunofluorescence for E-cadherin, β-catenin and Vimentin ...41
RNA expression quantification ...41
Chapter One ...45
Aim ...47
Results ...47
1. Phenotypical features and protein localization of epithelial and mesenchymal markers in several human breast cell lines ...47
2. Quantification of gene expression of several epithelial and mesenchymal markers ...49
3. Expression of TGF-β receptors 1 and 2 ...50
Discussion ...53
Chapter Two ...57
Aim ...59
1. Optimization of TGF-β1concentration able to induce EMT in MCF10A and MCF7AZ
cell lines ...59
1.1 Cancer-derived cell line MCF7AZ ...59
1.2 Near-normal cell line MCF10A ...61
2. MET, the recovery of the epithelial phenotype? ...63
3. The establishment of a human in vitro EMT/MET model ...64
Discussion ...69
Chapter Three...73
Aim ...75
Results ...75
1. Dies1, a key gene for mouse embryonic stem cell differentiation vary along EMT/MET ...75
Discussion and Unanswered Questions ...77
Summary and Conclusions ...81
Future Perspectives ...87
ABSTRACT
Epithelial-Mesenchymal Transition (EMT) is a biological process involving the loss
of epithelial characteristics and acquisition of mesenchymal features.
Non-pathological EMT occurs both during development (embryogenesis) as well as in
adult individuals in situations of wound healing and tissue remodeling. Pathological
EMT has been associated with cancer, in cells with de novo oncogenic ability and
with genetic/epigenetic alterations underlying metastatic dissemination. While
literature accumulates concerning EMT, few studies have focused on EMT’s
reverse process, the Mesenchymal-Epithelial Transition (MET). This process is
characterized by the down-regulation of mesenchymal markers and up-regulation
of epithelial markers as well as of cell-cell adhesion. EMT and MET have relevant
roles during cancer progression, as proposed by several authors. It has been
suggested that cancer cells, derived from normal epithelial cells that have suffered
a given set of genetic/epigenetic alterations, upon certain chemical cues from the
microenvironment, could undergo EMT thus gaining mobility and detaching from
the primary tumor. In addition, these now invasive cancer cells could then
intravasate to the blood stream and reach a secondary site in the organism. The
reversible nature of EMT would at this point be activated: cancer cells at the
secondary site, could then undergo MET, regaining enough adhesion thus forming
secondary tumors.
Several molecules are able to induce EMT in vitro such as bone morphogenic
proteins, platelet-derived growth factor and transforming growth factor beta. These
molecules could be the chemical triggers to induce/allow EMT and consequently
cancer progression in vivo: for example, cancer cells may secrete
non-physiological levels of TGF-β receptor ligands that both in a paracrine/autocrine
manner may lead to tumor progression and metastasis.
EMT/MET occurrence during cancer progression has been supported by several
facts such as: presence of the same (epithelial) markers both in primary tumors
and metastases from clinical samples; overexpression of mesenchymal markers in
the invasive front of tumors. However, given that histological samples are a static
scenario and EMT/MET is characterized by its dynamicity, in vitro models that
mimic these processes are key for understanding the biological alterations
associated with EMT/MET. In vitro EMT/MET models can be the solution to
uncover novel biological markers and regulatory mechanisms and hence novel
therapeutic approaches. Therefore our aim was to establish novel EMT/MET in
vitro models, using the cytokine TGF-
β1 as an inducer, in near-normal and
cancer-derived cell lines.
In Chapter One of this Thesis we have tested several mammary cell lines aiming
at selecting the best suited for an EMT induction. The expression of several
epithelial and mesenchymal markers was assessed and MCF10A was the
selected cell line. In Chapter Two of this Thesis we demonstrate the induction of
EMT and MET in this cell line, thus creating a novel model that faithfully recreates
the dynamic process of gain (EMT) and loss (MET) of mesenchymal markers and
concomitant opposite variation of epithelial markers. These variations were
confirmed by analyzing the RNA and protein expression of several markers. In
Chapter Three of this Thesis, we have provided preliminary data on the
comparison between the MCF10A EMT/MET model and another in house
established EMT/MET model. We have compared the expression and regulation of
the recently annotated gene Dies1 and observed that although with similar
patterns of expression variation, the inherent regulatory mechanism is different in
both models. This observation enhances the relevance of creating novel
EMT/MET in vitro models and stresses the importance of the work described in
this Thesis.
RESUMO
A transição Epitelial-Mesenquimal (EMT) é um processo biológico que envolve a
perda de características epiteliais e aquisição de características mesenquimais.
EMT não patológica, ocorre tanto durante o desenvolvimento (embriogénese),
assim como em indivíduos adultos em situações de cicatrização de feridas e
remodelação do tecido. EMT patológica tem sido associada com cancro, tendo
sido observada em células com capacidade oncogénica e com alterações
genéticas/epigenética subjacentes disseminação metastática. Enquanto que
vários estudos abarcam a temática da EMT, poucos se concentraram no processo
inverso à EMT, a transição Mesenquimal-Epitelial (MET). Este processo é
caracterizado pela diminuição na expressão de marcadores mesenquimais e
aumento de marcadores epiteliais, bem como aumento da adesão entre células.
EMT e MET têm papéis relevantes durante a progressão do cancro, como
proposto por diversos autores. Tem sido sugerido que células cancerosas,
derivadas de células epiteliais normais que tenham sofrido um conjunto de
alterações genéticas/epigenéticas, mediante sinais químicos determinados a partir
do microambiente, podem submeter-se a EMT ganhando assim mobilidade e
destacando-se do tumor primário. Estas células cancerosas invasivas poderiam
então intravasar para a corrente sanguínea e chegar a um local secundário no
organismo. A natureza reversível da EMT seria neste momento ser activada:
células cancerosas no local secundário, poderiam submeter-se a MET,
recuperando suficiente adesão entre células que leve à formação de tumores
secundários. Várias moléculas são capazes de induzir EMT in vitro, tais como
"bone morphogenic proteins" (BMP), "platelet-derived growth factor" (PDGF) e
"transforming growth factor beta 1" (TGF-β1). Estas moléculas podem ser
responsáveis por induzir EMT e, consequentemente, permitir a progressão de
cancro in vivo: por exemplo, as células cancerígenas podem segregar níveis não
fisiológicos de ligandos de receptores TGF-β que, tanto de uma forma parácrina
como autócrina, podem levar à progressão do tumor e formação de metástases.
A ocorrência de EMT/MET durante a progressão do cancro tem sido apoiada por
diversos factos, tais como a presença dos mesmos marcadores (epiteliais), tanto
em tumores primários como em metástases e a sobre-expressão de marcadores
mesenquimais na frente invasiva de tumores. No entanto, dado que as amostras
histológicas são um cenário estático e EMT/MET é caracterizada pelo seu
dinamismo, modelos in vitro que imitam a esses processos são essenciais para a
compreensão das alterações biológicas associadas com EMT/MET. Modelos in
vitro de EMT/MET podem ser a solução para descobrir novos marcadores
biológicos e mecanismos de regulação e, assim, novas abordagens terapêuticas.
Portanto o nosso objectivo foi estabelecer novos modelos in vitro de
EMT/MET, utilizando a citoquina TGF-β1 como um indutor, em linhas de
células "normais" e de cancro. No Capítulo Um desta Tese testámos várias
linhas celulares mamárias visando seleccionar a mais adequada para uma
indução de EMT. A expressão de vários marcadores epiteliais e mesenquimais foi
avaliada e MCF10A foi a linha celular seleccionada. No Capítulo Dois desta
Tese, demonstrámos a indução de EMT e MET nesta linha celular, criando assim
um novo modelo que recria fielmente o processo dinâmico de ganho (EMT) e
perdas (MET) de marcadores mesenquimais e variação oposta concomitante de
marcadores epiteliais. Estas variações foram confirmadas por análise da
expressão de proteínas e de ARN de vários marcadores. No Capítulo Três desta
Tese, apresentámos dados preliminares sobre a comparação entre o modelo
EMT/MET em MCF10A e um outro estabelecido pelo nosso grupo. Comparámos
a expressão e regulação de um gene recentemente anotado, Dies1, e
observámos que, embora com padrões semelhantes de variação de expressão, o
mecanismo regulador inerente é diferente em ambos os modelos. Esta
observação reforça a relevância da criação de novos modelos in vitro de EMT /
MET e salienta a importância do trabalho descrito nesta Tese.
GENERAL INTRODUCTION
NOVEL AVENUES FOR CANCER RESEARCH
In 2000, Hanahan and Weinberg published a review where they defined invasion and metastasis as hallmarks of cancer[1]. Although there was little knowledge on the mechanisms involved in these processes, the authors pointed that the activation of extracellular proteases and the alteration in the expression and function of cell-cell adhesion proteins, such as cadherins, and integrins were crucial for invasion and metastasis [1]. Later in 2011 another review from the same authors came out where they established a succession of cell-biologic changes: local invasion, intravasation into blood or lymphatic vessels, circulation of cancer cells through blood or lymph, extravasation, formation of micrometastases and finally, colonization [2]. The occurrence of metastatic spread of primary tumors is responsible for about 90% of cancer-related deaths[3]. For this reason during the past years, research concerning novel biological pathways/targets (in)activated during metastatic spread has dramatically increased, with several studies focused on the key biological process of Epithelial-Mesenchymal Transition (EMT).
Epithelial and mesenchymal cells are the two major types of cells present in every animal tissue [4]. These two types of cells are the most common however their phenotypes are not static. Under certain conditions these cells convert between each other by two processes: the Epithelial-Mesenchymal Transition (EMT) and the reverse Mesenchymal-Epithelial Transition (MET) [5]. Without these two processes the development of multicellular organisms would be impossible since they would not be able to evolve from the blastula stage of embryogenesis [6].
EMT AS A CANCER-RELEVANT BIOLOGICAL PATHWAY
What is EMT and why has it been the focus of so many cancer research studies? The Epithelial-Mesenchymal transition is a biological process involving the loss of some characteristics of epithelial cells, marked by loss of “cobblestone-like” phenotype due to rearrangement of the cytoskeleton that leads to changes in cell shape and organization, loss of cell polarity and cell-cell adhesion, and the gain of mesenchymal features, marked by the “spindle-shaped” phenotype leading to increased invasion ability, migratory capacity, resistance to apoptosis and increased production of ECM components[7]. The activation of transcription factors and the altered expression of specific cell-surface proteins also happen when epithelial cells undergo EMT: loss or decrease of expression of epithelial markers, such as adherens junction proteins (E-cadherin, β-catenin), tight junction proteins (occludin, claudin) and cytokeratins[8]. Concomitantly, EMT also leads to
the gain or increase of the expression of mesenchymal markers, such as Fibronectin, Vimentin and N-cadherin [7,8,9,10].
EMT can be divided in three subtypes according to its function: type 1 EMT occurs during embryogenesis, for example during gastrulation leading to the formation of the ectoderm, mesoderm and endoderm; type 2 EMT is associated with wound healing and tissue remodeling after a noxious event or injury in adult individuals; and type 3 EMT is directly associated with cancer and occurs in cells with de novo oncogenic ability and with several genetic and epigenetic alterations leading to metastatic dissemination [10].
The dynamic characteristic of the Epithelial-Mesenchymal Transition makes it impossible to be identified according to the parameters defined by pathologists [6,11]. Due to this, it took a long time to be accepted as important for tumor progression and both EMT and MET are now closely associated with invasion and metastasis [6]. In fact, in vitro and in
vivo studies have revealed several common features between EMT and cancer
progression: 1) invading carcinoma cells, thought to be responsible for invasion and metastasis, can display a mesenchymal phenotype and express mesenchymal markers such as Vimentin[12]; 2) tumor budding in colorectal cancer, a phenomenon by which tumor cells in the invasion front become detached and move towards the stroma in a EMT-like fashion[7]; 3) in some types of colon cancer, single migratory cells have been observed detaching from the primary tumor with concomitant loss of E-cadherin expression [7,13]; 4) in cervical cancer, tumor cells located in the invasive front have been shown to, besides displaying loss of E-cadherin, possesses increased Vimentin expression; 5) expression of many EMT drivers, such as Snail and Slug, in breast, colorectal and ovarian cancer, have been shown to be significantly correlated with poor clinical outcome [14].
However, David Tarin (2005) claims that EMT experiments in vitro are extremely artificial because cells cultured both in a two or three dimensional environments are not representative of vascular, endocrine or neurologic dynamism. The author also refers that the classification of cell lines as epithelial or mesenchymal is commonly based on cell shape and that the evaluation of one or a few markers is not enough to assume the occurrence of EMT, i.e., to conclude that a cell population has completely changed its whole-scale gene expression programming [11].
Even so, to extend the knowledge on these processes, there has been an attempt to establish several in vitro models from different origins (normal and cancer cell lines) that undergo partial or complete EMT in order to follow the dynamism of the transition [6]. In an in vitro condition, EMT can be induced using several extracellular factors such as: transforming growth factor-β (TGF-β), bone morphogenetic proteins (BMPs), Wnt, Notch
ligands, hepatocyte growth factor (HGF), platelet-derived growth factor (PDGF) and fibroblast growth factor (FGF) [15].
EMT,TGF-β PATHWAY AND CANCER
TGF-β1is a cytokine that is produced in our organism regulating proliferation and differentiation, involved in immune suppression, apoptosis, angiogenesis and also related to EMT during carcinogenesis [16,17,18].
TGF-β1 binds to membrane serine-threonine kinase receptor type 2 that recruit the type 1 receptor (TGFβR2 and TGFβR1, respectively) and activates its kinase activity by phosphorylation. The intracellular signaling is mainly transduced through Smad proteins; however it can also be a non-Smad signaling. After Smad2 or Smad3 are phosphorylated by TβRI, they associate with Smad4 and are translocated to the nucleus to modulate gene transcription. The receptors of TGF-β1 can also activate Erk, JNK, p38 MAP kinases, PI3 kinase and small GTPases like Cdc42 and Rac[15,16,18,19,20].
There has been much interest in studying the dual behavior of TGF-β during cancer progression, also known as “TGF-β Paradox”. In an earlier stage, Smads regulate the expression of many genes including c-myc, which is repressed and p21 and p15 that are induced. These genes promote the arrest of cell cycle in G1 phase preventing cells to divide [16]. However, it is very common the loss of this antiproliferative effect of TGF-β in cancer, e.g. due to mutations in components of the signaling cascade [18]. It has been observed resistance to the antiproliferative effect of TGF-β in head and neck squamous cell carcinomas, lung cancer, gastric cancer, colon cancer, pancreatic cancer, ovarian cancer and in some recurrent breast cancers [19].
With the aim to better understand the response to TGF-β1 and to determine the frequency of success in inducing EMT in vitro using TGF-β1, Brown and colleagues (2003) used an extended panel of 18 established normal and tumorigenic cell lines of human (epidermoid, breast, lung, pancreas and prostate) and mouse (epidermoid, mammary gland and kidney) origin and primary cultures of two human mammary epithelial cells. All cells were treated with the same amount of TGF-β1 (5ng/ml) for 48h. At the end of the experiments only NMuMG and MCT cell lines (a normal murine mammary gland epithelial and a murine proximal tubular cell line, respectively) underwent TGF-β1 mediated EMT, which was confirmed by the expression of E-cadherin, Zona Occludens 1 (ZO-1) and the formation of actin stress fibers. The authors have also seen formation of actin stress fibers in MCF10A cells (a normal human mammary gland epithelial cell line) but only after 6 days of culturing cells with TGF-β1. With this study, Brown et al. (2003) refuse the hypothesis that cells need to gain resistance to the antiproliferative effects caused by TGF-β since it was observed that these cells exhibited decreased S-phase of cell cycle
and underwent EMT [19]. Unlike these results, there are some reports of TGF-β induced EMT in vitro with different cell lines, e.g., established from prostate tumors [21] or non-tumorigenic mouse mammary cells [22].
The possible origin of EMT-inducing TGF-β pathway ligands has been recently explored by several groups. Moustakas et al (2002), suggest that cancer cells can start secreting non-physiological levels of TGF-β receptor ligands affecting not only their differentiation in an autocrine manner, but also the surrounding cellular environment in a paracrine manner, which leads to tumor progression and consequent metastasis [16].Another study, by Labelle et al(2001) has shown that contact between tumor cells and platelets can be sufficient to induce an EMT-like transition and invasive behavior in vitro, and to stimulate metastatic seeding in the lung in vivo. If we take into account that cancer cells, which are able to intravasate,can/will be in contact with platelets, the results of Labelle et al(2011) suggest a later acquisition of the mesenchymal phenotype, i.e., after leaving the primary tumor microenvironment. Therefore, cancer cells may/had to intravasate as epithelial cells via leaky blood vessels or via collective invasion mechanisms [23]. To confirm this hypothesis, the authors found expression of epithelial markers such as epithelial cell adhesion molecules and cytokeratins in circulating tumor cells, which suggest that EMT may be not crucial to access the blood flow. Labelle et al(2011)also collected results showing that the observed prometastatic effects were largely mediated via the activation of the TGF-β pathway. In addition, upon either TGF-β pathway abrogation in tumor cells or TGF-β expression inhibition in platelets there was no induction of EMT. This clearly indicates that platelets are an important source of this growth factor for tumor cells in circulation [23].
MET AND CANCER
Unlike EMT that has been extensively studied, the interest of the scientific community in understanding the reverse process, MET, is relatively recent. The Mesenchymal-Epithelial Transition is characterized by the down-regulation of mesenchymal markers and transcriptional factors such as N-cadherin, Zeb1 and Snail and also by the up-regulation of epithelial markers such as E-cadherin and Occludin. During MET, cells re-gain the polarity and establish more cell-cell adhesion contacts [4,6]. In 2010, Li et al found that it was possible to transform fibroblasts, which are a product of EMT, into induced pluripotent stem cells (iPSCs), via MET by suppressing pro-EMT factors, e.g., blocking TGF-β signaling. This was particularly interesting because it enabled the authors to unravel a key cellular mechanism to induce pluripotency that can be useful to produce pluripotent stem cells from an individual that are compatible with his/her own immune system [24].
Korpal et al (2011) have shown that the overexpression of miR200 family is associated with high risk of metastasis in breast cancer due to the ability to regulate MET and metastatic colonization in mouse models [25]. The findings of the authors indicate that both EMT and MET have an important role in different stages of metastatic colonization: while EMT is accompanied by low levels of miR200s, promote invasion and intravasation; MET and high levels of mirR200s are needed for successful colonization of distant organs [25]. These results are in line with Thiery's hypothesis suggesting MET as a necessary event that allows the establishment of metastases [6].
In conclusion, and to dissect whether these mechanisms have a parallel in clinical samples of cancer patients, it is mandatory to confirm the occurrence of EMT and/or MET in primary cancer and metastases samples. If that is the case, the identification of in vivo EMT/MET may provide the grounds to develop novel therapeutic approaches: on one hand by trapping disseminated cancer cells in a latent state of micrometastases, thus inhibiting the development of solid tumor metastases, and; on the other hand by targeting and preventing the re-epithelialization process which appears to be relevant for metastases establishment [26].
The creation of in vitro models that recreate EMT/MET are powerful tools as a first step to study these processes and this has been the major goal of this Thesis.
AIMS AND THESIS OUTLINE
The Epithelial to Mesenchymal Transition (EMT) hypothesis suggests that cancer epithelial cells, at the periphery of the tumor, receive signals from the surrounding stroma, thus acquiring properties that enable them to become motile and invade. Some recent reports also suggest that although EMT may drive the initial steps of the metastasis process, a reversion of the mesenchymal phenotype back to epithelia (MET) of malignant cells is needed to facilitate the establishment of macroscopic metastases. This has been proven essentially by using clinical samples of primary tumors and metastases from several cancer types, however the dynamic transition processes are difficult to assess. Therefore, the global aim of this study was to establish a dynamic in vitro model of
EMT/MET using human near-normal and cancer-derived breast cell lines, in order to better understand the alterations that occur during EMT and MET. Several molecules
exist that have been shown to be able to induce EMT in vitro. Many studies have been published which have used the cytokine TGF-β1 as an in vitro EMT inducer. Therefore, in
order to accomplish our global aim, we have elected this cytokine to establish our EMT/MET model.
The work enclosed in this Thesis has been divided in three distinct chapters. Each chapter has been subdivided into three sections: aims, results and discussion. Given that similar techniques were applied in all three chapters, this Thesis also includes a general
MATERIAL AND METHODS section. Concerning the work described in each chapter:
In CHAPTER ONE, we characterized several breast cell lines (near-normal and cancer-derived) aiming at selecting those with endogenous epithelial features as models for in vitro TGF-β1-induction of EMT/MET.
In CHAPTER TWO, the major focus was the generation of an EMT/MET in vitro model using the cell lines selected in Chapter One and TGF-β1 treatment. This Chapter enclosed two tasks: 1) finding the best suited concentration of TGF-β1 to induce EMT in vitro in each selected cell line and; 2) reversing EMT by removal of TGF-β1, to obtain a near-epithelial phenotype through MET. To confirm the occurrence of both EMT and MET, we characterized a panel of epithelial and mesenchymal markers at RNA and protein levels.
In CHAPTER THREE, we aimed at demonstrating the relevance of TGF-β1-induced EMT/MET models in the study of cellular regulatory functions. We herein present interesting results concerning the EMT/MET model established in the present work and a previous similar model (EpH4 EMT/MET in vitro model).
Integrated data from all chapters was summarized in the SUMMARY AND CONCLUSIONS section of this Thesis. Planned/ongoing applications of the established in vitro EMT/MET model were described in the FUTURE PERSPECTIVES section of this Thesis.
MATERIAL AND METHODS
NEAR-NORMAL AND CANCER-DERIVED BREAST CELL CULTURE
HB4a cells was derived from normal breast luminal cells and were cultured in RPMI (Invitrogen, Oregon, USA) culture medium supplemented with fetal bovine serum (10%, Lonza, Switzerland), penicillin-streptomycin (1%, Invitrogen, Oregon, USA),hydrocortisone (5µg/ml, Sigma-Aldrich, Missouri, USA), recombinant human insulin (5 µg/ml, Invitrogen, Oregon, USA), Cholera toxin (25 ng/ml, Sigma-Aldrich, Missouri, USA).
226L cell line, a normal epithelial mammary cell line was cultured in DMEM and F12 (1:1, Invitrogen, Oregon, USA) supplemented with fetal bovine serum (10%, Lonza, Switzerland), penicillin-streptomycin (1%, Invitrogen, Oregon, USA), hydrocortisone (1 µg/ml, Sigma-Aldrich, Missouri, USA), recombinant human insulin (5 µg/ml, Invitrogen, Oregon, USA), Cholera toxin (20 ng/ml, Sigma-Aldrich, Missouri, USA) and recombinant human epidermal growth factor (20 ng/ml, Sigma-Aldrich, Missouri, USA).
MCF10A cells derived from mammary gland were cultured in DMEM and F12 (1:1,
Invitrogen, Oregon, USA) supplemented with horse serum (5%, Lonza, Switzerland), penicillin-streptomycin (1%, Invitrogen, Oregon, USA), hydrocortisone (500 ng/ml, Sigma-Aldrich, Missouri, USA), recombinant human insulin (40 µg/ml, Invitrogen, Oregon, USA), Cholera toxin (100ng/ml, Sigma-Aldrich, Missouri, USA) and recombinant human epidermal growth factor (20 ng/ml, Sigma-Aldrich, Missouri, USA).
MCF 7AZ breast cancer cell line was cultured in DMEM and F12 (1:1, Invitrogen, Oregon, USA) supplemented with fetal bovine serum (10%, Lonza, Switzerland) and penicillin-streptomycin (1%, Invitrogen, Oregon, USA).
All cell lines were cultured at 37ºC and 5% CO2.All cell lines were kindly provided by
Joana Paredes (Cancer Genetics Group, IPATIMUP).
When referred, mesenchymal cells were obtained by supplementing the normal culture medium with Transforming Growth Factor β1 (TGF-β1, Sigma-Aldrich, Missouri, USA). Transient state cells were obtained by replacing the TGF-β1 enriched medium by normal culture medium.
RNA ISOLATION AND RT-PCR
RNA was isolated from the four cell lines using the mirVana miRNA Isolation Kit (Invitrogen, Oregon, USA), following the kit’s instruction manual. Complementary DNA (cDNA) was obtained from 1 µg of RNA of each cell line and random primers, for 10 minutes at 70ºC and 2 minutes at 4ºC. The enzyme SuperScript Reverse Transcriptase II (Invitrogen, Oregon, USA) was used for cDNA synthesis. The reaction occurred for 60 minutes at 37ºC. PCR reaction was performed using 50 ng of cDNA (forward and reverse
primers described in Table 1) and Taq Polymerase (GE Healthcare, USA). PCR was done using the following conditions: 5 minutes at 94ºC, 30 cycles of 30 seconds at 94ºC, 30 seconds at 60/56ºC (depends on the pair of primers used), 2 minutes at 72ºC and for last 10 minutes at 72ºC.
Table 1 – Primers sequence of TGF-β receptors 1 and 2 and of GAPDH.
TGFβR1 Forward GCAAAGGTCGATTTGGAGAAGT Reverse CTGCCAGTCCTAAGTCTGCAAT TGFβR2 Forward GGAGTACCTGACGCGGCATG Reverse GGTGGTTGAGCCAGAAGCTG GAPDH Forward TCAAGGCTGAGAACGCGAAG Reverse AGAGGGGGCAGAGATGATGA
WESTERN BLOT FOR E-CADHERIN,β-CATENIN AND FIBRONECTIN
HB4a, 226L, MCF10A and MCF7AZ cells were washed with PBS and then lysed in cold PBS containing 1% Triton X-100 Aldrich, Missouri, USA), 1% NP40 (Sigma-Aldrich, Missouri, USA), protease inhibitor cocktail (Roche, USA) and phosphatase inhibitor cocktail (Sigma-Aldrich, 1:100 dilution). Total protein was quantified using Bradford Protein Assay (Bio-Rad).
Equal amounts of total cell protein lysates from each cell line were subjected to 30% SDS-PAGE electrophoresis and then transferred to nitrocellulose membranes. After blocking with 5% nonfat milk, the membranes were incubated with primary antibodies against: E-cadherin (24E10, Cell Signalling, MA, USA); β-catenin (purified mouse anti-β-catenin, 610153, BD Transduction Laboratories) and Fibronectin (sc-69681, Santa Cruz Biotechnology). Next, menbranes were washed four times with PBS Tween solution, followed by incubation with horseradish peroxidase-linked secondary antibody for blot analysis. Blots were also probed with anti-actin antibody (Santa Cruz Biotechnology) or anti-tubulin antibody (Sigma-Aldrich) for loading control analysis.
IMMUNOFLUORESCENCE FOR E-CADHERIN,β-CATENIN AND VIMENTIN
HB4a, 226L, MCF10A and MCF 7AZ cells were grown in normal medium in 9mm Petri plates with coverslips (Becton Dickinson Labware, Franklin Lakes, NJ, USA) inserted. After adequate cell growth, the culture medium was removed and the cells were washed twice with PBS supplemented with calcium (1:100). Cells were fixed in ice-cold methanol for 10 minutes. Prior to incubation during 1 hour with a mixture of primary antibodies the cells were blocked with 5% bovine serum albumin for 30 minutes. The primary antibodies used were: anti-E-cadherin (24E10, Cell Signalling, MA, USA); anti-β-catenin (purified mouse anti-β-catenin, 610153, BD Transduction Laboratories); anti-Vimentin (Monoclonal mouse anti-Vimentin, MO725, Clone V9, DakoCytomation). After four washes with PBS, secondary antibody anti-rabbit or anti-mouse Alexa 488 or Alexa 594 (Invitrogen, Oregon, USA), were incubated for 1 hour at room temperature in the dark. Coverslips with cells were washed six times with PBS and mounted using Vectashield mounting medium containing DAPI (Vector Laboratories Inc, CA, USA). Images were taken with a Zeiss Imager.Z1, AxioCamMRm.
RNA EXPRESSION QUANTIFICATION
RNA was isolated from the four cell lines using the mirVana miRNA Isolation Kit (Invitrogen, Oregon, USA), following the kit’s instruction manual. Approximately 1000 ng of total RNA were reverse transcribed to single stranded cDNA using Superscript II Reverse Transcriptase and random hexamer primers (Invitrogen, Oregon, USA). Quantitative Real-Time-PCR (qRT-PCR, using a ABI Prism 7000 Sequence Detection System) was carried out in triplicates using source RNA, using TaqMan Gene Expression
Assays (Applied Biosystems, California, USA) or PrimeTime qPCR Assays (Integrated
DNA Technologies, Iowa, USA) for the following target genes: human
CDH1(Hs.PT.49a.3324071), Ocln (Hs.PT.49.14927371), CDH3(Hs00999918_m1), FN1
(Hs.PT.47.1565512), Vim (Hs.PT.47.14705389), CDH2 (Hs.PT.49.15618412),Zeb2 (Hs.PT.47.1778946), Dies1 (Hs00735289_m1), Id2 (Hs00747379_m1) and Id3 (Hs00171409_m1).. The endogenous control was human GAPDH (Hs02758991_g1). Data was analyzed by the comparative 2(-ΔΔCT) method. We performed t-test to evaluate the significance of the data obtained from the quantification of mRNA expression.
DIES1 METHYLATION STATUS ANALYSIS
DNA from a MCF10A E and TS cells was extracted using the kit Invisorb Spin Tissue Mini
Kit following the manufacturer’s instructions (STRATEC Molecular, Berlin, Germany).
Approximately 300 ng of DNA from each cell type was then subjected to complete bisulfite conversion and subsequent clean-up using the Epitect Bissulfite Kit following
manufacturer’s instructions (Qiagen, Hilden, Germany). Bisulfite treated DNA was amplified using primers flanking the predicted Dies1 promoter. This prediction was based on the classical approach of analyzing the bioinformatically predicted CpG islands within the gene’s locus, given the known association between CpG islands and promoter regions. The criteria used for CpG island prediction was as follows: 1) genomic area with >500 bp; 2) a percentage of CG>55 and; 3) the observed/expected CpG dinucleotides>0,65 (CpG Island Searcher Website). Concerning human Dies1 the predicted CpG island was located at chromosome 10:73533894-73534693 and the CpG sites analyzed were located at chromosome 10:73534292-73534425. The bisulfite PCR products were sequenced for methylation status determination.
C
HAPTERO
NEAIM
The objective of this part of the work was to characterize several breast cell lines(near-normal and cancer-derived) aiming at choosing those with the most adequate features to be used as an in vitro TGF-β1-induced EMT/MET model. We have assessed the expression (RNA and/or protein) of a set of epithelial and mesenchymal markers to characterize a series of cell lines using several techniques such as quantitative real-time-PCR (qRT-real-time-PCR), immunofluorescence, western blot (WB) and reverse transcriptase-real-time-PCR (RT-PCR). The selected cell line(s) would have to display key epithelial features: 1) classical cobble-stone morphology; 2) expression of epithelial markers; 3) absent/diminished expression of mesenchymal markers;4) expression of TGF-β receptors and; 5) literature supporting the feasibility of EMT induction.
RESULTS
1.PHENOTYPICAL FEATURES AND PROTEIN LOCALIZATION OF EPITHELIAL AND MESENCHYMAL MARKERS IN SEVERAL HUMAN BREAST CELL LINES
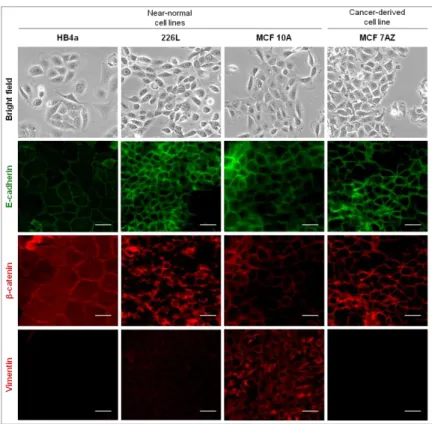
We started by characterizing three different near-normal cell lines of human mammary origin. HB4a cell line derives from normal breast luminal cells[27].Figure 1, in bright field microscopy images, displays the general morphology of a sub-confluent culture of the human HB4a cell line. As morphology is not enough to characterize a cell line as epithelial, we proceeded by characterizing the protein expression/localization by immunofluorescence of two known epithelial markers, E-cadherin and β-catenin, as well as of a mesenchymal marker, Vimentin. In Figure 1, in the column correspondent to HB4a cells, it is possible to observe that both E-cadherin and β-catenin localized at the cell membrane while no expression of Vimentin was detected.
The normal human epithelial mammary 226L cell line [28] morphology can be also observed in Figure 1, in bright field microscopy images. These cells exhibited an epithelial phenotype as well as E-cadherin and β-catenin localization at the cell membrane, and residual expression of Vimentin.
The third of the near-normal human cell lines chosen was MCF10A cell line, which derived from human fibrocystic mammary tissue [29]. Its epithelial morphology is present in the bright field microscopy images (Figure 1) and both E-cadherin and β-catenin were expressed at the cell membrane. These cells displayed considerable expression of Vimentin when compared to other cell lines, an observation confirmed in multiple biological replicas.
We also used a cancer-derived cell line, MCF7AZ, which is a variant of MCF7 human mammary carcinoma cell line[30]. These cells displayed an epithelial morphology as observed in the bright field microscopy images (Figure 1). MCF7AZ presented E-cadherin and β-catenin expression located at the cell membrane and the expression of Vimentin was absent, as it is possible to observe in the immunofluorescence images (Figure1).
Figure 1 –Characterization of three near-normal and one cancer-derived breast cell lines. Bright field microscopy images exhibit the epithelial phenotype of the parental cell lines (100x). All cell lines displayed an epithelial morphology with a typical cobble-stone phenotype. Immunofluorescence was performed for the four cell lines using antibodies for epithelial markers (E-cadherin (green), β-catenin (red)) and mesenchymal markers (Vimentin (red)). The white scale bar corresponds to 50 µm. All cell lines displayed E-cadherin and β-catenin expression at the cell membrane. Vimentin expression was detected in 226L and MCF10A.
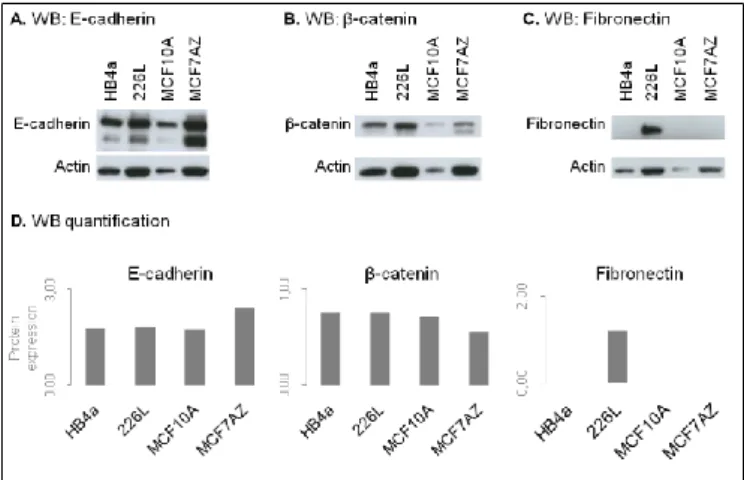
Using total protein lysates extracted from all four cell lines we assessed the expression profile of the abovementioned epithelial markers, as well as of Fibronectin, a mesenchymal marker (by WB).We did not assess Vimentin by WB and Fibronectin by immunofluorescence due to technical difficulties. All cell lines expressed E-cadherin and β-catenin as it was expected and only 226L expressed Fibronectin (Figure 2A-C). After adequate normalization to actin (endogenous control) we observed that MCF7AZ displayed the highest levels of total E-cadherin, while all other cell lines displayed similar levels (Figure 2D). Concerning β-catenin, all cell lines displayed similar levels (Figure
Figure 2 – Protein expression of epithelial and mesenchymal markers across all selected cell lines (one biological replicate). Results of the Western Blot performed for E-cadherin (A), β-catenin (B), Fibronectin (C) using total protein lysates extracted from HB4a, 226L, MCF10A and MCF7AZ cell lines. D. Quantification of the bands present in A, B and C. All cell lines expressed both epithelial markers and only 226Lcell line expressed Fibronectin.
2. QUANTIFICATION OF GENE EXPRESSION OF SEVERAL EPITHELIAL AND MESENCHYMAL MARKERS
For each cell line we collected total RNA to evaluate and quantify the expression of several genes known to be markers of epithelial or mesenchymal cells. For this, we used the quantitative real-time-PCR (qRT-PCR) technique, not aiming at comparing the expression levels between samples, rather observing whether each gene was expressed or not.
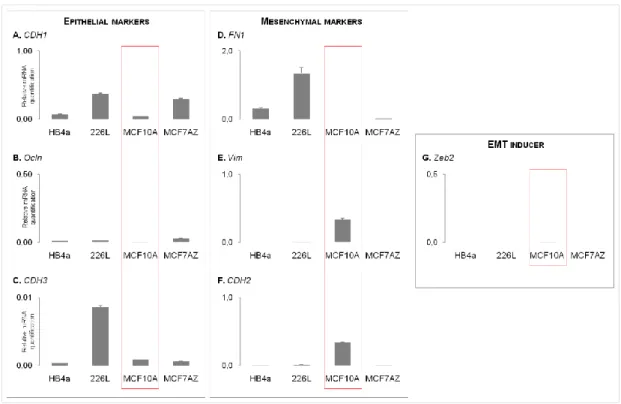
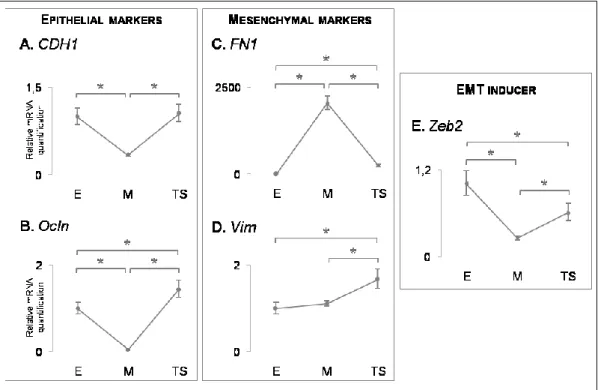
The epithelial markers evaluated were: 1)CDH1, which encodes for E-cadherin and was detected in all cell lines(Figure3A); 2) Ocln, which encodes for Occludin, a tight-junction component, which was also detected in all cell lines (Figure3B) and; 3) CDH3, which encodes for P-cadherin, again expressed in the four cell lines (Figure 3C).
Next, we evaluated the RNA expression of three mesenchymal markers: 1) FN1, which encodes for Fibronectin and was expressed in 3 out of 4 cell lines, being MCF10A the only cell line that was negative for the expression of this gene (Figure 3D); 2) Vim, which encodes for Vimentin, was only expressed in 226L and MCF10A cell lines (Figure 3E) and; 3) CDH2, which encodes for N-cadherin, was expressed in all cell lines (Figure 3F). In addition, we evaluated the RNA expression of the EMT inducer Zeb2, which displayed a residual expression in the MCF10A cell line.
Figure 3 – mRNA expression of epithelial and mesenchymal markers across all selected cell lines (one biological replicate). Expression levels of epithelial markers: CDH1 (A), Ocln (B) and CDH3 (C); Expression levels of mesenchymal markers: FN1 (D), Vim (E) and CDH2 (F). Expression levels of the EMT inducer Zeb2 (G). Expression pattern of the assessed markers led to the choice of MCF10A for EMT/MET induction (highlighted by a red box).
3.EXPRESSION OF TGF-β RECEPTORS 1 AND 2
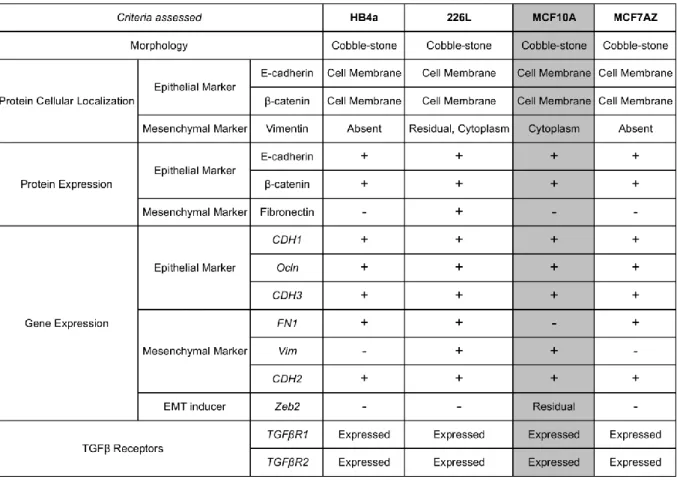
One of the goals of this part of the work was also to choose the cell line(s) with operational TGF-β receptors 1 and 2 (TGFβR1, TGFβR2), crucial for TGF-β pathway activation. The absent expression of one of the TGF-β receptors would be an exclusion criterion. Therefore, we performed a RT-PCR to confirm the expression of TGFβR1 and TGFβR2. In Figure 4we can observe that all four cell lines expressed both receptors. All cell lines studied had the phenotypical features and E-cadherin/β-catenin expression/localization expected for epithelial cell lines (Table 1). In addition, similar results were observed concerning epithelial markers’ gene expression. Concerning the mesenchymal marker Fibronectin, we observed: 1) protein expression was only detected in 226L although its RNA was detected also in HB4a and MCF7AZ; 2) neither protein nor RNA expression was detected in MCF10A cell line, an observation crucial for the cell line selection process (Table 1).
Figure 4 –TGFβR1 and TGFβR2 expression in HB4a, 226L, MCF10A and MCF7AZ cell lines. NC refers to the negative control. All cell lines expressed both receptors.
In fact, we selected the MCF10A cell line for our next studies given that: 1) previous studies in our group have already emphasized the relevance of FN1 as a key mesenchymal marker in an established in house mouse EMT/MET in vitro model [22]; 2) past studies have shown that it is possible to induce EMT in MCF10A, unlike HB4a and 226L for which no studies have been published. In addition, we have also selected the MCF7AZ cell line for our next studies given that it is cancer-derived and could be viewed as a pathological counterpart of the MCF10A cell line.
DISCUSSION
In this part of the study we characterized a series of cell lines with the goal of choosing at least one with the adequate features to be used in an in vitro human TGF-β1-induced EMT/MET model.
All cell lines that were studied had the classical features of epithelial cells: classical cobble-stone morphology; expression of E-cadherin and β-catenin (RNA and/or protein level)at the cell membrane; expression of TGF-β receptors, and; expression, at the RNA level, of a panel of epithelial markers (Table 1).
Despite the presence of epithelial markers, all cell lines expressed at least one mesenchymal marker (Table 1): HB4a presented expression of FN1 and CDH2; 226L displayed FN1, Vim and CDH2 expression; MCF7AZ expressed FN1 and CDH2 and; MCF10A exhibited Vim and CDH2. Concerning Vim/Vimentin expression in MCF10A cell line, this result was confirmed in distinct biological replicas and it has also been reported in the literature[31]. This cell line also displayed residual levels of Zeb2, again in agreement with current literature [32]. Nevertheless, MCF10A cell line is currently considered a bonafide model of an epithelial cell line, thus fulfilling the requisites to be used as a model for TGF-β1-induced EMT/MET model. Therefore, we decided to choose MCF10A cell line to establish our in vitro model of EMT/MET. In addition, there have been studies reporting that EMT can be efficiently induced in vitro using MCF10A cells cultured with TGF-β1-enriched-medium [19,33,34]. Concerning HB4a and 226L cell lines there are, currently no studies that have used these cell lines for EMT induction. In addition, both cell lines display FN1 expression, a key mesenchymal marker [22]. Therefore, we did not select any of these cell lines for the next steps of this study.
Due to the connection of EMT with tumor progression, as discussed in General
Introduction, it would be interesting to have a pathological counterpart for the induction of
EMT. As the cancer-derived cell line MCF7AZ fulfills the criteria established for the definition of an epithelial cell line, we decided to include this cell line in the experiments of Chapter Two.
C
HAPTERT
WOInduction of mesenchymal phenotype
Recovery of epithelial phenotype
AIM
The major focus of this part of the work was to induce EMT using TGF-β1and to be able to reverse the process, thus creating a dynamic EMT/MET in vitro model. To accomplish this aim, we have used the cell lines selected in the previous Chapter, MCF10A and MCF7AZ. The first task was to find the best-suited concentration of TGF-β1 to induce EMT in vitro in both cell lines. The second task was to reverse EMT, thus inducing MET by allowing cells that have undergone EMT to re-acquire an epithelial phenotype.
To confirm the occurrence of both EMT and MET, we have characterized a panel of epithelial and mesenchymal markers (RNA and/or protein) in each step of these transitions using techniques, such as qRT-PCR, immunofluorescence and WB.
RESULTS
1. OPTIMIZATION OF TGF-β1CONCENTRATION ABLE TO INDUCE EMT IN MCF10A AND
MCF7AZ CELL LINES
To test the best concentration of TGF-β1 to induce EMT we have cultured both cell lines with normal culture medium enriched with 10 or 20 ng/ml of TGF-β1. With this experiment we aimed at observing alterations on: 1)the morphology of cells; 2) protein expression/localization by immunofluorescence and; 3) RNA expression by qRT-PCR.
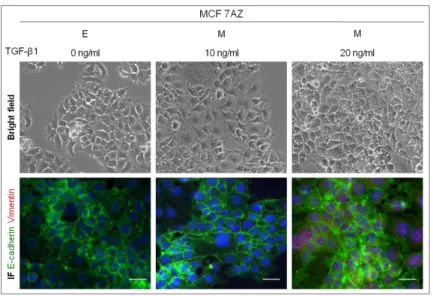
1.1 Cancer-derived cell line MCF7AZ
When cultured in normal medium enriched with 10 or 20 ng/ml of TGF-β1, MCF7AZ cells did not lose the epithelial morphology, represented in the bright field microscopy images of Figure 1. In the co-immunofluorescence images of Figure 1 it is possible to observe that the cell membrane expression of E-cadherin was not lost and that Vimentin did not form fibers, as it was expected if these cells had undergone classical EMT.
Figure 1 – Effect of distinct TGF-β1 concentrations on EMT induction in MCF7AZ cell line. The cells were treated with different concentrations of TGF-β1 (0, 10 and 20 ng/ml) in order to induce EMT. For each condition is represented a bright field microscopy image (100x) and a co-immunofluorescence for E-cadherin (green) and Vimentin (red). No alterations were observed with any of the distinct TGF-β1 concentrations tested. The white scale bar corresponds to 50 µm.
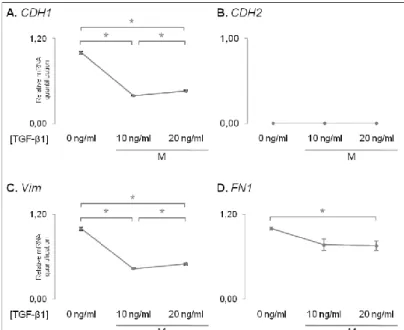
Next, we evaluated the expression at theRNA level of key epithelial and mesenchymal markers by qRT-PCR on MCF7AZ cells cultured under varying TGF-β1 concentrations. We observed that the expression of CDH1 significantly decreased when MCF7AZ cells were cultured with both 10 and 20 ng/ml of TGF-β1 (p-value=6,30E-06 and 4,16E-05 in comparison with no TGF-β1 added, Figure 2A). However, the mesenchymal markers did not indicate the occurrence of EMT: 1) CDH2 expression was not detected in any condition (Figure2B); 2) Vim significantly decreased even when the highest concentration of TGF-β1was added (p-value=2,02E-05 and 2,58E-05 in comparison with no TGF-β1 added, Figure2C) and; 3)FN1 also had a significant decrease in expression however only when the 20 ng/ml of β1 were added (p-value=2,59E-02 in comparison with no TGF-β1 added, Figure2D). Interestingly, both in the case of CDH1 and Vim expression, MCF7AZ cells subjected to TGF-β1 treatment displayed significant differences when comparing the two concentrations tested: with 20ng/ml of TGF-β1, the levels of CDH1 and
Vim where superior to those detected with 10 ng/ml of TGF-β1, although still significantly
lower than those observed in the absence of this cytokine (p-value=1,25E-02 for CDH1 and 1,54E-02 for Vim when comparing TGF-β1 concentrations of 10ng/ml vs. 20ng/ml,
Figure 2 – Results of relative mRNA quantification obtained using qRT-PCR technique of epithelial and mesenchymal markers of MCF 7AZ cells treated with different concentrations of TGF-β1. A. CDH1 gene (epithelial marker) exhibit a decreased expression in cells treated with TGF-β1 independently of the concentration used. CDH2 (B), Vim (C) and FN1 (D) genes (mesenchymal markers) also display decreased expression with the increase of TGF-β1 concentration. Asterisk stands for significant comparisons (p<0.05).
Several attempts were made to induce EMT on MCF7AZ cells, varying different culture conditions, such as the confluence state of cells (data not shown). The results obtained were similar to those presented previously.
The results described lead us to believe that MCF7AZ was not an EMT inducible cell line, at least not with TGF-β1 as an EMT driver. For this reason we did not perform any other experiments with this cell line.
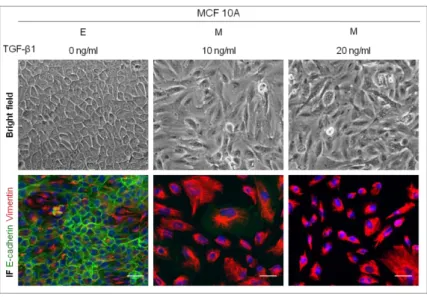
1.2 Near-normal cell line MCF10A
We followed the same strategy described previously to assess the best adequate TGF-β1 concentration to induce EMT in the MCF10A cell line. Unlike MCF7AZ cells, we were able to induce EMT in MCF10A cells, as indicated by bright field microscopy (Figure 3). The morphological alterations upon TGF-β1 treatment (both 10 and 20 ng/ml) point to the successful EMT occurrence.
Alterations of protein expression/localization were also detected by co-immunofluorescence for E-cadherin and Vimentin (Figure 3). Cells cultured withoutTGF-β1 added, displayed expression of E-cadherin at the cell membrane. However, this pattern of expression was lost
Figure 3 – Effect of distinct TGF-β1 concentrations on EMT induction in MCF10A cell line. The cells were treated with different concentrations of TGF-β1 (0, 10 and 20 ng/ml) in order to induce EMT. For each condition is represented a bright field microscopy image (100x) and a co-immunofluorescence for E-cadherin (green) and Vimentin (red). The white scale bar corresponds to 50 µm. When cells were treated with 10 and 20 ng/ml of TGF-β1, E-cadherin lost its typical expression and fibers of Vimentin were formed. The white scale bar corresponds to 50 µm.
in cells cultured with both 10 and 20 ng/ml of TGF-β1 and was replaced by a strong expression of Vimentin forming well defined fibers.
Next, we evaluated the expression of epithelial and mesenchymal markers by qRT-PCR on MCF10A cells cultured with distinct concentrations of TGF-β1.
Figure 4 –Relative mRNA quantification of epithelial and mesenchymal markers in MCF10A cells treated with different concentrations of TGF-β1.A.CDH1 gene (epithelial marker) exhibit a
CDH2(B), Vim(C) and FN1(D) genes (mesenchymal markers) display a trend to increase its expression with the increase of TGF-β1 concentration. Asterisk stands for significant comparisons (p<0.05).
The results confirmed that MCF10A effectively underwent EMT. We observed that
CDH1significantly decreased when MCF10A cells were cultured with 10 and 20 ng/ml of
TGF-β1 (p-value=4,52E-10 and p-value=5,02E-07 in comparison with no TGF-β1 added,
Figure 4A). Concerning the mesenchymal markers: 1) CDH2 significantly increased when
cells were cultured with 10 and 20 ng/ml of TGF-β1 (value=1,73E-07 and p-value=1,69E-08, in comparison with no TGF-β1 added, Figure 4B); 2) Vim also had a significant increase when cells were cultured in the presence of 10 and 20 ng/ml of TGF-β1 (p-value=7,63E-09 and p-value=3,83E-09, in comparison with no TGF-TGF-β1 added,
Figure 4C)and; 3) similar to CDH2 and Vim, FN1 also significantly increased with 10 and
20 ng/ml of TGF-β1 being added to the culture medium (value=7,71E-10 and p-value=3,19E-09, in comparison with no TGF-β1 added, Figure 4D).The three mesenchymal markers tested also showed a significant increase when comparing the results of culture with 10 ng/ml with 20 ng/ml, indicating a dose-dependent expression (p-value=7,30E-05, 6,74E-06, 6,62E-05 for CDH2,Vim andFN1 when comparing TGF-β1 concentrations of 10ng/ml vs. 20ng/ml, Figure 4B-D). No dose-dependent expression was observed for CDH1 expression.
Given that both TGF-β1 concentrations efficiently induced EMT on MCF10A cells, as confirmed by the significant alterations detected for all markers tested, we selected the lowest concentration (10 ng/ml) for the subsequent experiments. We have also renamed MCF10A cells after TGF-β1 treatment as Mesenchymal MCF10A cells (M cells).Since our results supported the occurrence of EMT in MCF10A cells, we used only this cell lineto perform the EMT reversion.
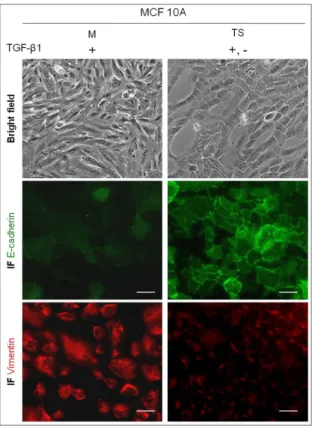
2.MET, THE RECOVERY OF THE EPITHELIAL PHENOTYPE?
We reproduced again the EMT process using only the chosen concentration of TGF-β1 (10ng/ml) in order to obtain mesenchymal MCF10A cells (M cells).As expected, we observed an acquisition of a spindle-shaped morphology (bright field microscopy images), the loss of the typical expression of E-cadherin (IF) and the formation of Vimentin fibers in M cells indicating that EMT had occurred. Next, we continued to grow M cells in culture medium, deprived of TGF-β1. The culture of M cells was interrupted when bright field microscopy images pointed towards a recovery of an epithelial phenotype. These post-EMT epithelial-like MCF10A cells were renamed as transient state cells (TS cells, Figure
partial recovery of epithelial features. In addition, by immunofluorescence, we observed that E-cadherin expression was recovered to some extent at the cell membrane (Figure
3). Regarding the expression of Vimentin (Figure 5), by immunofluorescence it was
possible to observe that the fibers formed in M cells were lost in TS cells: in fact, the pattern of Vimentin expression observed in E cells was recovered in TS cells.
Figure 5 –MET, the recovery of the epithelial phenotype after the removal of TGF-β1 from the culture medium. M stands for mesenchymal cells and TS stands for transient state cells. Bright field microscopy images showing the recovery of the cobble-shaped phenotype of cells (100x). The re-expression of E-cadherin at the cell membrane can be observed by immunofluorescence (IF). The loss of Vimentin expression is evident when comparing M with TS cells by immunofluorescence. The white scale bar represents 50 µm.
Facing these results it was our conviction that our in vitro model successfully mimicked EMT which was then successfully reverted indicating the occurrence of MET.
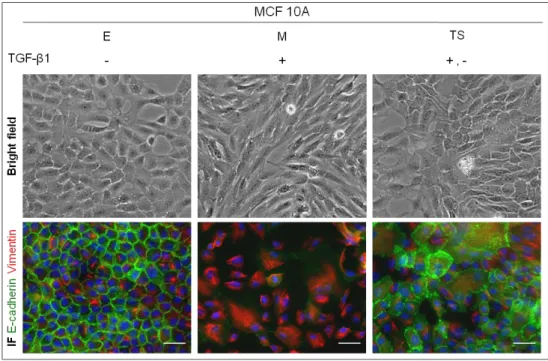
3.THE ESTABLISHMENT OF A HUMAN IN VITRO EMT/MET MODEL
We have successfully created an in vitro model of EMT and MET, using the human epithelial cell line MCF10A (Figure 6). Figure 6 summarizes the alterations in morphology and in protein expression/localization of MCF10A cells through the three steps of EMT/MET: E cells, the original cell line; M cells, upon EMT induction and; TS cells, generated after MET (or partial MET) occurrence.
By immunofluorescence, we observed a significant loss of E-cadherin expression in M cells, later recovered in TS cells (Figure 6). Concerning Vimentin expression, immunofluorescence revealed an altered pattern of expression, exclusively in M cells which displayed well defined fibers, in line with EMT occurrence (Figure 6).
Figure 6 – EMT/MET model validation. Bright field microscopy images showing the phenotypical alterations and co-immunofluorescence for E-cadherin and Vimentin during EMT/MET induction (100x). E stands for epithelial cells, M stands for mesenchymal cells and TS stands for transient-state cells. E cells lose the cobble-shaped phenotype to become M cells and a partial recovery of the cuboid phenotype occur in TS cells. In the co-immunofluorescence images M cells lose the E-cadherin expression at the cell membrane and acquire a filamentous expression of Vimentin. TS cells recover some expression of E-cadherin and lose Vimentin expression. The white scale bar represents 50 µm.
Figure 7 – Protein expression of epithelial and mesenchymal markers during EMT and MET (one biological replicate). Results of the Western Blot performed for E-cadherin (A), β-catenin (B), Fibronectin (C) using total protein lysates extracted from E, M and TS cells from the in vitro model of EMT/MET using MCF10A cells. D. Quantification of the bands present in A, B and