THE IMPLICATIONS OF SERVICE QUALITY GAPS FOR STRATEGY IMPLEMENTATION
Carlos J. F. Cândido
FEUA, Universidade do Algarve, Campus de Gambelas, 8000-117 Faro, Portugal.
D. S. Morris
School of Business and Finance, Sheffield Hallam University, Sheffield S1 1WB, UK.
Abstract
This article addresses the problem of service quality strategy implementation and proposes three interrelated models: a static model of the organisation; a comprehensive dynamic model of the implementation process, both synthesised from the literature; and a mixed model, which integrates static and dynamic models. The mixed model is combined with the service quality gaps (SQGs) model, drawn at a previous congress paper, to propose a map of the pattern of SQGs occurring at each implementation stage; the organisational variables that can be manipulated to eliminate SQGs; and several implications to practising managers.
Introduction
This article addresses the problem of service quality strategy implementation and proposes three interrelated models of strategy implementation, with theoretic and managerial implications. The main reasons for addressing this problem and developing those models can be briefly stated as follows. First, services constitute the largest sector of the world economy (Bateson, 1995) and its importance seems to be growing. Second, quality strategy is clearly an important differentiation strategy, both for service and manufacturing industries. Third, strategy literature, in general, lacks implementation models (Mockler, 1995), and quality gurus, in particular, have abdicated responsibility for delineating comprehensive and coherent patterns of implementation (Morris & Haigh, 1996). Fourth, the failure rate of TQM implementation is, in practice, very high and estimated in the vicinity of 80% (Voss & O’Brien, 1992). These reasons are strong enough to motivate research in the area of strategy implementation and, particularly, in the field of service quality strategy implementation.
A look at the strategy implementation literature suggests that existing models can be separated into two distinct types: static models and dynamic models. This article considers several different examples of both to propose a general concept and a synthesised model encompassing both types. Static models are representations of the organisation at a given instant, whereas dynamic models are processes for implementing strategic changes. Note that whilst the two kinds of models address the implementation problem from different perspectives they are not in competition. In fact, it is the view of the authors that static and dynamic models are complementary and have to be integrated into a “mixed model”, in order to provide a better understanding of strategy implementation.
With the models explained, the mixed model is then linked to the service quality gaps (SQGs) that have been previously defined (Cândido & Morris, 2000). The features of this “linkage” have implications for management on how to anticipate, prevent and eliminate SQGs during the strategy process.
This is a postprint version of an article submitted for consideration in the
Available at: http://www.tandfonline.com/doi/abs/10.1080/09544120100000003 Copyright by Taylor and Francis Total Quality Management journal, printed in 2001, Volume 12, Issue 7&8, pp. 825-833.
Static model
To change the behaviour of a group, all the circumstances involving that group have to be analysed (Lewin, 1952). Similarly, to change the behavior of an organisation, all of its important aspects should be studied. Some models have been proposed to help identify the fundamental aspects of an organisation at a given period. Since they focus on a short period of time, or an instant, they can be called “static models”. Static models are, thus, representations of the organisation, at a given moment, which identify, define and interrelate the fundamental organisational dimensions for successful strategy implementation.
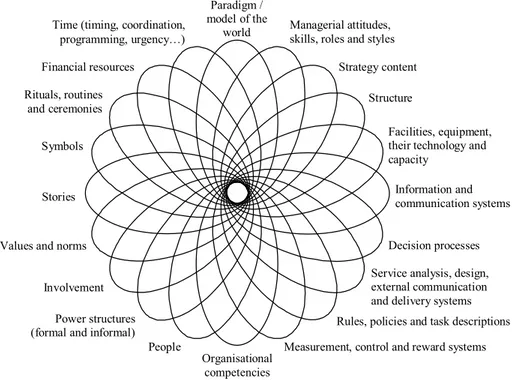
There are several static models, each emphasising specific dimensions of an organisation. A famous example is the “7-S framework”, introduced by Peters et al. (1980). Other relevant examples of static models are the common “systems approach” (e.g., Stoner et al., 1995); Ansoff & McDonnell’s (1990) organisational capability model; Johnson & Scholes’ (1999) cultural web; Galpin’s (1997) influence systems model; as well as Leavitt’s (1964); Irons’ (1991); and Hussey’s (1996) models. These are very different in the number and in the nature of the dimensions that they include. Thus a more comprehensive model has been synthesised, which is depicted in Figure 1. By listing twenty essential dimensions – represented as ellipses – and by overlapping each ellipse with every other, the model emphasises the diversity of dimensions that can be involved in strategy implementation and the intricacy of their relationships. Definitions are not provided here, but have been compiled from the references given above and other sources.
Figure 1. Synthesised static model – fundamental dimensions of strategy implementation Paradigm /
model of the
world Managerial attitudes,skills, roles and styles
Strategy content Structure
Facilities, equipment, their technology and capacity
Information and communication systems
Decision processes Service analysis, design, external communication and delivery systems Rules, policies and task descriptions Measurement, control and reward systems Organisational
competencies People
Power structures (formal and informal)
Involvement Values and norms
Stories Symbols Rituals, routines
and ceremonies Financial resources
Time (timing, coordination, programming, urgency…)
can be changed and have to be coordinated and aligned coherently (Peters et al., 1980; Hussey, 1996);
must be monitored and subjected to information collection and distribution; may be in a zone of uncomfortable organisational debate, because of vested
interests, bases of power, attitudes and beliefs (Johnson & Scholes, 1999); and are interdependent and when changed affect all the others. Some of these effects
will be helpful or compensatory; others will be harmful or retaliatory (Leavitt, 1964; Leavitt et al., 1973).
These twenty dimensions, and their relationships, can determine the success or failure of any strategic change (Johnson & Scholes, 1999; Hussey, 1996). Thus, they have been grouped in an instrument that can be used to facilitate a better and richer diagnosis (Peters, 1984); to stimulate thinking; to assess the extent of change necessary in each dimension (Johnson & Scholes, 1999); and to help in planning for change. Essentially, the model aims to provide a list of all basic dimensions that can constitute important areas for management intervention during strategy formulation and implementation. The model, however, does not imply that managers must intervene on all twenty variables. The specific group of dimensions that a manager will choose to manipulate depends on his personal experience and knowledge. But, more importantly, the choice should depend on the current internal and external situation of an organisation, particularly, on the SQGs that have been identified before and during implementation.
Dynamic model
Dynamic models are generic processes of strategy formulation and implementation. They indicate and define the stages that can be followed to successfully implement a strategy which significantly modifies the current situation of an organisation on most or all of its dimensions.
What distinguishes these dynamic models from traditional strategic decision making processes (e.g., Gore et al., 1992) is a higher concern for overcoming implementation difficulties. Traditional strategic decision making processes suffer from employees’ resistance to change, because they leave to the end the persuasion of those who have to implement the strategy, whereas dynamic models overcome resistance by:
stressing the «importance of achieving the [previous] commitment of people in the organisation to change» (Johnson & Scholes, 1999); and by
viewing «the need for behavioural change not only in terms of that which is formally controlled, but also in terms of everyday aspects of organisational life» (Johnson & Scholes, 1999).
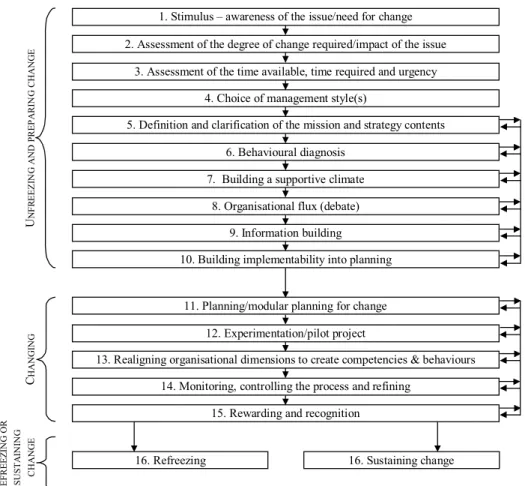
Examples of such dynamic models are those given by Lewin (1952), Schein (1964), Ansoff & McDonnell (1990), Hussey (1996), Galpin (1997), and Johnson & Scholes (1999). These models are not based on coercion, slow adaptation, or crisis management. They fall in the category of managed change methods (Johnson & Scholes, 1999); also designated as managed resistance strategic change methods (Ansoff & McDonnell, 1990). Such dynamic models are, however, extremely different in the number and in the nature of the stages they include, which suggests the need for an integrative effort. Figure 2 represents a synthesis.
Figure 2. Synthesised dynamic model of strategy implementation
11. Planning/modular planning for change 12. Experimentation/pilot project
13. Realigning organisational dimensions to create competencies & behaviours 14. Monitoring, controlling the process and refining
15. Rewarding and recognition
16. Refreezing 16. Sustaining change
7. Building a supportive climate 8. Organisational flux (debate)
9. Information building 10. Building implementability into planning
5. Definition and clarification of the mission and strategy contents 6. Behavioural diagnosis
1. Stimulus – awareness of the issue/need for change 2. Assessment of the degree of change required/impact of the issue
3. Assessment of the time available, time required and urgency 4. Choice of management style(s)
U N F R EEZ IN G A ND PREP A RIN G CHANG E C HANG IN G R EFREEZ IN G OR SUSTA IN IN G C HANG E
Detailed description of each stage is not provided here; only a brief explanation of the three main groups of stages: unfreezing, changing and refreezing. Unfreezing is the disturbance of the current cognitive and emotional stable equilibrium of individuals in the organisation (Lewin, 1952; Schein, 1964) to make them aware of the need for individual and organisational changes (Johnson & Scholes, 1999). Support for undesired old attitudes is removed, whereas support for desired new attitudes is maximised (Schein, 1964). Unfreezing includes three important stages which are ignored by traditional strategic decision making processes: (1) behavioural diagnosis of the organisation, particularly of the forces pro and against change; (2) development of a supportive climate for change; and (3) development of implementability features that facilitate planning and implementation.
Changing entails moving to a new standard of group behaviour (Lewin, 1952). It requires a presentation of the direction for change, planning it, and the «actual process of learning new attitudes» (Schein, 1964). Involving people in planning the details of change gives them the opportunity to help forge the new strategy and to learn through problem solving. Changing must also include the actual execution of actions that lead to a new external competitive positioning and to the development of a new organisational
capability (Ansoff & McDonnell, 1990), as well as monitoring, measuring, refining and rewarding.
Refreezing is a period of stabilisation of the new standards of behaviour (Lewin, 1952). It validates, confirms and institutionalises the changes already made and the new organisational model that has been brought into being (Johnson & Scholes, 1999). Refreezing may require some additional changes and is completed only when «the new culture and power structure are [fully] supportive of the new strategy» (Ansoff & McDonnell, 1990). Sustaining change is an alternative to refreezing and consists of sustaining the ability to change continually.
The whole process in this dynamic model has been disaggregated into sixteen stages (Figure 2). The particular sequence of these stages may be contestable, but the sequence of steps and the definitions given for each stage, in the six models that have been studied, are not easily reconciled. This suggests that there is no one best method for all organisations, and that the method synthesised here may have to be adjusted according to circumstances. The sequence of stages is difficult to establish also because:
Some stages may be interrupted and resumed later or may occur more than once, in an iterative cycle. For instance, information building and organisational debate may occur more than once.
Some stages may overlap with others. For example, modular planning may overlap with experimentation or realignment (Ansoff & McDonnell, 1990). These stages are, however, separated and individualised because they are sufficiently important parts of the process and because of their identifiable, distinct nature. It might be noted that some stages in Figure 2 are closely identified with just one of the elements of the static model. This close identification of one stage with one element does not mean that other dimensions are not relevant during the stage, nor that the emphasised element looses importance and should not be monitored nor managed during other stages. This is further discussed below.
Mixed model
The implementation of a new strategy creates «a new synthesis of people, resources, ideas, opportunities and demands» (Carnall, 1991), which involve changes on many organisational dimensions. Organisational dimensions are interrelated in highly complex ways and some changes will have “secondary effects” that are not desirable, nor even anticipated by managers (Leavitt, 1964). Thus, some dimensions may change in directions opposite to their desired final states. This implies that they must be examined at each stage of the implementation process (Hussey, 1996) and that timely corrective action must be taken. More generally, strategy implementation must involve the monitoring, decision making and manipulation of organisational dimensions at each and every stage of the process.
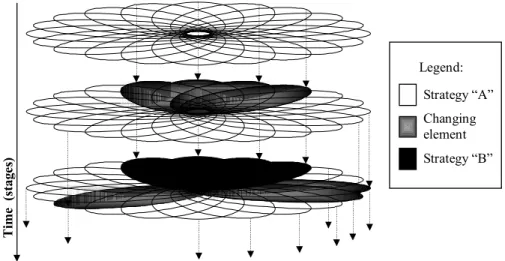
Since an organisational dimension can be monitored and manipulated several times, at distinct stages, the logical next step is to combine the organisational dimensions, represented in the static model, with the stages of the dynamic process into one framework. This is undertaken in Figure 3 and is designated a strategy implementation mixed model, or just mixed model.
Figure 3. Mixed model: example of some stages in changing from strategy “A” to “B” Time (stag es ) Legend: Strategy “A” Changing element Strategy “B”
The static model previously synthesised (see Figure 1) is represented at three different stages of the strategy implementation process (dynamic model). As before, each ellipse represents one organisational dimension. In the beginning of the strategy process, top of Figure 3, Strategy “A” is deeply rooted in every dimension of the organisation, and all ellipses are represented in white. At a later stage, some changes have been made, and the affected organisational elements are represented in grey. These modifications continue until the desired final condition of those dimensions is achieved. Other dimensions will eventually start to change and, before the refreezing stage is reached, most or all of the twenty dimensions will have gone through some change. While in the concluding stage of the process – refreezing – the desired states of all dimensions are finally achieved. During this process, each dimension can be monitored and changed several times; according to its relevance to the new strategy, to unanticipated changes, and to the desired outputs of each stage. Thus, a succession of distinct configurations of the organisational dimensions should occur, as shown in Figure 3.
Distribution of service quality gaps (SQGs) in the mixed model
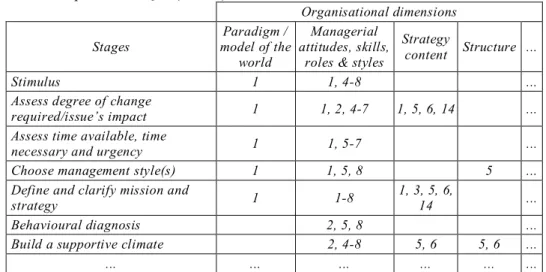
The mixed model can be further developed in the form of a table. The rows in the table correspond to the stages of the process, and the columns correspond to the organisational dimensions. The cells in the table indicate the strength of the impact of each dimension on each stage and/or the need for change on each dimension during the stages. This new approach to the mixed model has actually been brought to fruition but is not shown here. What is shown here is the integration of that table with the SQGs model developed at a previous article (Cândido & Morris, 2000). Table 1 is an extract that shows a distribution of the fourteen SQGs in the mixed model.
Table 1. A pattern of SQGs (extract) Organisational dimensions Stages Paradigm / model of the world Managerial attitudes, skills,
roles & styles
Strategy
content Structure ...
Stimulus 1 1, 4-8 ...
Assess degree of change
required/issue’s impact 1 1, 2, 4-7 1, 5, 6, 14 ...
Assess time available, time
necessary and urgency 1 1, 5-7 ...
Choose management style(s) 1 1, 5, 8 5 ...
Define and clarify mission and
strategy 1 1-8
1, 3, 5, 6,
14 ...
Behavioural diagnosis 2, 5, 8 ...
Build a supportive climate 2, 4-8 5, 6 5, 6 ...
... ... ... ... ... ...
Note: The numbers in the cells correspond to the SQGs in Cândido & Morris (2000). The SQGs are: 1 - management perceptions; 2 - service quality strategy; 3 - service design and quality specifications; 4 - quality supportive financial function; 5 - internal communications; 6 - integration/coordination; 7 - coordination of other people and organisations; 8 - selection, training, and adequate levels of autonomy, power and rewards to personnel; 9 - service delivery; 10 - external communications; 11 - contact personnel’s perceptions of client’s expectations; 12 - contact personnel’s perceptions of client’s experiences; 13 - consumer perceptions; and 14 - service quality evaluation.
Table 1 shows the SQGs that are related to each organisational dimension, and can occur at each stage of the implementation process. Consequently, Table 1 also identifies the dimensions that can be reconfigured, at each stage, in order to eliminate the gaps. Although the fully extended version of this table is not shown, some of its important features can be emphasised: (1) some gaps are very frequent, occurring in many of the cells; (2) a SQG can occur in more than one cell of a column; (3) a SQG can also occur in more than one cell of a row; (4) non-empty cells contain an average of four different SQGs; (5) some SQGs occur together very frequently; and (6) there is no observable pattern for any of the gaps.
These features suggest a set of coherent conclusions. Features (1) and (2) suggest that SQGs might start at almost any stage of the implementation process. Feature (2) suggests that, during the strategy process, any existing gap may increase in intensity. More importantly, perhaps, feature (2) suggests that even if a gap has been dealt with and eliminated at one stage, it may recur at another stage. Feature (3) suggests that a SQG can have more than one cause, each individual cause being “located” in a different organisational dimension. Feature (3) suggests also that since one SQG may have more than one cause, manipulation of only one organisational dimension might be insufficient to eliminate the gap. Features (2) and (3) suggest that causes for gap persistence, intensity increase, or eventual recurrence, after being once eliminated, may be located in the same or in a different group of dimensions. Feature (4) indicates that the dysfunction of one organisational dimension might simultaneously cause more than one gap. It also means that manipulation of one dimension, although insufficient to completely eliminate a gap, can help to simultaneously eliminate more than one gap. Features (3), (4) and (5) suggest that SQGs are not independent and, together with feature (6) suggest that the
structure of causal relationships underlying the occurrence of SQGs might be extremely complicated, making it difficult to trace the causes of specific gaps.
Some implications for managers
SQGs occurring during the strategy process can affect it and may become embedded in the organisational processes, routines and culture. If this happens, subsequent organisational activity will be severely affected; the implementation process will probably be considered unsuccessful; and the organisation’s competitiveness will be diminished. Hence, being aware of the SQGs that might occur can help in preventing them and in limiting their broader consequences. More generally, winning the challenge of implementation requires that managers are aware of the character and importance of each organisational dimension; of each stage of the dynamic process; of the eventual unanticipated behaviour of organisational dimensions; and of SQGs’ pervasiveness, character and behaviour during the process. The models, proposed earlier, can contribute to raising understanding of these aspects. They can also be adapted to specific organisations and be used to anticipate what SQGs might occur at each stage; what organisational dimensions might be impacted; and what organisational dimensions might be managed, at each stage, to eliminate the gaps.
When a SQG does occur, and is recognised, it should not be underestimated by the manager for three reasons. First, the gap may not stand in isolation, but might coexist with others, making the problem much more complex than it seems. Second, manipulation of one organisational variable, alone, may be insufficient to eliminate any one gap; the elimination of which may require an integrated and coherent approach. And, third, even if an existing gap has been dealt with and eliminated, it may reappear, at some later stage, for the same or for different reasons, making constant surveillance mandatory.
Conclusion
In addition to the above implications for managers, this article takes existing strategy implementation models to synthesise (1) a comprehensive static model, composed of the fundamental organisational dimensions for strategy implementation; (2) a comprehensive dynamic model, sensitive to resistance to change, composed of the stages in a strategy formulation and implementation process; and (3) an integrated mixed model that considers the static and dynamic views, as well as SQGs.
The proposed models are not supported by empirical data in this article, but it can be suggested that they might be adapted to specific organisations and used as helpful management tools. They should help in analysing, thinking, planning and effecting change. More importantly, they should help in anticipating what organisational dimensions will be most affected at each stage of the process by SQGs and what variables can be used to prevent or eliminate these SQGs.
Acknowledgement
Carlos Cândido is supported by the Portuguese/EU Programme “Sub-Programa Ciência e Tecnologia do 2º Quadro Comunitário de Apoio”.
(Prentice Hall International).
BATESON, John E.G. (1995) Managing Services Marketing – Text and Readings
(Orlando, The Dryden Press).
CÂNDIDO, Carlos J.F. & MORRIS, D.S. (2000) Charting service quality gaps, Total
Quality Management, 11, pp. S463-S472.
CARNALL, Colin A. (1991) Managing strategic change: an integrated approach. In: Ken
IRONS (Ed.) Turning Strategy into Action (Oxford, Pergamon Press), pp. 35-45.
GALPIN, Timothy J. (1997) Making Strategy Work – Building Sustainable Growth
Capability (San Francisco, Jossey-Bass Publishers).
GORE, Chris, MURRAY, Kate & RICHARDSON, Bill (1992) Strategic Decision-Making (London, Cassell).
HUSSEY, David (1996) A framework for implementation. In: David HUSSEY (Ed.) The
Implementation Challenge (Chichester, John Wiley & Sons), pp. 1-14.
IRONS, Ken (1991) Turning strategy into action. In: Ken IRONS (Ed.) Turning Strategy
into Action (Oxford, Pergamon Press), pp. 1-5.
JOHNSON, Gerry & SCHOLES, Kevan (1999) Exploring Corporate Strategy: Text and
Cases (Prentice Hall).
LEAVITT, Harold J. (1964) Applied organisation change in industry: structural, technical,
and human approaches. In: W.W. COOPER, H.J. LEAVITT & M.W. SHELLY II (Eds.)
New Perspectives in Organisation Research (New York, John Wiley & Sons), pp.
55-71.
LEAVITT, Harold J., DILL,William R. & EYRING,Henry B. (1973) The Organisational
World – A Systematic View of Managers and Management (New York, Harcourt
Brace Jovanovich).
LEWIN, Kurt (1952) Frontiers in groups dynamics. In: Kurt LEWIN, Field Theory in
Social Science (London, Tavistock Publications), pp. 188-237.
MOCKLER, Robert J. (1995) Strategic management: the beginning of a new era. In: D.E.
HUSSEY (Ed.) Rethinking Strategic Management (John Wiley & Sons), pp. 1-41.
MORRIS, D.S. & HAIGH,R.H. (1996) Overcoming the barriers to TQM. In: Gopal K.
KANJI (Ed.) Total Quality Management in Action (London, Chapman & Hall), pp.
92-101.
PETERS, Thomas J. (1984) Strategy follows structure: developing distinctive skills,
California Management Review, XXVI, Spring, pp. 111-125.
PETERS, Thomas J., WATERMAN JR., Robert H., PHILLIPS,Julien R. (1980) Structure is
not organisation, Business Horizons, June, pp. 14-26.
SCHEIN, Edgar H. (1964) Management development as a process of influence. In: Harold
J. LEAVITT & Louis R. PONDY (Eds.) Readings in Managerial Psychology (Chicago,
The University of Chicago Press), pp. 331-351.
STONER, James A.F., FREEMAN, R. Edward & GILBERT JR., Daniel R. (1995)
Management (London, Prentice-Hall International Editions).
VOSS, C. & O’BRIEN, R.C. (1992) In Search of Quality (London, London Business School).