PROCESS OPTIMIZATION & QUALITY PERCEIVED
BY PASSENGERS - THE CASE STUDY OF
LISBON AIRPORT
Filipe Miguel Corales de Oliveira Sousa
Project submitted as partial requirement for the conferral of Master in Management
Supervisor: Prof. João Carlos Rosmaninho de Menezes, PhD., ISCTE Business School, Department of Marketing, Operations and Management Department
“If it doesn’t challenge you, it won’t change you”
ACKNOWLEDGEMENTS
This master's thesis would not have been possible without the help of Professor João Menezes over the last months. Thank you for your support and your willingness to cooperate with me to complete this great step. To the significant institution ISCTE Business School and all the teachers with whom I was able to develop my skills, thank you very much.
I want to thank also to ANA Aeroportos de Portugal for the opportunity and availability to help me to build this case study.
Thanks to all my family for all the support, dedication, and help at all stages of my life. To my mother for showing me that everything in life is possible, to my brother for showing me what companionship and friendship is, and my grandmother for all the years of dedication she has had with me. To them for giving me the best values and for motivating me always to want to achieve my goals.
Thanks to all my friends, namely, Artur, Dharmite, Diogo, Frazão, Solange, Bernardo, Duarte, Ernesto, Fábio, Marcelo, Mateus e Vasco. To Inês a special thanks for all the support, help, comprehension, and dedication.
To all the people that crossed my life and in some way I could help them, or they could help me, and with them, I could learn and become better than I was.
I
INDEX
ABSTRACT ... V RESUMO ... VI I. CASE STUDY ... 1 1.1. Problem Presentation ... 11.2. Lisbon Airport Case Study ... 2
1.2.1. Airport Market Overview ... 2
1.2.2. Airports Quality Service Key Performance Indicators ... 4
1.2.3. Airport Humberto Delgado – Lisbon ... 6
1.2.3.1. Lisbon Airport Stakeholders involved in the operation ... 6
1.2.3.2. Passenger flow at Lisbon Airport – Terminal 1 ... 7
1.2.3.3. Lisbon Airport Quality Service Improvement Plan ... 9
1.2.3.3.1. KPI’s ... 9
1.2.3.3.2. Operational Optimization of Lisbon Airport ... 10
1.3. Case Study Questions ... 14
1.4. Appendix ... 15
II. PEDAGOGICAL NOTE ... 34
2.1. Case study target ... 34
2.2. Pedagogical objectives ... 34
2.3. Literature Review ... 35
2.3.1. Operations Management in Services ... 36
2.3.1.1. Overview ... 36
2.3.1.2. Flow Management in Services ... 37
2.3.1.3. Queue Management – Composition, criteria and modules ... 39
2.3.1.4. Flexibility in Operations... 41
2.3.2. Quality Service ... 42
2.3.2.1. Overview ... 42
2.3.2.2. The Customer Engagement Benefits to Business ... 43
2.3.2.3. Client Satisfaction ... 44
2.3.3. Service Design ... 45
2.3.3.1. Overview – what is it? ... 45
2.3.3.2. Service Design methodology ... 46
2.3.3.3. Tools and Techniques for Service Design ... 48
II
2.5. Animation Plan ... 50
2.6. Animation Questions ... 52
2.7. Resolution Proposal ... 53
2.8. Resolution Slides ... 63
2.9. Key Learning Points/ Conclusions ... 76
III. BIBLIOGRAPHY ... 79
3.1. Articles... 79
III
List of Figures
Figure 1 – Passengers Flow in the Airport ... 7
Figure 2 – What passengers value the most in an airport ... 15
Figure 3- E-gates ... 15
Figure 4 – Open and closed e-gates ... 16
Figure 5 – Waiting time in security control ... 16
Figure 6 – Overall satisfaction with the airport ... 17
Figure 7 – Airport terminal cleaning ... 17
Figure 8 – Airport environment ... 17
Figure 9 – Courtesy and help from airport staff ... 18
Figure 10 – Availability of toilets ... 18
Figure 11 – Cleaning of sanity facilities ... 18
Figure 12 – Check-In queue time ... 19
Figure 13 – Courtesy and availability of check-In staff ... 19
Figure 14 – Staff efficiency at check-in ... 19
Figure 15 – Easy to identify terminal route ... 20
Figure 16 – Passport control waiting time ... 20
Figure 17 – Courtesy and availability of passport control officials ... 20
Figure 18 – Courtesy and availability of security staff ... 21
Figure 19 – Waiting time for safety inspection ... 21
Figure 20 – Previous Lisbon airport layout ... 22
Figure 21 – New Lisbon airport layout ... 23
Figure 22 – TAP Check-in screens ... 24
Figure 23 – Self check-in bag drop ... 24
IV
Figure 25 – Indication to sectors of check-in (2) ... 25
Figure 26 – Flight information screen ... 26
Figure 27 – Check-in sectors ... 27
Figure 28 – Guide for check-in and self-bag drop (1)... 28
Figure 29 – Guide for check-in and self-bag drop (2)... 28
Figure 30 – Guide for check-in and self-bag drop (3)... 29
Figure 31 – I-Sense technology ... 29
Figure 32 – I-Sense technology analysis ... 30
Figure 33 – Security ... 30
Figure 34 – X-Ray machine ... 31
Figure 35 – New X-Ray machine (AOCL) ... 31
Figure 36 – WC tablets ... 32
Figure 37 – My Way ... 32
Figure 38 – Airport staff uniform ... 33
Figure 39 – Example of an IPO (Input-Transformation Process-Outputs) ... 36
Figure 40 – Constrain theory ... 38
Figure 41 – Double diamond diagram ... 47
List of Tables
Table 1 - Animation Plan ... 51V
ABSTRACT
Increasing demand due to the banalization of air traffic as preferred means of transport, by the globalization of business and tourism, and by the speed of air transportation, has made airports the answer to this massive influx of people around the World.
The following case study aims to show professionals and students in Operations Management areas the need to look at customers as part of the operational process. Thus, to provide a higher quality service, it is necessary to look at the processes and coordination of the various links in the service chain, so that the system is as fluid and optimized as possible. Thus, the case study will show the Lisbon Airport case, an airport that have a substantial growth on the last five years. It will show what operational strategies that were implemented so that the customer service provision does not be harmed by maintaining quality levels and parameters.
To explain the situation of Lisbon Airport, was made a case study. The case study will have the focus on showing the relevant key performance indicators, the stakeholders involved in the process, the flow of passengers through the infrastructure and the changes done in the airport. For the literature review was done an analysis on operations management, quality of service and service design.
This case study aims to be studied by undergraduate or master students in the area of Operations Management. To consolidate knowledge was developed a set of questions applied to the case of Lisbon Airport.
VI
RESUMO
O aumento da procura devido à banalização do tráfego aéreo como sendo o meio de transporte preferido, tanto pela globalização de negócios e turismo, tanto pela velocidade de transporte, fizeram com que os aeroportos se tornassem a resposta para este fluxo enorme de pessoas por todo o Mundo.
O case study tem o objetivo de mostrar a necessidade de olhar para os clientes como parte integrante do processo. Desta forma, para prestar um serviço de maior qualidade, é necessário olhar para os processos e coordenação dos vários elos da cadeia de prestação de serviços, para que o sistema seja o mais fluído e otimizado possível. Assim, o case study falará do Aeroporto de Lisboa, um aeroporto que teve um aumento substancial de tráfego nos últimos cinco anos e das estratégias operacionais que forma implementadas por forma a que a prestação de serviço ao cliente.
Por forma a explicar a situação do Aeroporto de Lisboa, foi feita uma pesquisa sobre o mercado aeroportuário, quais os KPI’s relevantes de análise à infraestrutura e também um análise teórica sobre gestão de operações, qualidade de serviço e service design e a forma como a gestão do Aeroporto de Lisboa tornou a sua infraestrutura mais fluída no processamento de passageiros, reduzindo filas de espera e otimizando a qualidade de serviço.
Este case study tem o objetivo de ser estudado por alunos de Licenciatura ou Mestrado na área de Gestão de Operações e foram desenvolvidas um conjunto de perguntas aplicadas ao caso do Aeroporto de Lisboa.
1
I. CASE STUDY
1.1. Problem Presentation
Lisbon Airport was inaugurated on October, 15th 1942 to replace the Landing Field of Alverca that
was no longer sufficient to operate large airplanes due to the aeronautic evolution that already begun to transform the aircraft into a preferred transport for international travel.
Increasing demand due to the banalization of air travel as a preferred means of travel, both because of its inherent travel speed and the globalization of companies and businesses, has made airports increasingly crucial in responding to the flow of people around the globe (INAC, 2010). Therefore, over the last years, profound changes took place on the structure of civil aviation markets.
Portuguese airports, and Lisbon’s, mainly, were a fundamental part of how the Portuguese economy adapted to these processes. Due to the geographical location and to what the destination offers, Lisbon Airport became to be the gateway to the rising demand for tourism. During the last 15 years, Lisbon airport had remarkable growth. According to ANA (2019) data, passengers had grown from 10 million in 2004 to 29 million in 2018.
Lisbon Airport Director in an interview stated that in 2017 Lisbon Airport has surpassed all capacity factors, the so-called triggers, to trigger the mechanisms for the construction of the new airport in Lisbon. Lisbon Airport Director also stated that during the last years, (2016-2018) Lisbon Airport has to take advantage of optimizing the infrastructure, by doing more with less and becoming more efficient (Silva, 2018).
Due to the traffic growth and due to the limitations in increasing Lisbon’s Airport infrastructure, some procedures and some processes were implemented so the business can continue to grow and continuously answer to the demand of passengers. In response, what operational measures has Lisbon Airport taken to improve quality perceived by passengers and what improvements to its processes within its infrastructure have been implemented?
2
1.2. Lisbon Airport Case Study
1.2.1. Airport Market Overview
At the beginning of the twentieth century began the phenomenon of globalization, which translated into a strengthening of economic and socio-cultural policies, resulting from the reduction of costs in transportation and with the internet the communication between different countries becomes easier. Due to this and with the elimination of barriers to international movements, the flow of passengers around the World as increased and consequently at airports too. In an increasingly global world, companies tend to leverage their business across borders, and a good example is the success of companies at European level where they are increasingly expanding their business to countries within the European Community, and these customers who travel for professional reasons are a more demanding customers as they have to monetize their time in the best possible way.
With this increased demand from customers, all other airport stakeholders are required to increase their coordination and streamline processes to ensure maximum efficiency. Nowadays, efficiency is key to sustained growth, whatever the market, or the size of the company operating.
In the airport market, this topic is even more in line with the success of it as they have limited space, and the demand is growing at a breakneck pace.
On the other hand, airports need to comply with the new existent security laws that were created after the 9/11 attack in the US. Those rules are more and more tight to protect all the passengers and airport staff. All these security measures are very important to implement, but on the other side, they represent another obstacle to the airport efficiency workflow.
An Airport in the 21st Century is much more than a “simple” Airport, a word that we can find described in the dictionary as “ground surface with a runway, buildings, and equipment needed for air traffic, aircraft maintenance, boarding and disembarking of passengers, loading and unloading of goods and flight services”. An airport is a complex system of facilities that is thought out in detail for customer satisfaction while maximizing profit per square meter. This is a topic to add to the already difficult task of creating the most efficient flow possible from the customer's arrival until their departure or vice versa.
3 An airport business can be explained as being divided between the aviation and non-aviation businesses. The aviation business is related to the primary service that the customer is waiting to catch the plane. Non-aviation business is nowadays a more and more lucrative businesses since airport managers tend to change their strategy, so clients see the airport infrastructure as a shopping mall. The objective is that clients can spend more time on activities that provide value to the airport and to the client, for instance, shopping. In agreement with this, airport managers tend to find ways to reduce times where there are bottlenecks that harm the system like check-ins, security, and baggage drop. Other business-related to non-aviation business are all services provided to clients within the airport, such as parking, rent-a-car, restaurants, shops. Operationally, an airport is divided into two zones: landside and airside. Landside is all the space in the airport before the security checkpoint, meaning all areas that are open to the public like check-in, zone, parking and rent-a-car. Airside is all the space that is restricted to staff and passengers, like duty-free shops, boarding gates and the runway.
All in all, regardless of business, aviation or non-aviation, the ultimate goal of an airport is it is customer/passenger satisfaction. Without this well-defined goal airport activity would make no sense to exist.
4
1.2.2. Airports Quality Service Key Performance Indicators
To meet with what customers expect from a service from what customers perceived from it, it is necessary in between to understand what is essential for the customer (Kabir et al., 2010). According to Berry et al. (1994), there’s a gap from what service is expected from the client and what is delivered to him - this difference is called by quality service.
High-interest key performance indicators are created and studied by the industry, and usually an outside entity has the function to evaluate the market according to defined parameters. Like other business, airport business is also rated and have standards that they have to obey. Thereby, ACI - Airports Council International is an organization created in 1991 and represents airports all over the world. ACI works like a communication channel between the airports, government bodies and international organizations. They work within a compliance role creating the best market practices and policies to have a robust compliance environment in all airports. ACI, as stated, develop a quality standard that airports should follow and rate them yearly. According to that, ACI has created the ASQ (Airport Service Quality) program, which provides information about what passengers feel about airports and the service provided by them.
ACI, makes studies on indicators such as accessibility, check-in times, passport/ID control, security, arrival services, finding way, airport overall facilities and airport environment. Accessibility is the availability of public transport to the airport, the availability of parking at or near the airport, the respective parking price and the availability of luggage trolleys inside the airport. Check-ins are evaluated by the length of waiting at check-in daughters, the efficiency of staff in providing this service and their courtesy / friendliness. Passport or ID control is assessed by the waiting time for document control and the courtesy and availability of staff. Safety is evaluated by rigorous inspection, waiting time for inspection, passengers' sense of security at the airport, and the courtesy and availability of staff when interacting with passengers. Arrival services are evaluated by passport control upon arrival, speed of baggage delivery and customs control. Finding way is the ease of identifying the route within the terminal, the availability of flight information, the distance traveled within the terminal, and the ease of connecting with other flights. Airport overall facilities is the overall rating of the airport staff, the availability of restaurants and shops and their value for money, the availability of cash machines and currency exchange agencies, the availability of Wi-Fi, the availability of executive or business lounges, the cleanness of sanitation facilities and the comfort of departure
5 and check-in rooms. Lastly, the airport environment is evaluated by the cleanness of the airport’s terminal and the overall airport environment.
Airport business tends to look at the information provided by ACI on other benchmark airports and internally develop operational strategies to improve their processes to be more effective and efficient in passenger service. Thus, the interconnection between all processes, the measurement and control of process times and the alignment of human resources is becoming increasingly essential to get passengers more satisfied with their service (Appendix 1 shows what passengers value most in an Airport service).
6
1.2.3. Airport Humberto Delgado – Lisbon
ANA - Aeroportos de Portugal, SA holds the concession for the management of 10 airports based in Portugal. Ana was born in 1978 after the civil aviation reorganization in Portugal, and at that time they were not only responsible for the airports, but also responsible for the air navigation.
In 1999, ANA - Aeroportos e Navegação Aérea was split into two companies: ANA - Aeroportos de Portugal, SA, a publicly-held corporation with responsibility for managing and developing the airport infrastructures and NAV - Navegacao Aérea de Portugal, EP, a public company that received all attributions related to air navigation, previously in the sphere of ANA.
In 2013, the Portuguese Government grants to ANA, for a period of 50 years, the concession relating to the management and development of airports in Portugal, placing under its responsibility 10 infrastructures, which includes the largest airport platforms in the country, Lisbon Airport. A few months later, VINCI Airports acquires ANA, taking over the Company. By moving to VINCI, ANA is now part of a business group of over 200,000 employees in over 100 countries around the world. With the acquisition of its 46th airport (London-Gatwick) in early 2019, became the world's second largest airport operator, with a volume of 241 million passengers processed in 2018.
Lisbon, as the main gateway from Portugal, as seen the airport increasing its traffic from 10 million in 2004 up to 29 million in 2018. During the period of Vinci management, the airport as seen their traffic growing in almost 13,5milion passengers (5 years period). It is important to highlight that nearly half of the Lisbon Passengers (14milions in 2018) travel by the national carrier, TAP Air Portugal.
The additional generation of traffic created challenges in the flow of passengers within the terminal, as it is important for the business to maintain the level of service provided. It is then necessary to realize that measures were implemented to continue the rapidly expanding business within an infrastructure that has limited space.
1.2.3.1. Lisbon Airport Stakeholders involved in the operation
To understand the flow of processes in Lisbon's Airports, it is necessary to understand all entities that are related to the business and the way they are related to each other. The stakeholders involved in the operations are Portuguese government, Vinci, ANA, Portuguese
7 population, staff, airlines, handlers, security, public transportation, SEF (Serviço de Estrangeiros e Fronteiras - Immigration and Borders Service), parking, restaurants, stores, cleaning, firefighters, passengers, ANAC (Autoridade Nacional de Aviação Civil – the Portuguese regulator for aviation), NAV (Navegação Aérea de Portugal – provide services for flight traffic). For the purpose of the study, there will be only mentioned those who are important for the day to day operation - staff, airlines, handlers, security, public transportation, SEF, parking, restaurants, stores, cleaning and passengers. Thereby, all these entities have an important role in providing a better experience for the passengers inside the terminal when arriving or living it.
1.2.3.2. Passenger flow at Lisbon Airport – Terminal 1
Due to the rapid growth of Lisbon Airport in passenger numbers from 15.5 million in 2013 up to 29 million in 2018 and with the same available infrastructure space, some processes within the infrastructure had to be changed. To provide, on one hand, the same service to more passengers (need for increased efficiency) and, on the other hand, continue to compete with other International Airports in the KPIs that the industry (ACI) indicates.
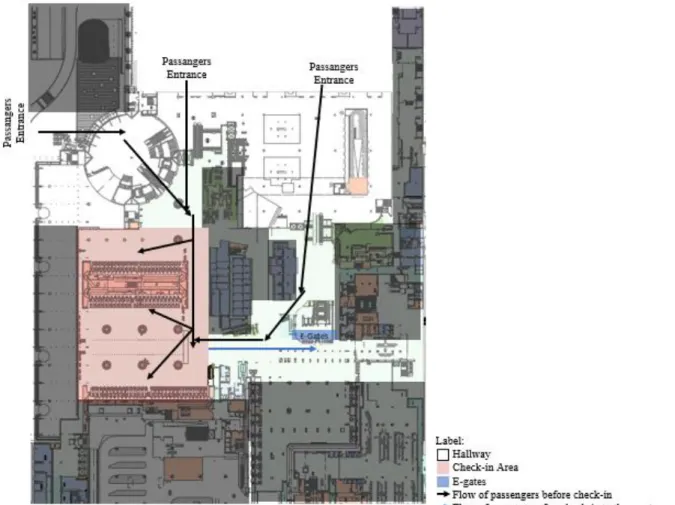
All interactions between passengers and Lisbon Airport will be analyzed. This analysis aims to understand all the points that, with the increase of passengers in the Lisbon airport infrastructure, have been the enhancers of normal flow. Within the Airport there are two main streams: the departure flow and the passenger arrival flow. Figure 1 shows both streams.
Source: researchgate.net
8
The departure flow:
• The customer starts by arriving at Lisbon Airport by public transport or by his means, parking his car in one of the Lisbon Airport parks;
• Next, (considering only customers who do not check-in earlier) passengers move to the check-in lobby. Here, there are several possibilities:
1. For passengers checking-in on Sector A (sector A is TAP's flight check-in zone), they can check-in via the mobile devices in the terminal and deliver their bag to the mat, fully autonomous with the help of airport staff.
2. For all other passengers in the B, C, D, E and F check-in sectors, check-in can be done on a mobile device or at the counter. Their baggage will be delivered on the check-in counter.
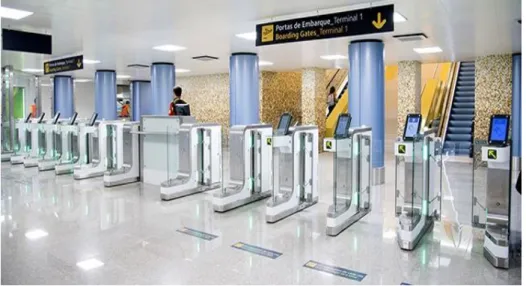
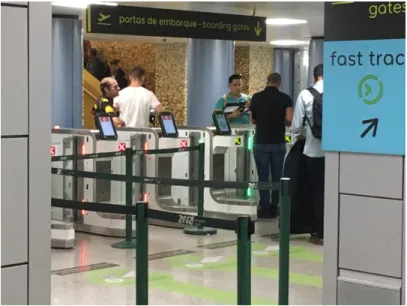
• Then, with the check-in done and the hold bags delivered, customers move to the security check, at which point there are two interactions - first to open the e-gate (Appendix 2) and a second at the security check, where all customers will be inspected; • For passengers flying outside the Schengen area, there is a need to do passport control by moving on the airside to the area restricted to such flights. For passengers that travel to a country within the Schengen area, this step does not exist;
• Finally, the passenger will wait at the boarding gate for the flight before boarding and finally leaving Lisbon Airport.
The arrival flow:
• The customer arrives at Lisbon Airport through the flight and enters the infrastructure through the boarding gate;
• Next, if the passenger comes from a flight originating from a country outside the Schengen area, the passenger will need to do passport control. If the passenger originates from a country within the Schengen area, this step does not exist;
• The passenger then moves to the baggage reclaim room, and if their luggage has gone to the hold of the plane, they can collect it.
• Lastly, the passenger will move out of the baggage claim room into the Arrivals lobby and, then, they leave the airport via their car if the car is parked in the airport’s park or leaves through public transport.
After analyzing the departure and arrival process of the passenger, it should be noted that all passengers are subjected to this process. With the increase in air traffic, increases the stress on
9 each of these interactions between the passenger and the Airport. There is, therefore, a great need to process more customers in the same time, making the whole system more efficient. For this to be possible, it is necessary to create procedures for controlling and monitoring passenger time at the terminal and more specifically, their processing time at all the points described above. In addition, it is necessary big coordination of the airport's staff. With their help, the process became more fluid as possible, increasing efficiency and improving overall customer service.
1.2.3.3. Lisbon Airport Quality Service Improvement Plan
1.2.3.3.1. KPI’s
To improve the quality of service of Lisbon Airport passengers, both in terms of process improvement and infrastructure quality improvement, it was created a customer service quality improvement project. The project was aimed to improve the overall infrastructure of the airport, through rethinking the entire service, including core activities such as passenger flow and processing at check-ins, boarding pass control and x-ray baggage control and including secondary activities such as improving WC's and improving assistance to people with reduced mobility.
The main KPIs of analysis for the Lisbon Airport case study are the following ones. The values shown in the appendices are values for the first half of 2019.
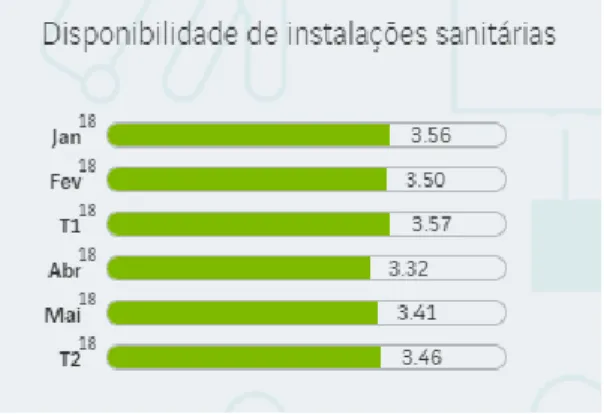
1. Waiting time in security control (Appendix 3); 2. Overall satisfaction with the Airport (Appendix 4); 3. Airport terminal cleaning (Appendix 5);
4. Airport environment (Appendix 6);
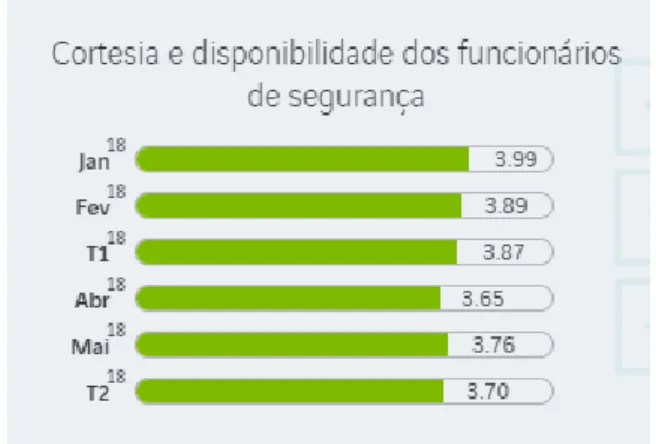
5. Courtesy and help from Airport staff (Appendix 7); 6. Availability of toilets (Appendix 8);
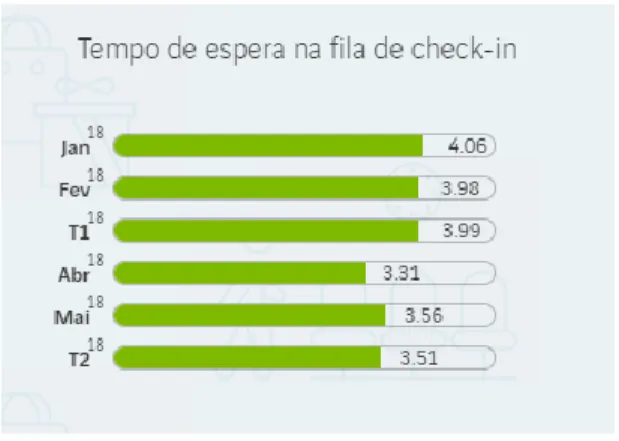
7. Cleaning of sanitary facilities (Appendix 9); 8. Check-In queue time (Appendix 10);
9. Courtesy and availability of check-In staff (Appendix 11); 10. Staff efficiency at check-in (Appendix 12);
10
12. Passport control waiting time (Appendix 14);
13. Courtesy and availability of passport control officials (Appendix 15); 14. Courtesy and availability of security staff (Appendix 16);
15. Waiting time for safety inspection (Appendix 17).
These KPIs shown are all related to the quality of service provided, however, some have an aspect that involves the improvement and / or redesign of the process. Others are more related to the alignment of employees with the strategy. Others are more related to the quality of infrastructure support services. Importantly, all improvements are made to ensure that the customer experience for the service provided is of the highest quality possible.
1.2.3.3.2. Operational Optimization of Lisbon Airport
As stated, to improve the quality of service provided at Lisbon Airport and given the significant increase in traffic within the airport infrastructure, some improvements have been developed. These improvements have an impact not only on the operational management of the airport but also on the management of infrastructure-related human resources and on improving signalization and communication changes to passengers.
The changes made at Lisbon Airport were: change of layout in check-ins zones and creation of self check-in bag drop (Sector A case), changing on the reading of boarding pass control and waiting times, change of x-ray machines, toilet service improvement and My Way service improvement.
• Change of layout in check-ins zones and creation of self check-in bag drop (Appendix
18, 19, 20, 21, 22, 23, 24, 25, 26, 27 and 28)
1. With the increase in air traffic over the last 5 years, the number of check-in counters has begun to be insufficient to process all passengers for all flights. (See check-in area plan before the change – Appendix 18);
2. It was found that, since TAP is the airline that dominates almost 50% of air traffic generation at Lisbon Airport and with the existence of available spaces at the airport, it would make sense for this airline to have a separate area from rest of airlines;
11 3. Work has been done and the Check-In Sector A (see Appendix 19) has been set up, separate from the rest of the old check-in zone, where TAP could have its check-in zone;
4. Not being possible to process all passengers yet, another check-in zone close to the e-gates was created (see Appendix 19);
5. In order to guide passengers through the infrastructure at the airport entrances (see
Appendix 19), an indication of the check-in sectors has been placed next to the
flight information screens (see Appendix 22 and 23 - direction to check-in sectors) (check-in information was also made available on flight information screens - see
Appendix 24) - With the decision to create check-in areas, half of the passengers
are distributed to one part of the airport and the other half to another, thereby improving passenger flow within the terminal, making it more efficient;
6. In order to optimize the old check-in zone, it was created B, C, D, E and F zones (E and F are new zones). It was decided to assign letters to better guide passengers inside the terminal, guiding them more easily to the correct check-in counter. In all check-in sectors, a sector information board was provided (see Appendix 25); 7. Upon check-in the passenger moves to the e-gates where they will have boarding
pass control. By deciding on separate check-in areas, TAP from the other airlines, passengers also take a different route to access the airside (See Passenger Flow in
Appendix 19) splitting once more the number of passengers through the hallway;
8. In sector A, as an airline-only sector, it was invested in self check-in bag drop (Appendix 20 and 21), a system that separates the check-in and the hold baggage storage process into two steps and inducing the client to be autonomous. As it is a rotating carpet system and shared by all baggage depots, the passenger can move to any of the counters and place their luggage there, and after that a sensor inside the luggage compartment will read the luggage tag and separate it to the correct plane. With this innovation there has been an increase in efficiency in the check-in process, as the check-in system and luggage racking system are flexible and adaptable, thus reducing queues. In order to combat possible losses in quality of service, because passengers are unable to proceed with this new technology, Lisbon Airport and TAP have provided human resources to support passengers. An animated video explaining the process to passengers was l so created (See Appendix 26, 27 and
12
• Reading of boarding pass control and waiting times (Appendix 2, 29 and 30)
1. It was found that there was no way to monitor passenger processing queue time at boarding pass control at peak times;
2. It was defined that times would first be measured on-site using a card system that would be delivered to the customer at the start of the queue and returned after that; 3. It was found that, in order to have reliable and real-time data, it would be necessary to find a solution also automatic, the chosen solution was i-sense technology (Appendix 29) (depth reading sensor, ie the system analyzes the distance to which an object is from the camera and counts the passage time from point x to point y - queued time in this context);
4. The installation of the i-sense system made it possible to monitor queued times (Appendix 30) in real-time and also by entering future traffic estimates to calculate e-gates needs;
5. Thus, depending on the demand, more or fewer e-gates are available, making the process more adaptable to airport demand needs, making the system more flexible and reducing waiting times as shown in Appendix 2;
6. Displays have been installed to indicate the average waiting time for passengers in the queue.
• X-Ray (Appendix 31, 32 and 33)
1. It was found that with the implementation of the new boarding pass control e-gate system (showed earlier), the activity followed by this, passenger x-ray control, became a generator of queuing constraints;
2. Just like e-gates, a queue time monitoring sensor has been installed and tells passengers how long they have to wait (Appendix 31);
3. The new X-ray solution, AOCL - Automatic Operator Centralized Lines was implemented. The new solution eliminates the need to remove the computer or tablet from the trunk, allows three passengers to carry their luggage at the same time and allows the trays to be automatically reinserted into the system. This new system has increased the efficiency of passenger processing, handling almost twice as many passengers and luggage as the original x-ray solution. Appendix 32 and 33 show the old and new solutions (respectively), where it is possible to see that 3 bags are placed at the same time for x-ray control.
13 • Wc’s (Appendix 34)
1. It was found that the KPIs related to the perceived quality of customers by the WCs were low and that there was no way to monitor the quality of the WC's. This resulted in high response times to situations that cause low satisfaction ratings;
2. In order to improve passengers' perceived quality of toilets, tablets have been implemented. There, customers can give feedback about the toilet by saying the availability of toilet paper and hand soap, the existence of clogging, among others and the evaluation of the overall toilet “service”;
3. These tablets provide real-time information to airport management, which can react more quickly and efficiently to the problem situation.
• My Way (Support service for people with reduced mobility) (Appendix 35)
1. By following the European Regulation for persons with reduced mobility, Lisbon Airport provided My Way service to passengers with disabilities or reduced mobility. My way service provides full support, facilitation and accompany until the boarding gate. There was an increase from one resting area for five of these. It is very important to note that the management of Lisbon Airport has increased its staff (Appendix 36) and attribute to them blue colors so it is easy to see and know where they are. As seen, several improvements have been made to the Lisbon Airport infrastructure, some of which improve the flow of passengers, both in terms of layout changes such as the change in TAP check-in bag drop. Others improve queuing constraints such as changing e-gates and changing x-ray machines. Others tend to “only” improve the quality of infrastructure available to passengers, such as improving toilet monitoring and increasing the number of rest areas for people with reduced mobility (My Way). All these activities have a direct impact on improving the quality of customer service and will have an impact on the KPIs presented above that are monitored by ACI.
Thus, due to the increase in traffic, Lisbon Airport has been taking measures aimed at improving operational infrastructure and quality perceived by customers. Lisbon Airport has become more flexible to peak demand, created improvements in passenger flow and improved the monitoring of KPIs performance that made possible to answer to problem situations in a faster and more agile way.
14
1.3. Case Study Questions
1st Question: Explain the importance of seeking to have a passenger processing system at
Lisbon Airport as fluid as possible and how to manage a constrain in the flow and explain with an example.
2nd Question: What is the importance of queue management and queueing times at Lisbon
Airport?
3rd Question: How important is flexibility in operations management and how Lisbon Airport
has implemented it?
4th Question: What is the importance of monitoring Lisbon Airport KPIs related to customer
satisfaction and what measures were implemented aiming only the increase of quality satisfaction?
5th Question: Justify the choice of Lisbon Airport management in the relocation of TAP airline
check-in to sector A and the creation of the others check-in areas B, C, D, E and F (See
Appendix 18 and 19)?
6th Question: On the perspective of service design, explain what Lisbon Airport has improved
15 1.4. Appendix Appendix 1 Source: ACI Appendix 2 Source: ANA
Figure 2 – What passengers value the most in an airport
16
Source: Author
Appendix 3
Source: ANA
Figure 4 – Open and closed e-gates
17 Appendix 4 Source: ANA Appendix 5 Source: ANA Appendix 6 Source: ANA
Figure 6 – Overall satisfaction with the airport
Figure 7 – Airport terminal cleaning
18 Appendix 7 Source: ANA Appendix 8 Source: ANA Appendix 9 Source: ANA
Figure 9 – Courtesy and help from airport staff
Figure 10 – Availability of toilets
19 Appendix 10 Source: ANA Appendix 11 Source: ANA Appendix 12 Source: ANA
Figure 12 – Check-In queue time
Figure 13 – Courtesy and availability of check-In staff
20 Appendix 13 Source: ANA Appendix 14 Source: ANA Appendix 15 Source: ANA
Figure 15 – Easy to identify terminal route
Figure 16 – Passport control waiting time
21
Appendix 16
Source: ANA
Appendix 17
Source: ANA
Figure 18 – Courtesy and availability of security staff
22
Appendix 18
Source: ANA
23
Appendix 19
Source: ANA
24
Appendix 20
Source: Author
Appendix 21
Source: Author
Figure 22 – TAP Check-in screens
25
Appendix 22
Source: Author
Appendix 23
Source: Author
Figure 24 – Indication to sectors of check-in (1)
26
Appendix 24
Source: Author
27
Appendix 25
Source: Author
28
Appendix 26
Source: ANA
Appendix 27
Source: ANA
Figure 28 – Guide for check-in and self-bag drop (1)
29
Appendix 28
Source: ANA
Appendix 29
Source: ANA
Figure 30 – Guide for check-in and self-bag drop (3)
30
Appendix 30
Source: ANA
Appendix 31
Source: ANA
Figure 32 – I-Sense technology analysis
31
Appendix 32
Source: ANA
Appendix 33
Source: ANA
Figure 34 – X-Ray machine
32 Appendix 34 Source: ANA Appendix 35 Source: ANA Figure 36 – WC tablets Figure 37 – My Way
33
Appendix 36
Source: ANA
34
II. PEDAGOGICAL NOTE
2.1. Case study target This case study is intended for:
• Undergraduate or master students attending courses related to Operations Management who aim to acquire further information on issues such as operations and quality in a service type of business;
• Operation Managers professionals working in a business where there is a need to reevaluate the customer service process due to the increase of demand and the way it is related to the quality perceived by clients, who may use this case study to learn some key issues raised and benchmark them in their organizations;
2.2. Pedagogical objectives
This case study was developed with the following pedagogical goals:
1. Highlight the importance of continuously looking forward to improving processes and understand what tasks of the systems are creating bottlenecks;
2. Understand the importance of the coordination of processes within a service type of company (an Airport in the case) to guarantee that the flow of clients is more stable; 3. Understand the importance of monitoring the client’s satisfaction and always looking
for ways to maintain the clients satisfied with the service provided;
4. Recognize the importance of flexibility in services and the way it can be managed; 5. Perceive the importance of measuring times in operations management;
6. Understand the need to improve the operational procedures of the company continuously;
7. Understand the importance of understanding the difference between the quality service that the company thinks they provide from the quality that is perceived from the client and the ways that the company should mitigate that difference;
35 2.3. Literature Review
The realization of a case study requires that the project applied in the company to be related to an academic study topic that support the decisions that are made in the project. The purpose is not only to understand the decision made from an academic point of view, but also to provide the reader with theoretical content to better understand the case. The case study shows the reader what the important KPIs to analyze within an airport infrastructure business are. It also shows the various decisions that have been taken place at Lisbon’s Airport in order to improve the performance in matter of quality of service related to process improvements. In addition, the literature review will address the following topics:
• Operations Management in Services • Quality Service
36
2.3.1. Operations Management in Services
2.3.1.1. Overview
“… According to Carvalho et al. (2012 : 330), operations management is constituted by the execution, implementation, operation, control and improvement of systems that allows an organization to produce its products (goods or services) and make them available to customers…” at the right time, place and tracks always optimizing the cost.
Carvalho et al. (2012) also stated that service operations management is the combination of activities that added value to the customer and that involve interactions between customers and the service provider company. Thus, the company's responsible for providing the service by how they allocate available resources and their associated processes, provide to the customer the service they want.
From a service provider's perspective, operations management is the combination of inputs provided by the customer and the company itself that, through a transformation process, develop a customer output (service) as shown in Figure 39.
Source: opentextbooks
Additionally, operations management does not end with the service delivery (output), as the whole process is interactive between the various parties. It is important to understand customer feedback on the service provided to improve internal procedures or even adjust the type of service.
37 Customer engagement in the process is critical to management, as different customers have different value perspectives associated with the same service that comes from their expectations, experience, or the marketing of the service provider company.
The final output of the service will then have a subjective dimension as it is inherent in the perception of each individual. Their perception of the service provided and the service offered will then give rise to the quality of service indicators (Berry et al., 1994).
2.3.1.2. Flow Management in Services
Flow management is a set of activities / tasks that are coordinated with each other to obtain a number of outputs with a given number of inputs through a transformation process (Davenport, 1993). The interconnection of these processes and the obtainment of the various outputs is given by the customer's movement within the space, following from a waiting period and the provision of the service, once again moving, waiting and being provided another service and thus successively until the end of the service.
For efficient and effective flow management, it is necessary that activities are balanced with each other in order to mitigate service constraints and that the system is flexible at the temporal level, ie depending on the temporal variable there may be higher or lower demand and the system should adapt to this variable.
According to Goldratt (1990) a bottleneck is the point of the system that does not necessarily have less installed capacity, but is the link in the chain that produces less output, and thus, causes constraints to the process flow. The flow of services associated with the system depends, then, on the associated processing capacity of each activity and how they are related. Goldratt (1990) also states that what is most important in service flow management is the fluidity and balance of the system and not that all points in the system have the same capacity, because different activities have different execution times, hence different inputs, processes transformation and outputs.
In order to mitigate system bottlenecks and improve system fluidity, Goldratt (1990) developed 5 steps to solve the problem situation as shown in figure 40.
38
Source: leanproduction
Thus,
• step 1 is the identification of the system constraint, ie what activity is constraining the entire system;
• step 2 consists of exploring the constraint, ie understanding what is limiting the problem-generating activity in the system. This could be a matter of task reorganization, task runtime improvement, among others;
• step 3 consists of synchronizing and subordinating the system to the constraint, ie calculating the impact of improving this activity on the system and checking its fluidity; • step 4 consists in raising the performance of the constraint, ie all initiatives that will be
developed with the aim of improving the process;
• Finally, step 5 will be a repetition of the entire process that will consist on assessing the impact that the resolution of the constrain will have on the entire flow and, thus, repeat all steps to address new constraints that may have appeared.
Identifying and resolving bottlenecks in step 4 by increasing capacity with a larger number of employees / machines or via increasing task efficiency, will enable the increase of the fluidity in the entire customer service process.
39
2.3.1.3. Queue Management – Composition, criteria and modules
One of the focal points for constraint management is the study of queue management. Naturally, the installed capacity must be higher than demand in order to provide the service to all customers. However, some businesses are conducive to seasonality, either hourly or monthly, which may lead to peak demand and therefore waiting lines. It is necessary that operations management balance the installed capacity with demand for its services to be optimized in financial costs, human resources allocation and infrastructure availability.
Hall (1991) stated that to analyze a queue system is necessary to understand the way the customers arrive at the queue, the behavior of the queue and the service facility. In order to measure queuing time, there are two approaches used: one where queuing time is identified and measured and one that is calculated analytically. The two types of queue management model, the elements that make part of it and the ways to measure its performance are shown below. Within a service delivery system that can consist of multiple customer crossing points, analyzing the queue composition at a given point in the process becomes critical. Thus, according to Fitzsimmons et al. (2008) it is necessary to analyze 5 aspects:
• The finitude of the population, as the decision formulation will be different taking into account the volume of customers;
• The way the client arrives at the system, ie analyzing the periodicity of system arrivals, ie whether it is constant over time or operates by peak demand;
• The physical characteristics of the queue structure, ie whether there are space-related sizing restrictions and if there are customers with reduced mobility;
• The average number of clients that are processed by the system by time interval; • The way clients exit the system, ie whether the customer after service leaves the system
or continues to the next step - to understand and balance, as stated above, the flow of the entire system.
The formation of a queue is given by the waiting that a customer is submitted in order to get the service they want. Therefore, queuing performance needs to be evaluated to improve customer service. Thus, and according to Carvalho et al. (2012), to assess the performance of service delivery from this perspective, it is necessary to understand the occupation of allocated human resources, the average time a customer waits in line (because it has a direct impact on
40
the quality that the customer will perceive) and on the full system, the average number of clients waiting in the queue and in the system, the probability of the system having no clients (minimum threshold), and the probability that all systems are busy and clients are waiting (maximum limit).
As stated above, the availability of system capacity should be the balance between using employees with a load factor close to 100% and promoting a sense of a high quality service. There are several factors that make the various components within the system different, namely the task execution, for instance the execution time of a task will have a direct impact on the decision, for example, doubling the number of human resources for a given task so that the system absorbs twice as many customers. There must be a balance between the cost of providing a parallel service to the first (with the same function) and the time that the customer is willing to wait for the service to be provided.
According to Alias (2007), there are three types of queues: single queues where there is one service provider for one customer at a time, multiple queues where there is a single queue for multiple clients, and lastly, diffuse queue, which works by numeric ticket system. It should be noted that each type of queue has implications, and often, the decision to choose has to do with the type of service that will be provided. For more exclusive services, for example a bank, the single model may be most appropriate because customers want the service to be provided by a specific employee. On the other hand, for a more regular type of service, the multi-queue or diffuse queue system will be the most appropriate for the efficient processing of the clients, and if a service is taking longer, the next client will be referred to provider and thus there will be a greater balance of flow in the service.
41
2.3.1.4. Flexibility in Operations
According to Mandelbaum (1978) flexibility is the ability to respond efficiently to different circumstances. Buzacott (1982) adds that the term flexibility relates to the agility of the system to process tasks. Thus, a service delivery system may have allocated tasks that are also flexible to meet customer needs.
According to Carvalho et al. (2012), as a service, demand tends to have more fluctuation than a goods production system. The availability of the service will have a direct impact on the quality of the service provided.
It turns out that although companies have scaled their services to meet their demand, there are time periods when the influx of customers entering the system has a peak that can cause constrains, as stated in the previous chapters. The way to respond to peak demand is to make the system more flexible, that is, to increase the responsiveness of tasks within the system on time. An example will be the addition of a service provider to increase customer processing flow.
In contrast to the sale and production of products, where storage may exist and production is not performed at the time of purchase, the provision of services has some peculiarities, and the service begins with the interaction of the customer with the system and the lack of efficiency will have a direct impact on the quality perceived by the customer.
42
2.3.2. Quality Service
2.3.2.1. Overview
This section has the purpose of demonstrating the importance of having the customer’s perspective as one of the strategy points. so the company do not lose their vision, and so the client is one of the most important figures in the business process. This topic is very important for modern management as it is a shortcut to companies to deliver the best services to their clients.
According to Zeithalmal et al. (1990), the most important asset of a company is its customers, their employees and the good relationship between them. It is important to realize that a business depends on its customers and not the other way around. A customer is someone who brings to the company their needs and the company aims to respond to their wishes. This relationship must be fulfilled to maximize the expectations of both parties.
American Marketing Association (1960) stated that the provision of a service is linked to the need to satisfy a customer need and the service itself is a compilation of various interactions between the customer and the company.
The two topics above mentioned are very important to start to understand how companies can help their customers and deliver the best service, but it is one important step missing. Companies need to be in their client’s “shoes” so they can really understand their clients’ perceptions and needs of the market and to satisfy them through the communication and pricing, that culminates in the most effective service. So, in a more direct way, companies’ service should be customer-oriented.
Trying to understand clients’ needs and overcome it can be one step ahead of all the other competitors in the market. This culture helps companies to be closer to their clients and create focus on how to create new services, accordingly to the market needs.
43
2.3.2.2. The Customer Engagement Benefits to Business
In today’s market, it is really difficult to retain clients focus in the services, as the competition is becoming more and more ferocious and clients can experience different and new communication channels more precisely on the internet where they obtain all the information they need. So, more than a happy client, it is really important to have a “customer engagement” mindset so companies can improve their relationship with all their stakeholders in order to become more notable in the market.
According to Griffin et al. (1993) three good examples of the benefits of customer engagement are:
• Time to market - The close relationship with the customers results in more up to date information and strengthens the company’s intelligence about their client’s preferences and needs that are always changing at a fast pace.
• Long-term relationships - These relationships are really important to business as they have some indirect benefits like customers feel more embraced with the product because of their input and because they know that their opinion matters on the service that is provided to them. Another indirect benefit is that a long-term client tends to promote the product to other users, their friends or family. Conducting individual interviews with customers can improve their relationship with the company. On the client side, because they feel within the strategy formulation and on the company side because they can better understand the needs of their customers.
• Improved Complain Management - One of the most important aspects of the client management is the way that the companies treat theirs complains. When a company has loyal customers, they tend to communicate their complaints directly. Thus, it is easier to manage the brand reputation and prevent reputational damage.
44
2.3.2.3. Client Satisfaction
Customer satisfaction is defined by Kotler et al. (2013) as the feeling of contentment or discontent that results from what is offered to him by the company versus the perceived quality by him according to its expectations. Customer satisfaction is a key aspect in all organizations, besides it measures the customer’s loyalty to a brand. It’s also a performance indicator that helps organizations to improve their service differentiation to other companies and to thrive in nowadays always changing markets.
Expectations are an important word when talking about client satisfaction as client satisfaction or dissatisfaction, can be a result of his expectation of the service provided. When a client feels the need to obtain a certain service most of the time he already has an idea or feedback on it. He already have some expectation created about the service provided and after buying it, he will confirm or disconfirm his initial idea.
A key factor to have success in a service provided it is to work in the gap between the expected service and the perceived service. Customer expectation is a result of the customer's feelings with a service. Perception is a consequence of the satisfaction or dissatisfaction of the client related to the service that was provided. Understand this gap is very important for entities to manage their client's expectations. With this, companies can deliver a service that is align with clients expectations, can promote a better service, can maximize the investment, can reach easier to companies goals, can avoid unnecessary costs and can prevent any reputational damage that could be harmful to a well implemented company.
45
2.3.3. Service Design
2.3.3.1. Overview – what is it?
Service design, according to Moritz (2005) is primarily the understanding and meeting of the needs of customers, the organization and the market. The second phase is to understand the customer's entire experience of the service and understand the difference between the service perceived and the service that is provided. Then, the alignment of processes and the implementing of new ideas that meet customers needs, can transform the service into a higher quality service.
Mager (2008) adds that service design is the application of design methodologies with design thinking to increase the perceived value of a service to a customer. Both work in parallel and the design methodology is the alignment of the concept of design with the functionality of things to be more pleasing to customers. Design thinking studies customer needs and places them at the center of priorities to understand them and create a service that they like. Thus, service design is the combination of planning activities, human resources alignment, infrastructure management and communication of a service.
For today's fast-changing and agile world, companies to improve their competitiveness must define customer-focused strategies that meet their needs. One of the strategies that companies have developed is to design their service. Even though company focus continues to be to provide the best service possible, there is a growing need for conceptualization the services and that customers feel comfortable with their decision to choose the services of a certain company. To customers, the evaluation of service is viewed globally and not by the various components of the service (Goldstein et al., 2002), which puts greater pressure on the company not to fail. Service design assumes that all links of the processes are coordinated and planned to improve customer experience by making it more fluid. According to Dervojeda et al. (2014), with the design of the service, the difference between the service that the company believes they provide, and the quality of service perceived by the customer becomes smaller. This is due to the alignment and simplification of processes and the great involvement and focus of employees (creation of a sense of ownership) in the strategy implemented. Moritz (2005) adds that the improvement of the overall service delivery process is due to the process alignment of the various system components and that the perceived quality of the customer is a global perception of the entire macro process.
46
Fritsche (2010) demonstrates that service design consists of 3 areas: service quality, business growth and innovation. Quality of service refers to improving organizational processes, improving customer relationships, increasing efficiency, creating better experiences, and ensuring that service quality is stable (reduction of process failure). Business growth due to increased profit (process improvement leads to cost optimization), exploration of new markets, increased competitiveness and increased number of employees. Lastly, the innovation because of the innovation that comes from creating value for customers, the inspiration that conceptualizing a service design induces.
2.3.3.2. Service Design methodology
Service design works with experts from different fields to ensure that the end result involves all important service variables. When designing a service it is important to do not forget that the internal client is as important as the external one. (Sabroe et al., 2014).
According to Sabroe et al. (2014), the first step for service analysis is to understand all points of interaction between the company and the client. Designers, in conjunction with operations managers, will highlight the key needs of each service step. This analysis will provide to the manager a first overview of where the service begins and ends, which tasks the company should perform better and which tasks can be outsourced to third parties and where the company is putting too much or too little effort. As said, the focus of service design is the alignment of all processes, including the alignment of human resources with the strategy to be implemented. Therefore, the analysis done will not only be about the tasks customer sees (front-office) but will also be the combination of all the back-office tasks that prevented the final output not only being customer focused but improving the whole service for this one.
The Design Council (2005) created the double diamond diagram approach methodology to solve the problematic situation. The points where critical thinking and all creative possibilities meet are mapped to achieve the goal of providing a better and differentiating service for the client. This methodology is divided into 4 parts: discover, define, develop and deliver parts. Figure 41 shows the 4 parts
47
Source: Desing Council
➔ Discover is the first phase. Designers at this stage raise requirements about the needs of the service and develop the first ideas of what it will be. The main objective will be to solve problems in the service, creating opportunities for improvement. The focus will be to bring innovation to the service, so immediately integrate the whole team to have the most significant number of inputs. To align the company's strategy with the designers' vision and at the same time reconciling what the market perceives as value, this phase is of utmost importance.
➔ The define phase is the phase in which designers, after gathering all project requirements, identify and compile improvement opportunities for problem solving. These are organized by priority to meet the wishes of the organization. At this stage, there is a significant concern in brainstorming and team-work with the whole team to develop methodologies for the project.
➔ It is in the develop phase that all service component solutions are created. Here all components of the service are conceptualized so the service is the most enjoyable and fluid for all customers. The integration of all processes is important at this stage and testing with end-users is done so that the design of the service is the best possible to meet with customer’s needs.
➔ Lastly, the delivery phase is the phase in which the latest adjustments and tests are performed. At this stage it is important to gather feedback on what is being implemented to correct errors and improve processes as much as possible.
48
This problematic situation analysis methodology tends to guide thinking into each phase of service design, separating the phases into smaller phases, giving specific guidance to the entire project team who will conceptualize, develop and implement the new service concept. Along with this double diamond diagram methodology are some guiding tools that will be discussed below.
2.3.3.3. Tools and Techniques for Service Design
As stated, for all phases of the double diamond diagram are linked to tools and techniques that guide the critical process. Thus, some of the tools for the discover phase are customer journey mapping, user diaries and service safari. In the define phase, brainstorming methods are used and a design brief is made. For the develop phase the service blueprint is usually used. Finally, for the deliver phase, it is used scenarios. The benefit of these tools is that they use methodologies that are adaptable given the level of detail that is required for the project. Some of these tools work best for larger projects and some for more specific projects (Design Council 2005).
On the discover phase,
• Boag (2015) states that the customer journey map is a map showing all points of customer interaction with the service, pointing out all steps within each interaction; • Design Council (2005) shows that a user diary serves to map the behavior of their
customers over the days to better understand their patterns of consumption;
• Design Council (2005) defines service safari as a method of direct customer observation, that is, to check “in loco” the service that is provided to customers and how they perceive it.
On the define phase,
• It is used brainstorming methodologies to get everyone thinking about a possible solution for service design, identifying potential improvement ideas and creating a great understanding of potential improvement opportunities.
• The design brief is used to create a plan for the development phase that contains the definition of problems and key challenges.
49 On the develop phase,
• The service blueprint (Tassi, 2009) is used, which is a methodology that describes the type of contact that customers have with the service. It is described process-by-process and step-by-step customer interactions with the service, as well as all back-office activities that support customer service. Basically, blueprint is the tool that compiles the entire process alignment strategy, customer flow alignment into the service, making it more enjoyable and focusing in all interactions between the client and the system.
Lastly, on the deliver phase,
• It is used a scenario study methodology that delivers possible future service improvement scenarios, as well as analysis outputs that support the decision to improve customer service delivery.