M
ASTER OF
S
CIENCE IN
FINANCE
M
ASTERS
F
INAL
W
ORK
PROJECT
EQUITY RESEARCH
:
I
NTEL
C
ORPORATION
F
RANCISCO
B
EJA
S
IMÕES
S
ALGADO
P
IEDADE
M
ASTER OF
S
CIENCE IN
FINANCE
M
ASTERS
F
INAL
W
ORK
PROJECT
EQUITY RESEARCH
:
I
NTEL
C
ORPORATION
F
RANCISCO
B
EJA
S
IMÕES
S
ALGADO
P
IEDADE
S
UPERVISOR
:
A
NA
I
SABEL
O
RTEGA
V
ENÂNCIO
Abstract
This analysis represents the valuation of Intel Corporation structured according to
ISEG´s Finance Master´s Final Work Project. This Equity Research Report is aligned
with the CFA Institute research report recommended guidelines. Intel Corporation
was chosen due to the special interest of the author in the technological sector, in
particular, in the semiconductor industry. Although supported by historical data and
past decisions of the company, this valuation was fundamentally structured according
to industry trends and projections for the foreseeable future. The valuation
methodology chosen was an average of three models, Discounted Cash Flow
Approach (DCF) at WACC method, Multiples and Dividend Discount Model (DDM).
The valuation yielded a price target of $55.53 with an upside potential of 6.61%.
Considering the current price of $52.09 and a high risk associated the final
recommendation for Intel’s common stock is “Reduce”. Assumptions regarding the
semiconductor market products were made through reliable sources of information
such as Business Insider and TechCrunch websites, amongst others. Financial
information was supported through websites such as Yahoo Finance and Bloomberg.
Resumo
Esta análise representa a valorização da empresa Intel Corporation de acordo com as
normas do mestrado de Finanças do ISEG, em particular, das normas para
apresentação de projeto para Trabalho Final de Mestrado. O relatório de avaliação
aqui presente segue as estruturas recomendadas pelo Instituto CFA. A Intel foi a
empresa escolhida pelo autor pelo seu interesse pessoal no setor tecnológico, em
particular, pela indústria dos semicondutores. Embora esta análise tenha em
consideração informação histórica e decisões anteriores da empresa, a avaliação da
Intel foi preferencialmente assente em tendências futuras e projecções para a indústria
semicondutora. A metodologia de avaliação escolhida foi uma média ponderada entre
os Fluxos de Caixa Descontados (DCF), Múltiplos e Dividendos Descontados (DDM).
O resultado da avaliação originou um preço-alvo de $55.53 com um potencial de
valorização de 6.61%. Tendo em conta o preço atual da ação da Intel de $52.09 e um
risco associado de grau elevado, a recomendação final para a ação da empresa Intel
Corporation é de “Reduzir”. Os pressupostos assumidos relativamente à indústria
semicondutora foram baseados em informação de fontes fidedignas, tais como os
websites Business Insider e TechCrunch, entre outros. Informação financeira foi
extraída de websites tais como Yahoo Finance e Bloomberg, entre outros.
Acknowledgements
Choosing a risky industry such as the semiconductors and a big company such as
Intel that reports under US GAAP was both very challenging and very interesting. In
the end, it can be said that this project highly contributed to my knowledge and
education in the Masters in Finance programme.
To my friends and specially my family who helped me through the long hours of work
and supported me.
A special dedication in memory of my grandmother Filomena who supported me
through my entire educational path and unfortunately is no longer here to see the end
of the journey.
To all the professors who lecture me during the Masters course, especially to
Professor Ana Venâncio for being my supervisor.
Index
Abstract
ii
Resumo
iv
Acknowledgements
v
Index
vi
List of Figures
vii
List of Tables
ix
1.
Research Snapshot
1
2.
Business Description
2
3.
Management and Corporate Governance
4
4.
Industry Overview and Competitive Positioning
6
5.
Financial Statements Forecast and Valuation Drivers
12
6.
Investment Summary
15
7.
Valuation
16
8.
Investment Risks
20
Appendices
23
Appendix 1: Statement of Financial Position
23
Appendix 2: Income Statement
24
Appendix 3: Cash Flow Statement
25
Appendix 4: Key Financial Ratios
26
List of Figures
Figure 1. I
ntel’s historical stock price and 2019YE price target
Figure 2. Valuation Summary Units in USD
Figure 3. Intel’s logotype
Figure 4. Intel’s first product
Figure 5. Intel’s latest microprocessors
Figure 6. Operating segments (% revenues)
Figure 7. PC Centric Business Revenues in million USD
Figure 8. Data Centric Business Revenues in million USD
Figure 9. Intel’s cash to stockholders in billion USD
Figure 10. Aggregated CCG and DCG In percentage of revenues
Figure 11. Intel’s top-3 customers
Figure 12. PC, Tablet and Smartphone time spent in digital media Units in minutes
(MM)
Figure 13. Global data center market Units in billion USD
Figure 14. CPU’s market share for Intel and AMD
Figure 15. Cloud IT infrastructure based on value
Figure 16. Top USA semiconductor companies Units in million USD, 2018
Figure 17. Porter’s Five Forces
Figure 18. China’s Real GDP growth (YoY)
Figure 19. Singapore’s Real GDP growth (YoY)
Figure 20. USA’s Real growth (YoY)
Figure 21. Intel’s revenues 2016-2023 In million USD
Figure 22. Intel’s forecasted performance Units in million USD
Figure 23. Intel’s cost of sales and operating expenses forecasted Units in million
USD
Figure 24. Intel’s historical and forecasted CapEx Units in million USD
Figure 25. Intel’s historical and forecasted debt Units in millions USD
Figure 26. Intel’s forecasted cash-flow activities Units in millions USD
Figure 27. Intel’s dividend payments and stock repurchases Units in million USD
Figure 28. Intel’s multiples valuation output
Figure 29. Intel’s forecasted FCFF Units in million USD
Figure 30. Intel’s forecasted WACC, cost of equity and cost of debt Units in
percentage
Figure 32. Market risks
Figure 33. Political risks
Figure 34. Technological risks
List of Tables
Table 1. Analyst’s Risk Assessment
Table 2. Intel’s stock information
Table 3. Recommendation system
Table 4. Intel’s Board of Directors
Table 5. Intel’s management team
Table 6. Intel’s Stock Ownership Guidelines
Table 7. Top PC manufacturers Units in thousands
Table 8. Top semiconductor companies by revenue 2018
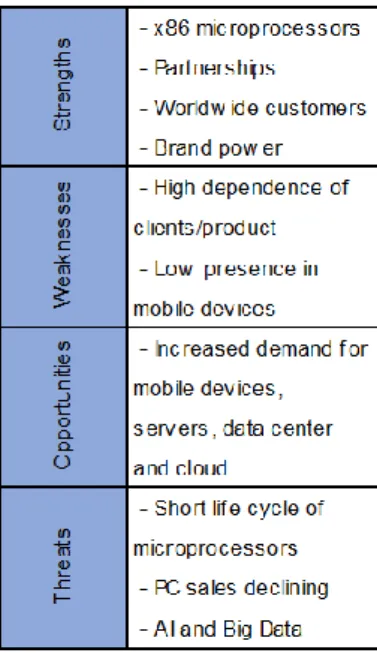
Table 9. Intel’s SWOT analysis
Table 10. PEST analysis
Table 11. Forecasted CapEx and respective allocation Units in million USD
Table 12. Intel’s DCF outputs Units in million USD, except #shares outstanding
(million) and price target
Table 13. Intel’s FCFF detailed inputs
Table 14. Intel’s DDM valuation output Units per share
Table 15 Valuation results Units in USD
Table 16. Discount rate inputs Units in percentage except Beta
Table 17. Intel’s Equity and Debt weights
Table 18. Terminal Period growth rate inputs Units in million USD except percentage
values
Table 19. Intel’s Terminal FCFF forecast Units in million USD except percentages
Table 20. Multiples valuation Prices in USD
Table 21. Price Target’s Sensitivity Analysis
Table 22. WACC’s Sensitivity Analysis
The final recommendation for Intel Corporation is REDUCE at 2019YE with a price target of $55.53 and an upside potential of 6.61% relative to the current price of $52.09.
Figure 1 – Intel’s historical stock price and 2019YE price target
Source: Author, Yahoo Finance
The recommendation for Intel was achieved through an average of a Discounted Cash Flow valuation, a Dividend Discount valuation and a Multiples valuation. The Discounted Cash Flow valuation yielded a price target of $58.49 with an upside potential of 12.29%.
Using the Multiples market-based approach the obtained price target was $55.42 with an upside potential of 6.39%.
Finally, with the Dividend Discount Model the price target obtained was $52.68 with an upside potential of 1.14%.
The summary of price targets can be found in Figure 2.
2019 will be a critical year for Intel, after the increased performance of last year against the negative reviews by analysts, on average. With the growth in the PC market practically close to zero and data market presenting high volatility , Intel will have to thrive in performance in order to surpass its close competitors and adjust its operations to offer clients the latest advances in chips technology.
Concerning risk assessment, as one of the top players in the semiconductor industry, Intel is exposed to the high risk of the technological sector. Additionally, Intel is also exposed to political factors such as the USA-China trade war. With China being the biggest customer of Intel, the escalation of the commercial relations between these two countries can affect Intel’s operations widely. Aggregating all these issues, Intel is classified as High risk.
Table 3 – Recommendation system
Intel: The Next Data-Centric Company
Level of Risk SELL REDUCE HOLD/NEUTRAL BUY STRONG BUY
High Risk 0%≤ >0% & ≤10% >10% & ≤20% >20% & ≤45% >45%
Medium Risk -5%≤ >-5% & ≤5% >5% & ≤15% >15% & ≤30% >30%
Low Risk -10%≤ >-10% & ≤0% >0% & ≤10% >10% & ≤20% >20%
Low Medium High
Source: Author
Table 1 - Analyst’s Risk Assessment
Indicator Intel
Stock Ticker INTC Previous Close 51.11 52 Week Range 42.36-59.59 Market Capitalization (billion USD) 230.759 #Shares Outstanding (billion) 4.43
Table 2 – Intel’s stock information
Source: Author, Yahoo Finance
Figure 2 – Valuation Summary Units in USD
(NASDAQ: INTC)
Intel Corporation (Figure 3) is an USA multinational semiconductor firm headquartered in Santa Clara, California, offering technologies for computing, networking, data storage and communications. Founded in 1968 by Robert N. Noyce and Gordon E. Moore as “NM Electronics”, Intel was backed by Arthur Rock, a venture capitalist who raised $2.5M for Intel and became the company’s first Chairman.
Intel became public in October 13, 1971 and is traded on the NASDAQ Global Select Market under the ticker INTC.
At 2018YE Intel employed over 107.400 workers, with 85% in technical roles. According to region, almost half of the workforce was employed in USA (48%). The remaining workforce was split between Asia-Pacific (29%), EMEA (20%) and Latin America and Canada (3%).
Intel was the biggest semiconductor company by sale until 2016, when it was surpassed by Samsung.
Intel was placed #14 in Forbes 2018 ranking for world’s most valuable brands and placed #46 in the 2018 Fortune 500, ranked by USA companies total revenue. Early history and strategies
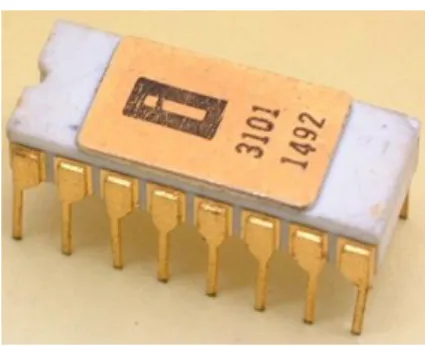
Originally, Intel was focused on memory chips. In early 1970s, Intel thrived with its DRAMs, launching its first product, the 3101 Schottky bipolar RAM (Figure 4), just one year after its incorporation. These memory products were cheaper and required less power than the previously used magnetic -core memory chips, achieving a revolution in the memory market. Later that decade, with the rise of Japanese companies such asHitachi, Fujitsu and Nippon Electric, Intel lost its dominance and was forced to abandon this market.
During the 1980s, Intel shifted its focus from memory products to microprocessors , building with these products a reputation recognized until nowadays. Intel strategy was based on making new microprocessors faster than the previous models, making the new ones with more transistors in their cores. These phenomenon was known in 1965 as Moore’s Law, as Gordon Moore observed the number of
transistors in a chip would approximately double annually. In 1975, Moore’s Law was updated to doubling biannually. Until now, this rule still holds
In the 1990s Intel was already a market leader in the PC business, supplying chips for almost every PC manufacturer. Its status of PC market leader maintains presently with its 9th generation latest products (Figure 5), although with more resistance from other competitors.
In 2013, Intel set out the strategy to become a data centric company.
Accompanying the evolution of technology and data, the company evolved from a PC-centric company with a server business, to a data-centric company with an expanding portfolio of technology solutions that address customer needs across platform, storage, connectivity, and software.
Presently, Intel is pursuing its new goal, to be leading end-to-end platform provider for the new data world, while maintaining its dominance in the PC market.
Products
Intel is a major player in the semiconductor industry and technology sector.
Its business comprises designing, manufacturing and selling computer components and its related products. Some major products include microprocessors, chipsets, embedded processors and microcontrollers, flash memory, graphic, network and communication, systems management software, conferencing, and digi tal imaging products. The majority of the company’s products are designed for PCs and data centers.
Businesses
Intel currently divides its activities into five groups (Figure 6), distributed within two businesses, namely, PC-centric business and data-centric business.
Intel Corporation
Figure 6 - Operating segments (% revenues)
Source: Author, annual reports Source: Author, company data
Figure 3 – Intel’s logotype
Figure 4 – Intel’s first product
Source: Author, company data
Source: Author, company data
PC-Centric Business
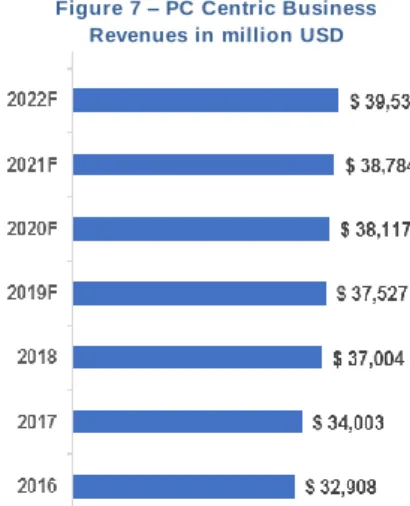
The Client Computing Group (CCG) includes end-user platforms designed for notebooks and desktops and wireless and wired connectivity products. These group (Figure 7) comprises mainly CPUs and chipsets, SoC, mobile processors and graphics and memory products. CCG focus on higher growth segments of 2-in-1, thin-and-light, commercial, and gaming, as well as growing adjacencies such as WiFi and modem.
Data Centric Business
The Data Center Group (DCG) includes workload-optimized platforms and related products for enterprises, clouds and communication infrastructure market
segments (Figure 8). DCG offers products for compute, storage, and network functions, focusing on three market segments: cloud service providers, enterprise and government, and communication service providers.
The Internet of Things Group (IOTG) includes high-performance compute solutions for targeted verticals and embedded applications for diferent market segments such as retailers, manufacturers, health care providers, energy companies, automakers, and governments. The products in this group allow customers to create, store, and process data generated by connected devices to accelerate business transformations. IOTG comprises products such as processors-based computing, wireless connectivity, FPGAs, Movidius VPUs, and developer tools such as the OpenVINO software toolkit.
The Non-Volatile Memory Solutions Group (NSG) includes Intel® Optane technology and 3D NAND flash memory, primarily used in solid-state drives (SSDs). Some of the customers include enterprise and cloud-based data centers, users of business and consumer desktops and laptops, and a variety of Internet of Things application providers.
The Programmable Solutions Group (PSG) includes programmable
semiconductors, primarily field-programmable gate arrays (FPGAs), and related products for a broad range of markets, such as communications, data center, industrial, and military. In this business segment is also included all other remaining businesses, including Mobileye.
Source: Author, company’s annual reports
Figure 7 – PC Centric Business Revenues in million USD
Figure 8 – Data Centric Business Revenues in million USD
Intel’s Corporate Governance (CG) structure is consistent with the Anglo-Saxon model, which comprises a Board of Directors and a Statutory Auditor (Ernst & Young LLC). The Board of Directors (Board) is responsible for oversight, counsel and direction regarding the management team, reassuring shareholder’s interests are being fulfilled. Intel’s Board currently has ten directors (Table 4), from which nine are independent, consistent with Intel’s policy of having a majority of independent directors. Presently, Intel’s Board has five standing committees, namely Audit (A) Compensation (C), Corporate Governance and Nominating (CG&N), Executive (E) and Finance (F). The composition of each committee can be found in Table 4. As Intel’s general policy since its incorporation, the positions of Chairman and CEO are held by different persons to help oversight of the
management team. Some of the policies currently active are the rigorous stock ownership guidelines (Table 6) for directors and officers of Intel, for example, limited number of boards for which a director can be a member of, annual
evaluation of directors and officers and performance-based compensations for the management team.
As stated in the annual reports and in Intel’s CG guidelines, the company’s policy framework in place was designed to support the Board’s responsibilities. The referred policies and guidelines are continuously reviewed and updated to assure they are suitable for Intel’s best interests and its stakeholders.
Intel key members
Robert H. Swan was recently appointed as Chief Executive Officer and member of the Board of Directors since January 2019. Previously, Swan served as interim Chief Executive Officer, Executive Vice President and Chief Financial Officer after joining Intel in October 2016. Before Intel, Swan was Operating Partner at General Atlantic LLC and Senior Vice President, Finance and Chief Financial Officer of eBay Inc. Swan also served as an Executive Vice President and Chief Financial Officer of HP Enterprise Services, LLC from February 2003 to March 15, 2006. He earned his bachelor’s degree in business administration from the University at Buffalo and his MBA degree from Binghamton University. He currently serves on the board of directors at eBay and was present as Director in several companies such as Skype Global and PayPal Holdings, amongst others.
Andy D. Bryant has been Chairman of Intel’s Board of Directors since May 2012. Bryant holds a MBA degree with a concentration in finance from University of Kansas. After joining Intel in 1981 as a controller for the Commercial Memory Systems Operation. Bryant served in positions such as Vice Chairman of the Board of Directors, Chief Administrative Officer, Executive Vice President, Senior Vice President and Chief Financial Officer. Currently, Bryant is present on the board of directors of Columbia Sportswear Company and Mckensson Corporation.
Dr. Venkata S. M. Renduchintala is the Group President, Technology, Systems Architecture and Client Group and Chief Engineering Officer of Intel. Renduchintala holds a MBA degree and a Ph.D in digital communications from the University of Bradford. Before joining Intel in November 2015, Renduchintala was Co-President of Qualcomm CMDA Technologies. He currently serves on the board of directors of Accenture plc.
Steven R. Rodgers has been Intel’s Executive Vice-President and General Councel since January 2017. Rodgers obtained Juris Doctor degree from University of Utah. Joining Intel in 2000, Rodgers recently served as Senior Vice President and Corporate Vice President. Before Intel, Rodgers was a litigation partner at Brown & Bain, P.A.
Navin Shenoy has been Executive Vice President and General Manager of the Data Center Group since May 2017. Shenoy recently served as Senior Vice President and General Manager of Client Computing Group and General Manager of the Mobility Client Platform Division, joining Intel in 1995. Shenoy completed the
Management and Corporate Governance
EXECUTIVE OFFICERS OF
THE REGISTRANT OFFICE(S)
Andy D. Bryant Chairman of the Board
Dr. Venkata S.M. Renduchintala
Group President, Technology, Systems Architecture and Client Group; Chief Engineering
Officer
Steven R. Rodgers Executive Vice President;
General Counsel Navin Shenoy
Executive Vice President; General Manager, Data Center
Group
Robert H. Swan Chief Executive Officer
Todd M. Underwood
Interim Chief Financial Officer; Vice President of Finance and Director, Corporate Planning
and Reporting Table 5 – Intel’s management team
Source: Author, annual reports
Committee Membership A C CG&N E F Aneel Bhusri ● ● Andy D. Bryant O
Reed E. Hundt O O
Omar Ishrak O O
Risa Lavizzo-Mourey O O
Tsu-Jae King Liu O ●
Gregory D. Smith ● O
Robert (Bob) H. Swan O
Andrew Wilson ● O
Frank D. Yeary O ● ● Chair/Co-Chair
O Member
Source: Author, company data
Table 4 – Intel’s Board of Directors
Title Min #shares
CEO 250,000 Executive Chairman & President 150,000 CFO 125,000 Executive Vice President 100,000 Senior Vice President 65,000 Corporate Vice President 35,000 Other VPs, Intel
Fellows, and Senior Leaders
5,000 or 10,000
Table 6 – Intel’s Stock Ownership Guidelines
Stanford Executive Program at Stanford University and bachelor’s degree in electrical engineering from the University of Michigan.
Todd M. Underwood was appointed Intel’s interim Chief Financial Officer as of January 2019. Since August 2016, Underwood has been Vice President of Finance and Director, Corporate Planning and Reporting of Intel. Underwood joined Intel in 1992. He holds a bachelor’s degree in finance from the University of Oregon and earned his MBA degree from the University of Portland.
Dividends and share repurchases
One of Intel’s financial capital allocation priority is to return cash to stockholders. Since 2016, dividend per share has increased at 7% CAGR, achieving the value of $1.20 per share in 2018.
The company also has share repurchase programs to return cash to its shareholders. In 2018, Intel spent $10.7B in stock repurchases.
Aggregating both dividends and share repurchases, Intel’s returned $16.2B to its stockholders in 2018 (Figure 9). This value represented a growth of 82%
comparing with 2017.
Corporate Responsibility
Intel’s corporate responsibility holds on four pillars, namely:
- Environmental Sustainability, which focus on water saving and reduce emissions of pollute gases;
- Supply Chain Responsibility addresses the prevention of forced and bounded labor. The company engages with its suppliers that workers should not have to pay fees to obtain or keep employment. Since 2014, as a result of these commitments, Intel’s suppliers have returned over $14M in fees to workers.
- Diversity and Inclusion represents the commitment of the company to achieve its goal of full representation of women and underrepresented minorities in its USA workforce.
- Social Impact is addressed through Intel’s employee’s volunteer initiatives. In the last ten years, the company’s workers have contributed with more than 10 million hours of service in the communities where Intel operates. Additionally, in
celebration of the company’s 50th anniversary, during 2018 Intel donated 1.5M hours of volunteer work with more than 68.000 employees contributing for that goal.
Source: Author, company’ s annual reports Figure 9 – Intel’s cash to stockholders
Intel’s business groups outlook, drivers and trends
As previously mentioned, Intel is structured into five business groups. In this section, each group will be explored individually, to understand what their main drivers are and what special features they possess. Matching current market conditions and future trends with each of Intel’s business specifications will provide the core and background to forecast cash-flows and value Intel. The focus of this analysis will be on the Client Computing Group (CCG) and in the Data Center Group (DCG), since they are the two reportable operating segments, aggregating 84% of Intel’s revenues by 2018YE (Figure 10). The remaining segments don’t meet the quantitative threshold to qualify as reportable operating segments, as stated in Intel’s 2018 annual report. Nonetheless, they also must be accounted in this analysis, for a more representative view of Intel business.
Client Computing Group
The CCG represents the majority of Intel’s sources of revenue. Although
representing 52% of the company’s revenue 2018YE, it has been decreasing since 2013, when Intel set out the strategy to transform from a PC-centric to a data-centric company.
The performance of this group is highly correlated with the evolution of PC sales worldwide. According to Gartner (2018) worldwide PC shipments declined for the seventh consecutive year. The YoY decline rate in 2018 was 1.3%, less intense compared with the previous three years, according to the same source. Statista (2018) and IDC (2018) also support those numbers and predict the continuing decrease of PC sales worldwide until 2023.
Despite the market conditions regarding PC industry, the three biggest PC
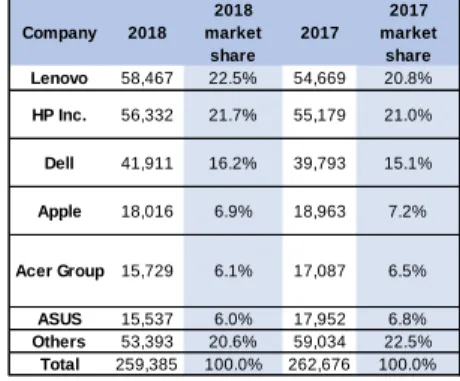
manufacturers, namely Lenovo Group Limited, HP Inc. and Dell Inc . are increasing their position in the market. Comparing results from 2017 to 2018, all three
companies increased their market shares (Table 7). The same triad of companies represent Intel’s biggest clients, accounting for 39% of Intel’s net revenue 2018YE. In the previous years 2017 and 2016, the same triad accounted for, respectively, 40% and 38% of Intel’s net revenue (Figure 11).
Facing decreasing demand for PC components, Intel still managed to increase revenues in CCG over the last four years. Desktop sales overall decreased continuously, following the market conditions of PC sales declining. The progress registered in this group was fueled by the increasing demand for high performance products and high growth segments like gaming and commercial. Benefiting from high degree of differentiation and brand power, Intel was able to benefit from increasing average selling price, even in decreasing volumes such as desktop. The increasing usage of mobile devices such as smartphones and its chips are also highly correlated with Intel’s PC-business. For workstation PCs, business PCs and other similar market segments, smartphones don’t constitute a reliable
substitute product. However, concerning leisure, travel and adaptability, smartphones are becoming a very powerful substitute to computers.
Represented in Figure 12 is the time spent in digital media using PC, tablet or smartphone for 2013-2016 period. It can be observed the increase usage of smartphone growing exponentially while PC usage has been declining. The new generation of smartphones are very fast and easy to use. Its chips, usually ARM -based, have lower power consumption, lower cost and high heat resistance, making them suitable for portable devices such as smartphones, tablets,
smartwatches and other peripherals. In this area, ARM-based architectures are the main competitor of traditional x86 chips designed by Intel. Some of these chips products already are (or can be in a recent future) substitute products for PC chips. As an example, NVIDIA’s best known GPUs have properties that make them a good proxy for traditional CPUs in tasks such as image and speech recognition. To conclude the CCG group analysis, there is only one major item left to include. Adjacent technologies such as modems are included in this operating group. At this point 5G network is the main driver of this area. Presently with only a handful of 5G
Industry Overview and Competitive Positioning
Source: Author, annual reports
Figure 10 – Aggregated CCG and DCG In percentage of revenues Company 2018 2018 market share 2017 2017 market share Lenovo 58,467 22.5% 54,669 20.8% HP Inc. 56,332 21.7% 55,179 21.0% Dell 41,911 16.2% 39,793 15.1% Apple 18,016 6.9% 18,963 7.2% Acer Group 15,729 6.1% 17,087 6.5% ASUS 15,537 6.0% 17,952 6.8% Others 53,393 20.6% 59,034 22.5% Total 259,385 100.0% 262,676 100.0%
Table 7 – Top PC manufacturers Units in thousands
Source: Gartner
Source: Author, annual reports
Figure 11 – Intel’s top-3 customers
Source: Media Metrix & Mobile Metrix USA
Figure 12 – PC, Tablet and Smartphone time spent in digital media
modem providers, Intel modem XMM 8060 is suitable not only for PCs but als o for smartphones and connected cars. The progression of 5G networking and Intel’s position towards its development is linked to the performance of CCG group and Intel overall.
Data Center Group
DCG is the second largest business group of Intel by revenue, representing 32% of Intel’s net revenue 2018YE. In the last five years, DCG experienced a continuous growth in revenues at 9.8% CAGR. Intel goal to become a data centric company resulted in the expansion of data businesses and in its increase in percentage of revenues YoY. Growth was achieved through rising demand markets such as clouds and communications service providers. The importance of data is continuously increasing nowadays. The demand for process, analyze, store and move data is growing, matching the explosive evolution of digital services, artificial intelligence and data analytics. Figure 13 represents the forecasted growth in global data center market, achieving 11% CAGR from 2017-2023 period, according to Reuters (2019). Enterprises are becoming more digital with the need for data storage and accessibility growing constantly.
In this group, Intel offers its clients a variety of solutions to optimize their data centers, to compute, storage and network their data. From proc essors, memory and storage products and accelerators such as FPGAs, Intel offers products from the data center core to the network edge. Major clients of this group include cloud service providers, enterprises and government and finally communications service providers.
Dealing with customers data is a very sensitive issue with concerns like privacy and ethics. In the data business, security must be a prime feature of the solutions presented by companies such as Intel. According to Business Insider (2018), Intel chips infrastructure was discovered to have flaws, in January 2018. Several customers changed their chips suppliers to protect their data centers. For the client’s perspective, it would be complex to change already installed chips. However, changing from Intel to AMD, the major Intel’s competitor, would be easier since both companies share x86 chip design. CPU’s market share for Intel and AMD can be found in Figure 14, since Q12004 to Q12019.
An alternative to this chip design are ARM-based chips if they can have enough power to match x86 chips. In this situation, software would need to be adjusted in the data center infrastructure, translating into higher switching costs. Some ARM-based chip designers are already working to mitigate this software switching costs, like Qualcomm and Cavium.
According to King (2018) on April 27th 2018, Intel chips controlled 99% of the market for data centers. This dominance was fueled by giant technological clients such as Alphabet (Google), Amazon and Microsoft. Following the same source, in the last quarter of 2018, demand in this market slowed, with the big clients being more cautious with their orders. According to Intel’s CFO Bob Swan, this desacelaration in demand was driven by Intel’s client’s accumulated stocks with special focus on China softer demand for data centers chips.
Concerning data and its usage for enterprises, one major trend to consider is the open source software products. Using open source software provides higher compatibility between platforms inside the company at lower cost. This enables better communication between different areas of the same company and better access and maneuver of data. In Figure 15 the forecasted distribution value per cloud type can be found, showing an increase in public and private clouds. Some technological giants such as IBM and Microsoft have already made significant investments in this field in 2018. In June, GitHub was acquired by Microsoft for an amount of $7.5B. This M&A process was set to ease data centers administrators and software developers on managing and sharing their codes within their organizations. Later that year, in October, IBM purchased Red Hat for $34 B, showing IBM’s intentions of gaining share in the cloud market. As companies optimize their workloads based on big data, machine learning and artificial intelligence, improved hardware is also required to power the systems. Traditional CPUs offered by Intel are not suitable for this new technologies. Instead, other products are gaining popularity due to its adaptability to this kind of systems such as GPUs. In this area, NVIDIA’s offer is very broad. Other
Figure 13 – Global data center market Units in billion USD
Source: Reuters
Source: Wccftech
Figure 14 – CPU’s market share for Intel and AMD
Figure 15 – Cloud IT infrastructure based on value
companies are also developing their own products. For instance, Google is developing tensor processing units, a new product to mitigate the flaws that traditional chips have with new data technologies.
To conclude, all these issues affect directly and indirectly how data is being managed, and how software and hardware must match in order to fully work in a system. This trends not only affect DCG, but also the remaining data groups of the business such as IOTG, NSG and PSG.
Semiconductor industry analysis
There are three groups of companies in the semiconductor industry according to their production model. The companies can be integrated device manufacturers (IDM), fabless companies or foundry companies. The biggest companies of the industry can be found in Table 8, according to 2018 revenue.
The integrated device manufacturers (IDM) design, manufacture and sell integrated circuits. These companies buy raw materials (the semiconductor material itself) and intervene in all the stages of production and assembly of its chips, delivering the final output to the costumer. IDM-type biggest companies include Micron Technology, Samsung, SK Hynix and Texas Instruments (Texas I). The fabless semiconductor companies like Qualcomm, Broadcom, AMD and NVidia outsource the production of its chips to “pure-play” semiconductor companies called foundries, like TMSC, GlobalFoundries and UMC. This
production model allow fabless companies to concentrate their resources in R&D, benefiting from lower labor costs of the foundries, most of them located in Taiwan and China were the cost of labor is cheaper.
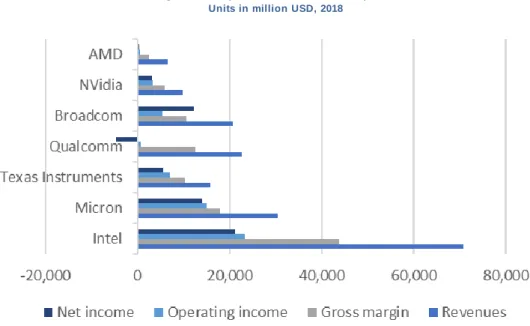
In Figure 16 can be found performance values for the top USA semiconductor companies regarding 2018.
Figure 16 – Top USA semiconductor companies Units in million USD, 2018
Source: Author, Yahoo Finance
Company Headquarters Type
Qualcomm USA Fabless
Broadcom USA Fabless
Nvidia USA Fabless
Mediatek Taiwan Fabless
Micron USA IDM
Samsung Korea IDM
SK Hynix Korea IDM
Texas
Instruments USA IDM
TSMC Taiwan Foundry
GlobalFoundries USA Foundry
UMC Taiwan Foundry
Table 8 – Top semiconductor companies by revenue
2018
As previously mentioned, Intel services are divided into two main businesses, the PC-centric business and the data-centric business.
In the PC-centric business, Intel’s chips face intense competition from Advanced Micro Devices (AMD). Intel and AMD have controlled the market of x86
architecture chips, with a combined market share of more than 90% in the last decade. Intel’s dominance in the PC and laptop markets is decreasing, being challenged by AMD and NVIDIA (known for its GPUs). In addition, Intel also faces competition from products that substitute traditional computers, such as tablets, smartphones and other mobile devices such as smartwatches (Table 9). This mobile devices require less power and more efficient chips, usually based on ARM -architecture. ARM is a British company, owned by SoftB ank Group, who licences the designs of its chips to leading companies in the mobile devices chip-making. Such companies include Apple, Samsung, Qualcomm and NVIDIA. With the transition from PC to smartphone in some segments, smartphone chips are being more demanded. For these chips, Samsung is the big player, making chips for its own brand and also for other brands in the market such as Apple.
In the data-centric business, Intel supplies platforms for its client’s data centers, to power their servers, storage units and networks. In this business, Intel also faces once more the competition from AMD and NVIDIA, especially in products such as processors and accelerators. Regarding memory and storage products, there are other providers of NAND flash memory products besides Intel, namely, Samsung (market leader of memory chips), Micron and SK Hynix. For enterprises and cloud sector, Intel faces competition of IBM.
Concerning connectivity products, Intel is present in the very competitive market of 5G modems, along with Qualcomm (market leader of smartphone modems) and Samsung, amongst others.
Porter’s Five Forces
Threat of new entrants (medium)
The semiconductors industry, like a technological sector in general, is
characterized by a lot of IPs* like patents, copyrights, trademarks and other rights. Huge fixed costs are needed to start production are required in order to build a factory or to develop a new product. These two barriers to entrance make very difficult for a firm to enter in the market and compete with the already established companies. However, in recent past years, some semiconductor firms started to outsource production of its chips to foundries, taking benefit of their lower labor costs. In following years, not having a factory for production may not be a barrier to entrance in this industry. Moreover, it must be taken into consideration that big semiconductor firms can enter into other market segments and benefit from synergies in production costs and/or combining different products/packages.
Threat of substitute products/services (high)
IPs serve as barriers to entry in this industry. They also allow firms who invest significant amounts of their resources in R&D to keep comparative advantages of new technologies discovered or new products designed. However, being a highly competitive industry, comparative advantages don’t hold for long periods of time. Rival companies are constantly developing new products. Every year,
semiconductor companies must present new enhanced products to maintain their market shares, otherwise, competitors will benefit from it . Diversification is key in this industry. As new technologies are discovered, there is a high demand for faster and more efficient chips to support them. Only firms that can keep up with this rhythm can thrive in this industry.
Bargaining power of buyers (medium/low)
Although the switching costs for the buyers are low, the majority of the
semiconductor’s industry segments are controlled by two or three big firms. The
Figure 17 – Porter’s Five Forces
Source: Author 0 - N/A 1 - Low 2 - Low/Medium 3 - Medium 4 - Medium/High 5 - High Source: Author
high degree of product differentiation and the fierce competition amongst buyers to get the best available chips in the market reduce de bargaining power of buyers in this industry. However, for some of the market leaders such as Intel or Samsung, there are a few number of big clients who represent significant percentages of their revenues, who might have some bargaining power.
Bargaining power of suppliers (medium/high)
For the IDMs, who manufacture and design their own chips, the bargaining power of suppliers is relatively low. Big semiconductor firms like Intel and Samsung, both IDMs, have many suppliers to mitigate the risk of depending on a few of them, reducing the influence that suppliers could eventually have on them. However, considering the fabless companies, who specialize on designing their chips and outsource production to the so called foundries, the suppliers have more power over them. Considering the big foundries, the majority of them are Asian-based companies. They benefit from lower labor costs, giving them a cost advantage and some leverage over their clients. Since there are only a few of major foundries, the switching costs for the fabless companies to change their foundries would be high. Only two or three companies could match the demand for chips for big clients such as Qualcomm, NVidia or AMD.
Rivalry among existing competitors (medium/high)
The high degree of product differentiation, the small number of big companies acting in the industry and the high technological factor associated with the products provide the semiconductors industry a medium/high level of rivalry. Product
differentiation is key in this market, requiring huge amounts of capital spent in R&D to fulfill the increasing demand for better and faster chips. The technological improvements in production or design of chips are a great influence on semiconductor companies since they are dependent on the availability of technologies (technological factor).
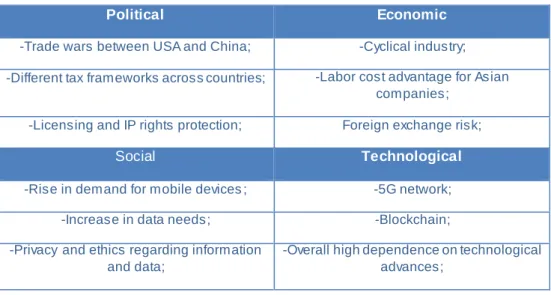
Table 10 – PEST Analysis
Political Economic
-Trade wars between USA and China; -Cyclical industry;
-Different tax frameworks across countries; -Labor cost advantage for Asian
companies;
-Licensing and IP rights protection; Foreign exchange risk;
Social Technological
-Rise in demand for mobile devices ; -5G network;
-Increase in data needs; -Blockchain;
-Privacy and ethics regarding information and data;
-Overall high dependence on technological advances;
In geographical terms, Intel’s biggest clients are China, Singapore and USA. The three countries combined generated near 69% of Intel’s revenue for 2018YE. In the previous year, the same three countries represented 66% of Intel’s revenue. In the following topics is addressed the macroeconomic outlook of these three countries to better understand how they can impact on Intel’s performance. China
The country where Intel generates the most revenues is China (including Hong Kong). On the last two decades, China experienced an average growth of 9% on a yearly basis concerning real GDP. This figure stands 5.2% above world average for the same period. Latest studies done by IMF (2019) show a decrease in China’s real GDP, with a forecasted average of 5.8% growth for the next four years (Figure 18). The same research shows a convergence to world’s average growth of 3.4% referring to the same period.
According to Chaoping Zhu (2019), global market strategist for JP Morgan Asset Management, the trade tension between USA and China is a key factor for this downward tendency of China’s economy.
Narrowing the analysis to the particular case of semiconductor industry, in 2018 only 16% of the semiconductors used in China were produced in the country. From this 16%, only 8% were produced by Chinese firms. These data shows the high degree of China’s dependence for foreign chips.
Singapore
Singapore ranks second in Intel’s biggest clients. In the first decade of the 21st century Singapore experienced average growth of 6.2%. Recently, the country’s economy shows signs of desacelaration, with forecasts for real GDP growth of 1.3% for the next four years (Figure 19), according to IMF (2019).
In 2018, Singapore registered close to $64.966M of semiconductor imports, from which approximately 6% came from USA, according to export.gov (2019). Singapore’s economy is also being affected by USA-China commercial war. According to Singapore’s Ministry of Trade and Industry (2019), the downturn in the country’s economy was partly due to the escalation in the US-China trade conflict in the latest quarters of 2019.
USA
The third biggest client of Intel’s products is USA. The China-USA trade war impacts are reflected in the IMF (2019) latest forecasts for USA’s real GDP growth for the next four years (Figure 20). The figure shows the decrease in YoY growth rates for USA’s economy.
According to French (2019), chairman of Silicon Power Technology, China is responsible for the consumption of 40%-50% of the world’s supply of
semiconductors. The same author pointed that, if China is forced to consume semiconductor products from its own production, the economy will be harmed, since the internal supply can’t match the overall demand for semiconductors. In 2018, the Chinese Government announced efforts to spend around $100B in the upcoming decade in investments to develop technology in areas such
semiconductors, Artificial Intelligence and quantum computing. This investment has the goal of catching up with USA technology.
Core Countries Macroeconomic Review
Figure 18 – China’s Real GDP growth (YoY)
Source: Author, IMF
Figure 19 – Singapore’s Real GDP growth (YoY)
Source: Author, IMF
Source: Author, IMF
Figure 20 - USA’s Real growth (YoY)
In 2013, Intel set out the strategy to become a more data-centric company, while maintaining its leadership in the PC business. In order to assess Intel’s business environment for the next five years, it is crucial to analyse two markets, the PC market and the data center market.
The PC market is mature and is starting to decline. The biggest computer OEMs are well established in the market, the production process is standardized and the in the last years there has been a decline in product sales.
On the opposite side, the data market is in a growing stage of the industry life cycle but with some uncertainty associated, as expected from technological sectors. Revenues
To assess Intel’s future sales, a market approach was applied. The company is a market leader in the PC business and data business, meaning that there is high and positive correlation between the segments and the company’s growth. The assumption at this stage is that Intel’s revenues will follow the market trends. The forecasted revenues can be found in Figure 21.
PC shipments have been decreasing since 2012. Latest studies stat e the extension of this growing trend for the next 5 years. However, inside the PC market, such as notebooks and detachable tablets, where Intel has a strong presence and has been increasing its position on, due to high degree of
differentiation offered by its products. According to IDC (2018), traditional PCs and detachables such as 2-in-1 laptops will grow on a CAGR of 0.05% for the next five years. Being a dominant firm in the market, with a very differentiated product and with its top three clients being the three biggest PC producers worldwide (showing growth in its market share in the last two years), it will be assumed that Intel sales in this operating segment will grow until 2023YE at a CAGR of 0.05%.
While data has been a market showing exponential growth in the past recent years, there has been some doubt about its continuation. Recent news suggest signs of market deceleration fueled by overstocking of its biggest players such as Google, Facebook, Amazon and Microsoft. Intel’s chips are a huge component of data centers and servers, being present in 98% of data center operations, according to Business Insider (2019) and control 99% of the market for server chips, according to data center knowledge website (2019). Despite that, recent data center market studies indicate the persistence of growth in the upcoming years. A very
conservative CAGR of 4% until 2023YE was assumed for t he data operating segment sales, according to predictions disclosed by IDC (2019).
For the non-reportable operating segments such as IOTG, NSG and PSG, sales growth rates related to Internet of Things market, memory market and global programmable market, respectively, were considered in order to fulfill revenue forecast. For the next five years, CAGR of 13.6%, 10.5% and 9%, respectively, were assumed. These figures were disclosed in reports by Datacenterdynamics (2019), MarketWatch (2019) and Businesswire (2019), respectively.
A summary of Intel’s forecasted results is stated in Figure 22. Operating Income
According to Reuters (2019), CEO Robert Swan said operating margins would remain relatively stable for the next years, and gross margins would decrease due to manufacturing problems related with 10nm chips.
For Operating Income, as percentage of sales for each specific operating segment, an average of the last three years was used to forecast until 2023YE.
Concerning operating expenses such as R&D and MG&A (Figure 23) the same method was used but considering all operating segments as a whole, since isn’t possible to allocate these costs to the different segments, as stated in 2018 annual report.
Financial Statements Forecast and Valuation Drivers
Source: Author
Figure 23 – Intel’s cost of sales and operating expenses forecasted
Units in million USD
Source: Author, company’s annual reports
Figure 21 – Intel’s revenue 2016-2023 In million USD
Figure 22 – Intel’s forecasted performance Units in million USD
Taxes
In the press release of 1Q2019 earnings report, Intel disclosed that is expecting to face an effective tax rate of 12% for 2019 period. For the 2019 forecast, that rate was assumed to be correct. For the remaining forecasted years, a constant effective tax rate of 10.96% was assumed, representing the average effective tax rate of semiconductor market companies worldwide given by Damodaran
database. CapEx
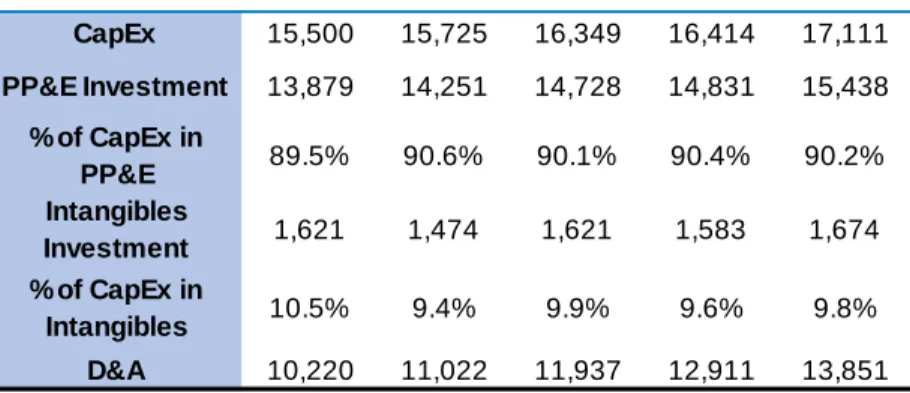
In 2019, CapEx is expected to reach $15.5B. From 2019 onwards (Figure 24), the amount of CapEx will be fixed as a percentage of EBIT(1-t) yearly, according to the industry average given by Damodaran. The invested amount will be split between PP&E and Intangible Assets, following similar allocations concerning the last three years.
Depreciation was computed on a yearly basis considered similar percentages of past years of PP&E, gross. Amortization was forecasted using an estimative of future figures given by the company in its 2018 annual report.
Table 11 – Forecasted CapEx and respective allocation Units in million USD
Source: Author, company’s earnings presentations
Inventories, Payables and Receivables
Intel’s inventory turnover has been reasonably constant in past years. It will be assumed that the company’s strategy will remain unchanged regarding its stocks management. Inventories will be fulfilled in order to keep inventory turnover stable. The same procedure can be applied to accounts receivable and accounts payable, with concerns to receivables turnover and payables turnover, respectively. At this stage, the assumption is that Intel will try to keep its efficiency despite the slow decrease in gross margins for the next years, as anticipated by the company (Reuters 2019).
Debt
Considering the approach of Michael Rees (2008), long-term debt will change in line with the company’s value. As a proxy for this variable, sales will be considered to reasonably measure the value evolution of Intel. In practical terms, the same YoY sales growth rate will be applied to long-term debt.
Repayments of long-term debt (both old debt and recent issues) will follow the same percentage rates of the last three years.
Concerning short-term debt, its value will be used to adjust short term financial/liquidity needs faced by the company.
Each year short-term debt will represent similar portion of current liabilities, averaged of the last three years.
The evolution of debt, both short-term and long-term, can be found in Figure 25.
2019YE F 2020YE F 2021YE F 2022YE F 2023YE F
CapEx 15,500 15,725 16,349 16,414 17,111 PP&E Investment 13,879 14,251 14,728 14,831 15,438 % of CapEx in PP&E 89.5% 90.6% 90.1% 90.4% 90.2% Intangibles Investment 1,621 1,474 1,621 1,583 1,674 % of CapEx in Intangibles 10.5% 9.4% 9.9% 9.6% 9.8% D&A 10,220 11,022 11,937 12,911 13,851
Figure 25 – Intel’s historical and forecasted debt
Units in millions USD
Source: Author, company’s annual reports Source: Author, company’s annual reports
Figure 24 – Intel’s historical and forecasted CapEx Units in million USD
Cash and cash equivalents
Regarding cash and cash equivalents, it is assumed that Intel will keep a minimum cash balance in percentage of its current liabilities. Each year the minimum cash balance will be the same percentage of current liabilities, averaged of the last three years. This assumption holds on the premise that Intel will keep in its cash account, at least, the sufficient amount to cover its short term needs, that is, current
liabilities.
If Intel isn’t capable of generate enough cash for its costs incurred in a period, the “Trading assets” items will be used to cover any amount in need.
Concerning excess cash, often associated with technological companies, Intel will split any excess amounts on “other investing” and “other financing” activities.
Dividends and stock repurchases
Returning earnings to its stockholders is a major concern for Intel. The amount of dividends paid is reasonably constant, not adjusting to short term fluctuations of results. The same growth rate of the last three years, on average, was assumed to forecast the dividend payments until 2023YE. As part of its distributions plan to stockholders, Intel also incurs in stock repurchases (Figure 27). For the period 2019-2023, the same percentage of earnings distributed was assumed equal, on average, considering the last three years. In practical terms, the remaining earnings left to distribute after the dividend payments are spent in stock repurchases.
Items excluded from the forecast
During the forecasted period, some items were left constant or assumed no material changes in its valuation, such as the case of impairment tests,
restructuring fees, significant divestitures, amongst others. Non-recurring items, contingencies and provisions for legal disputes were also left out of the analysis.
Source: Author, company’s annual reports
Figure 26 – Intel’s forecasted cash-flow activities
Units in millions USD
Figure 27 – Intel’s dividend payments and stock repurchases
Units in million USD
Intel’s current price holds at $52.09. For 2019YE, the average of the three valuation methodologies used yielded a price target of $55.53 with an upside potential of 6.61%.
With a high risk assessment, the final recommendation is REDUCE.
Valuation Approaches
Applying the DCF model, Intel’s FCFF were computed for the forecasted period 2019-2023. For the Terminal Period, a different FCFF was estimated using normalized free-cash flows. Discounting all cash-flows using WACC rate the enterprise value of Intel was achieved (Table 12). In order to get the value for equity, net debt was deducted to enterprise value, achieving a price target of $58.49 with an upside potential of 12.29%.
Table 13 – Intel’s FCFF detailed inputs
Source: Author
Through Multiples Valuation, using market data of peer companies, an average price target of $55.42 supported the conclusion that Intel’s stock is undervalued (Figure 28), with an upside potential of 6.39%. Being classified as high risk, the final recommendation is REDUCE.
Applying the Dividend Discount Model (DDM) due to the regular dividend
distribution and stock repurchase programs (Table 14) a price target of $52.88 was obtained with an upside potential of 1.14%. The final recommendation remains constant at REDUCE.
FCFF 2018YE 2019YE F 2020YE F 2021YE F 2022YE F 2023YE F
Net Income $ 21,053 $ 18,305 $ 19,805 $ 20,726 $ 20,745 $ 21,633 Non-cash charges $ 7,546 $ 10,446 $ 11,471 $ 12,252 $ 13,288 $ 14,236 Depreciation $ 7,520 $ 8,657 $ 9,523 $ 10,487 $ 11,530 $ 12,534 Amortization $ 1,565 $ 1,563 $ 1,499 $ 1,450 $ 1,381 $ 1,317 Amortization of acquisition-related intangibles $ 200 $ 204 $ 212 $ 221 $ 230 $ 241 (Gains) losses on equity
investments, net $ 155 -$ 22 -$ 237 -$ 94 -$ 147 -$ 144
After-tax interest expense $ 423 $ 401 $ 421 $ 438 $ 457 $ 478 interest expense $ 468 $ 456 $ 473 $ 492 $ 513 $ 536
effective tax rate 9.70% 12.00% 10.96% 10.96% 10.96% 10.96%
Investment in fixed capital $ 15,371 $ 15,500 $ 15,725 $ 16,349 $ 16,414 $ 17,111 PP&E $ 15,181 $ 13,879 $ 14,251 $ 14,728 $ 14,831 $ 15,438
Intangible assets $ 190 $ 1,621 $ 1,474 $ 1,621 $ 1,583 $ 1,674
Investment in working capital $ 10,403 $ 9,832 $ 10,728 $ 9,758 $ 11,485 $ 10,743 Currents assets $ 25,768 $ 24,434 $ 27,073 $ 25,501 $ 28,854 $ 27,741 Current liabilities $ 15,365 $ 14,603 $ 16,345 $ 15,742 $ 17,369 $ 16,998 Changes in WC -$ 19 -$ 571 $ 897 -$ 970 $ 1,726 -$ 741 FCFF 13,670 14,223 15,076 18,037 16,350 19,977
Investment Summary
Enterprise Value $ 288,618 Debt $ 27,637 Cash $ 3,176 Net Debt $ 24,461 Equity Value $ 264,157 # shares outstading 4,516 Price Target $ 58.49Table 12 – Intel’s DCF outputs Units in million USD,
except
#shares outstanding (million) and price target
Source: Author
Source: Author, Damodaran database
Figure 28 - Intel’s multiples valuation output PV (dividends and stock repurchases) 14.67 Terminal Period 58.65 PV (Terminal Period) 38.01 Price Target 52.68 DDM Valuation
Table 14 – Intel’s DDM valuation output Units per share
Source: Author DCF 58.49 Multiples (average) 55.42 DDM 52.68 Average Price Target 55.53 Valuation Methods Source: Author
Table 15 – Valuation results Units in USD
To value Intel, the preferred method used was Discounted Cash Flow model (DCF). In order to value Intel’s Enterprise value, FCFF were obtained and discounted with WACC rate. This approach is suitable due to the similar and constant capital structure in the last recent years (approximately 50/50 split
between Equity and Debt). The FCFF were obtained for the time period 2019-2023. A Terminal Value was forecasted under the assumption of going concern, that is, the company will continue to operate in the future and generate cash flows.
Free Cash Flow to the Firm (FCFF)
After the forecast of the financial statements, Intel’s FCFF (Figure 29) were obtained using the following formula:
𝐹𝐶𝐹𝐹 = 𝑁𝐼 + 𝑁𝐶𝐶 + 𝐼𝑛𝑡𝑒𝑟𝑒𝑠𝑡(1 − 𝑡𝑎𝑥 𝑟𝑎𝑡𝑒) − 𝐶𝑎𝑝𝐸𝑥 − ∆𝑁𝑊𝐶
From Net Income, Non-Cash Charges must be added, in particular D&A, and gains (losses) on equity investments. After-tax interest expense must also be added back to Net Income. In order to arrive to FCFF final value, it must be deducted the investments in fixed capital (Capex) and the investment in net working capital (changes in NWC).
Weighted Average Cost of Capital (WACC)
To discount the FCFF, WACC will be used as a discount rate, reflecting time value of money, the semiconductor industry risk and the country (USA) risk. Intel’s fundamentals will also be reflected in WACC rate (Figure 30), computed using the following formula (no preferred shares):
𝑊𝐴𝐶𝐶 =𝐸 𝑉∗ 𝑟𝐸 + 𝐷 𝑉∗ 𝑟𝐷 ∗ (1 − 𝑡𝑎𝑥 𝑟𝑎𝑡𝑒) Cost of Debt (rD)
Since the cost of debt for a company is a very specific figure, it was ruled out any market approach. The required rate for Intel to get a loan depends on Intel’s financial position and solvency, as well as the company ability to generate cash. In addition, it must be considered the business environment of the company and its history with debt payments. To summarize all this variables, the rate considered as cost of debt was the interest rate charged by banks to Intel in the last year (2018), given by the interest expense over the amount of debt in that period. This
assumptions holds on the premise that Intel’s debt holders see no change in the company’s ability to pay its long-term obligations, as it can be observed in Intel’s financial ratios. In practical terms, Intel cost of debt observed in 2018 will hold for the forecasted period, that is, 1.78%.
Cost of Equity (rE)
To estimate the cost of equity (rE), a pure CAPM model was used (Table 16), under the standard CAPM assumptions that investors are risk averse, investment is based on mean-variance optimization and the relevant risk is systematic. The following formula represents the computation of cost of equity:
𝑟𝐸 = 𝑟𝑓 + 𝛽 ∗ 𝑀𝑅𝑃
-Risk-free rate (rf): a long-term treasury government bond, in the same currency as Intel cash flows, and no default risk. To simplify, the 10-year US Treasury bond yield was assumed as risk-free rate with value of 1.675%.
Valuation
Source: Author
Figure 29 – Intel’s forecasted FCFF Units in million USD
Source: Author
Figure 30 – Intel’s forecasted WACC, cost of equity and cost of debt
Units in percentage Cost of capital 2019F-2023F Risk-free 1.68% Beta 1.64 ERP 5.96% Cost of equity 11.45% Cost of debt 1.78% WACC 10.75%
Table 16 – Discount rate inputs Units in percentage except
Beta
Source: Autor, Damodaran database, Bloomberg
-Beta (β): the beta value gives the exposure of the company to market risk. By definition, it must be a market value. From Damodaran database, for the semiconductor global market, a beta of 1.64 was assumed.
-Market Risk Premium (MRP): MRP is, by definition, a market value. It gives the required premium above the risk-free rate for investing in the stock, given its exposure to risk. From Damodaran database, for USA companies, a MRP of 5.96% was considered.
Aggregating all variables, the cost of equity (rE) obtained was 11.45%.
Regarding rE and rD, the forecasted values mention above are assumed to remain constant from 2019-2023, under the assumptions already stated that no
extraordinary and non-recurring events will happen that drastically change Intel’s position in the market. Variations in some of this inputs and its effects will be given more detail in the section of Investment Risks.
Considering the already stated values for cost of equity and cost of debt, adding the weights of equity and debt derived from market values (Table 17) and considering the effective tax rate also mentioned above, WACC rate of 10.75% was obtained.
Terminal Period
The terminal value of a company is the expected value of its business under the assumption that it will continue to operate and generate cash flows in the future. The terminal period FCFF was normalized, deducted from non-recurring events, and averaged with respect to the period 2019-2023. The same period was used to estimate the growth in FCFF for the terminal period. In practical terms, the growth in the future after 2023 will be generated by items in the 2019-2023 period, in particular, the ROE and the reinvestment rate. Multiplying this two last variables is obtained the value of growth (Table 18) that is expected to happen in Intel’s terminal FCFF.
Table 18 – Terminal Period growth rate inputs Units in million USD except percentage values
Source: Author
For the terminal period, the WACC rate was assumed equal to the explicit period WACC.
Finally, to discount terminal FCFF, a growing perpetuity formula was used, taking into account that this specific formula gives the discounted value for year N, using the cash flow from year N+1.
2019YE F 2020YE F 2021YE F 2022YE F 2023YE F 2019-2023 Capex $ 15,500 $ 15,725 $ 16,349 $ 16,414 $ 17,111 $ 81,099
D&A $ 10,220 $ 11,022 $ 11,937 $ 12,911 $ 13,851 $ 59,941
ΔNWC -$ 571 $ 897 -$ 970 $ 1,726 -$ 741 $ 340
EBIT $ 21,279 $ 22,953 $ 23,863 $ 23,958 $ 24,976 $ 117,029
Tax rate 12.00% 10.96% 10.96% 10.96% 10.96% 10.96%
Reinvestm ent rate 25.15% 27.40% 16.20% 24.51% 11.33% 20.63%
ROE 23.12% 23.98% 23.90% 22.88% 22.83% 23.34%
g 5.82% 6.57% 3.87% 5.61% 2.59% 4.82%
Source: Yahoo Finance, company’s annual reports
Market Value Book Value E/V 92.96% 47.9%
D/V 7.04% 52.1%