Departamento de Ciências e Tecnologias de Informação
Performance Assessment for Mountain Bike based on
WSN and Cloud Technologies
Tiago Miguel Nunes Ribeiro
A Dissertation presented in partial fulfillment of the Requirements for the Degree of Master
Engenharia de Telecomunicações e Informática
Advisor:
Doctor Octavian Postolache, Assistant Professor ISCTE-IUL
Co-Advisor:
Doctor Pedro Passos, Assistant Professor FMH-UL
Abstract
The mountain bike is one of the most used equipment’s in outdoor sports activities. The thesis describes the design and all development and implementation of Performance Assessment for Mountain Bike based on Wireless Sensor Network (WSN) and Cloud Technologies. The work presents a distributed sensing system for cycling assessment-providing data for objective evaluation of the athlete performance during training. Thus a wireless sensor network attached to the sport equipment provides to the athlete and the coach with performance values during practice. The sensors placed in biker equipment’s behave as nodes of a WSN. This is possible with the developing of IoT-based systems in sports, the tracking and monitoring of athletes in their activities has an important role on his formation as bikers and helps to increase performance, through the analyze of each session. The implemented system performs acquisition, processing and transmission, of data using a ZigBee wireless networks that provide also machine-to-machine communication and data storage in a server located in the cloud. As in many cycling applications use the phone as a module to get the values, this work will be a little different making use of phone/tablet to consult information. The information stored on the cloud server is accessed through a mobile application that analyses and correlates all metrics calculated using the training data obtained during practice. Additional information regarding the health status may be also considered. Therefore, the system permits that athletes perform an unlimited number of trainings that can be accessed at any time through the mobile application by the bikers and coach. Based on capability of the system to save a history of the evolution of each athlete during training the system permits to perform appropriate comparisons between different training sessions and different athlete’s performances.
Resumo
A bicicleta de montanha é um dos equipamentos para desportos no exterior mais usada. A tese descreve todo o desenho, desenvolvimento e implementação de Performance Assessment for Mountain Bike based on WSN and Cloud Technologies. Este apresenta um sistema de deteção distribuída para o aumento do desempenho, melhorar a metodologia da prática do ciclismo e para formação de atletas. Para tal foi desenvolvida e anexada uma rede de sensores que está embutida no equipamento do ciclista, através desta rede de sensores sem fios são obtidos os valores respetivos à interação do utilizador e a sua bicicleta, sendo estes apresentados ao treinador e ao próprio ciclista. Os sensores colocados comportam-se como nós de uma rede de sensores sem fios. Isso é possível com o desenvolvimento de sistemas baseados na Internet das coisas no desporto, a observação da movimentação e monitoramento de atletas nas suas atividades tem um papel importante na sua formação como ciclistas e ajuda a aumentar o desempenho. O sistema é baseado numa rede ZigBee sem fios, que permite a comunicação máquina-para-máquina e o armazenamento de dados num servidor localizado na nuvem. Toda a informação na nuvem pode ser acedida através de uma aplicação mobile que analisa e correlaciona todos os valores calculados usando os dados recolhidos durante o treino efetuado por cada ciclista. Como em muitas aplicações de ciclismo estas usam o telefone como um módulo para obter os valores, neste trabalho o caso é diferente fazendo o uso do telefone/tablet para apenas consultar as informações. Alguma informação sobre o ciclista é fornecida para poder efetuar alguns cálculos, relativos à saúde do ciclista, neste caso toda a energia gasta na prática de um determinado treino. Toda esta informação pode ser acedida através de uma aplicação Android e por consequência num dispositivo Android. Com a aplicação desenvolvida é possível observar e processar toda a informação recolhida através dos sensores implementados, a observação dos dados recolhidos pode ser efetuada pelo treinador responsável, como pelo próprio atleta. Portanto, o sistema permite a realização de um ilimitado número de sessões de treino, estes podem ser consultados a qualquer momento através da aplicação móvel. Fazendo com que seja possível manter um histórico da evolução de cada atleta, podendo assim observar e comparar cada sessão de treino, realizada por cada atleta.
Palavras-chave: máquina para máquina, bicicleta, nuvem, rede de sensores sem fios; Internet das Coisas;
Acknowledgments
I would first like to thanks to my advisor and co-advisor for the opportunity they gave me to do this project “Performance Assessment for Mountain bike based on WSN and Cloud Technologies”.
Firstly, I would like to express my sincere gratitude to my advisor Professor Octavian Postolache for continuous support and committed on the development of this work. Throughout the year he was always available to help under any circumstance.
I wish to express my sincere thanks to my co-advisor Professor Pedro Passos for his contributions to this work, whose opinions were very important.
To both of them I would like to thanks for the continuous support on the development of this work, for his patience, motivation, immense knowledge, and great ideas.
To Instituto de Telecomunicações on ISCTE-IUL, thanks for providing me all the material and resources I needed to implement this demanding work.
I would like to thank the members of Arduino Forum and StackOverflow communities for their invaluable assistance in many a late-night coding session.
Last but not least, I must express my very profound gratitude to my family and to my close friends for providing me with unfailing support, great moments and continuous encouragement throughout my years of study and through the process of researching and writing this thesis. This accomplishment would not have been possible without them. Thank you all.
Figures
Figure 1-1 - Internet of Things (IoT) ... 2
Figure 1-2 - Cells in a cellular network ... 15
Figure 1-3 - WSN Star topology ... 19
Figure 1-4 - WSN Tree topology ... 19
Figure 1-5 - WSN Mesh topology ... 20
Figure 1-6 - Sensor cloud infrastructure ... 21
Figure 1-7 – Cyclemeter application ... 22
Figure 1-8 - Bike Gear aplication ... 23
Figure 1-9 - Stava application ... 24
Figure 1-10 - Map My ride application ... 25
Figure 1-11 - Endomodo application ... 26
Figure 1-12 – Safety Bike struture ... 27
Figure 2-1 - System Architecture ... 30
Figure 2-2 - Representation Coordinator & End-node ... 31
Figure 2-3 - FlexiForce a201 Composition ... 32
Figure 2-4 - Force versus Conductance ... 33
Figure 2-5 - Conditioning circuit for force sensors ... 33
Figure 2-6 – Characteristic of the sensor ... 35
Figure 2-7 - MinIMU-9 v3 Gyro, Accelerometer, and Compass ... 35
Figure 2-8 - IMU schematic ... 36
Figure 2-9 - Representation IMU axis... 37
Figure 2-10 - Sensor RFID-RC522 ... 40
Figure 2-11 - Adafruit Ultimate GPS Logger Shield ... 41
Figure 2-12 - GPS module GlobalTop PA6H ... 41
Figure 2-13 - Arduino Fio Schematic ... 42
Figure 2-14 - Hand end-node ... 43
Figure 2-15 - Feet end-node ... 43
Figure 2-16 - Body and Bicycle end-node ... 43
Figure 2-17 - Arduino Fio Force Sensors Gloves Schematic representation ... 44
Figure 2-18 - AHRS System designed by Pololu ... 45
Figure 2-19 - Arduino Fio IMU Schematic representation ... 46
Figure 2-20 - Arduino Mega Schematic ... 46
Figure 2-21 - Coordinator schematic representation ... 47
Figure 2-22 - Yun Shield ... 48
Figure 2-23 - Representation of SPI protocol ... 49
Figure 3-1 Vector measured in the frame of reference of the plane to the frame of reference of the ground ... 53
Figure 3-2 - Direct Cosine Matrix Algorithm Overview ... 54
Figure 3-3 - Representation of communication between coordinator and server ... 57
Figure 3-4 - WSN topology used ... 58
Figure 3-5 –Principal configurations ... 58
Figure 5-1 - Configuration Android Studio... 66
Figure 5-2 - Sequence diagram Coach interaction ... 67
Figure 5-3 - Sequence diagram Biker interaction ... 67
Figure 5-4 - Login view ... 68
Figure 6-1 - Force sensors gloves initial assembly ... 74
Figure 6-2 - Force sensors gloves finally assembly ... 74
Figure 6-3 - Coordinator assembly ... 75
Figure 6-4 - Finnaly Assembly Gloves Sensors ... 76
Figure 6-5 - Finally assembly shoes sensors ... 76
Figure 6-6 - Finally assembly coordinator ... 76
Figure 6-7 – Application GPS analyze ... 77
Figure 6-8 - Application velocity analyze ... 78
Figure 6-9 - Application altitude analyze ... 78
Figure 6-10 - Application analyze gloves sensors (Force) ... 79
Figure 6-11 - Application analyze gloves sensors (% usage) ... 79
Figure 6-12 - Application analyze shoes sensors (Force) ... 80
Figure 6-13 - Application analyze shoes sensors (% usage) ... 80
Tables
Table 1 - Arduino compare board specs ... 4Table 2 - BeagleBone compare board specs ... 5
Table 3 - Raspberry Pi compare board specs (part. 1) ... 6
Table 4 - Raspberry Pi compare board specs (part. 2) ... 7
Table 5 - Raspberry Pi compare board specs (part. 3) ... 8
Table 6 - Raspberry Pi compare board specs (part. 4) ... 9
Table 7 - General advantages and disadvantages of different sensor technologies (part.1) .... 10
Table 8 - General advantages and disadvantages of different sensor technologies (part.2) .... 11
Table 9 - IMU configurations DOF ... 12
Table 10 - LAN Technology Specifications ... 13
Table 11 - Wireless Protocols ... 14
Table 12 - Cellular Technologies (part.1) ... 15
Table 13 - Cellular Technologies (part.2) ... 16
Table 14 - ZigBee, Bluetooth, and Wi-Fi characteristics ... 18
List of Acronyms
2G 2nd Generation
3G 3rd Generation
4G 4th Generation
AHRS Altitude and Heading Reference System
AP Access Point
API Application Programming Interface ATM Asynchronous Transfer Mode CPU Central Processing Unit
CSMA/CD Carrier sense multiple access with collision detection
DB Data base
DDR2 Double Data Rate 2
DDR3 Double Data Rate 3
DOF Degree Of Freedom
DSSS Direct Sequence Spread Spectrum
EDGE Enhanced Data Rates for GSM Evolution
EEPROM Electrically-Erasable Programmable Read-Only Memory FDDI Fiber Distributed Data Interface
FFD Full-function device
FHSS Frequency-Hopping Spread Spectrum
FSR Force Sensitive Resistor
FTDI Future Technology Devices International
G 2.5 Generation
GPIO General-purpose input/output GPRS General Packet Radio Service GPS Global Positioning System GPU Graphics Processing Unit
GSM Global System for Mobile Communications HDMI High-Definition Multimedia Interface
HF High Frequency
HSPA High Speed Packet Access
HTTP HyperText Transfer Protocol I2C Inter-Integrated Circuit
I2S Integrated Interchip Sound
ICSP In Circuit Serial Programming
IEEE Institute of Electrical and Electronics Engineers IMU Inertial Measurement Unit
IoT Internet of Things
LAMP Linux, Apache, MySQL and PHP
LAN Local Area Network
LCD Liquid-crystal Display LET Long-term Evolution
LF Low Frequency
M2M Machine-to-Machine
OFDM Orthogonal frequency-division multiplexing ORD Object-relational Database
PCB Printed Circuit Board PHP Hypertext Preprocessor PWM Pulse-Width Modulation
RAM Random Access Memory
RF Radio Frequency
RFD Reduced-function device RFID Radio-frequency identification RMR Resting Metabolic Rate
SCL Serial Clock Line SD card Secure Digital Card SDA Serial Data Line
SDRAM Synchronous Dynamic Random Access Memory
SoC System on Chip
SPI Serial Peripheral Interface SQL Structured Query Language
SRAM Static Random Access Memory
SSH Secure Shell
TIFF Time-to-First-Fix
UART Universal Asynchronous Receiver/Transmitter UHF Ultra High Frequency
UMTS Universal Mobile Telecomunications System USB Universal Serial Bus
VHF Very High Frequency
WAN Wide Area Network
WAP Wireless Application Protocol WEP Wired Equivalent Privacy
WLAN Wireless Local Area Network
WPAN Wireless Personal Area Network WSN Wireless Sensor Network
Contents
Abstract ... i Resumo ... ii Acknowledgments ... iii Figures ... iv Tables ... v List of Acronyms ... vi Contents ... viii Chapter 1 - Introduction ... 11. Motivation and Overview ... 1
1.1. Internet of Things (IoT) ... 2
1.2. State of art ... 3
1.2.1. Embedded Systems ... 3
1.2.2. The Arduino Family ... 3
1.2.3. The BeagleBone Family ... 5
1.2.4. The Raspberry Pi Family ... 5
1.2.5. Tactile Sensing Technologies ... 9
1.2.6. Inertial Measurement Unit ... 12
1.2.7. Communications ... 12
1.2.8. Machine-to-Machine (M2M) ... 16
1.2.9. Wireless Sensor Network ... 17
1.2.10. Joining M2M communication, WSN and Cloud ... 20
1.2.11. Mobile Applications ... 21
1.2.12. Mountain Bike ... 26
1.3. Objectives ... 28
1.4. Related Work ... 29
1.5. Methods of Analyze ... 29
Chapter 2 - System Description ... 30
2. Overview ... 30
2.1. Hardware Components... 31
2.1.1. Force Sensors ... 31
2.1.2. Inertial Measurement Unit ... 35
2.1.3. Radio Frequency Identification ... 37
2.1.4. GPS ... 40
2.1.5. Arduino Fio ... 41
2.1.6. Arduino Mega 2560 ... 46
Chapter 3 - Embedded Software ... 52
3. Arduino Fio IMU Sensor ... 52
3.1. Data Communications ... 56
3.2. ZigBee ... 57
3.3. Communication M2M ... 58
3.4. Wireless ... 59
4.1. Database ... 61
4.2. PHP Modules ... 63
Chapter 5 - Application ... 66
5. Mobile Application ... 66
5.1. Sequence Diagram ... 66
5.1.1. Coach Sequence Diagram ... 67
5.1.2. Biker Sequence Diagram... 67
5.2. Main Features ... 73
Chapter 6 Results and Evaluation ... 74
6. Evaluation ... 74 6.1. Results ... 77 Chapter 7 - Conclusions ... 82 6.2. Contributions ... 83 6.3. Future Work ... 83 References ... 84 Appendix A ... 92 Appendix B ... 100 Appendix C ... 110
Chapter 1 - Introduction
1.
Motivation and Overview
The history of bicycle remote us to the year of 1418 where the engineer Giovanni Fontana built a four wheeled “bike” with rope connected by gears. Only 400 years later, in response to the starvation and the slaughtering of horses Baron Von Drais built the first two wheeled bike that has a cord connected to the back wheel. These velocipedes were made entirely of wood and needed to be balanced by directing the front wheel a bit. People then did not dare to lift the feet off safe ground, therefore the velocipedes were propelled by pushing off the feet. Only in 1890 appeared a bicycle which had the name “Safety Bike” with the same design and concept that we can see nowadays (same-size wheels, pedals, gears and bike saddle) (Mozer, 2016). The years passed and the innovations were many, as the pedals, brakes, suspension and the lighter and comfortable materials that we see today in our bikes. Nowadays bicycles can be classified in four types: urban bike, BMX, road bikes and mountain bikes (Sanches, 2015). For the conception of this work will be used a mountain bike, these bicycles are typically used in single tracks where the terrains can be unpaved. Like in many sports the choice is immense in terms of materials that the bicycles are made and to get the best performance, normally the athletes choose the best that fits to his needs (considering the tracks and is own physical performance) ("Bikes | Trek Bikes", 2016). Because on these tracks commonly we could encounter rocks, loose gravel, roots and step grades inclines and declines. Under these conditions the biker will need to get a functional interaction with his “machine”, in order to achieve a balance between speed and safety. The mountain bike is produced to handle with this type of tracks, normally the material that is widely used is aluminum or carbon fiber (offers a lighter stiffer and efficient ride) ("Understanding Bike Frame Materials - REI Expert Advice", 2016). The modern and the most common frame design for an upright bicycle is based on the “safety bike”, and consists of two triangles, a main triangle and a paired rear triangle. To control the bicycle along the track the biker needs to use the mechanisms with his hands (e.g., brakes) and feet (e.g., pedals), and the positioning of his body is also fundamental. A functional position will permit the biker make rapid changes of direction and get the desirable speed. The biker position could be essential to deal with some external factors such as the slope of the track and its obstacles. It is the interactive behavior of the
designed and implemented. These WSN permits to get values to some of the following variables: i) braking intensity and frequency (both hands); ii) pedal strength (both feets); iii) position of bicycle in the three plans of motion (x, y and z); iv) position of biker in the three plans of motion. With this set of variables, it was possible to calculate some important aspects to describe the bicycle ~ biker interaction.
For the athletes the training is the most important way to achieve a better performance whether professional or recreational level. In this era of the Internet of Things (IoT), where vehicles, buildings and a lot of another’s things are characterized by sensors, software and network connectivity that enable the data collection and data exchange remotely across existing network. This developed system will allow the users to obtain data from his own training session. The acquired data with this sensors network, can be analyzed and adapt the training methods and improve the performance.
1.1. Internet of Things (IoT)
Internet of Things (IoT) is an environment in which objects, animals or people are provided with unique identifiers and the ability to transfer data over a network without requiring human interaction. IoT evolved through the convergence of wireless technologies, micro-electromechanical systems (MEMS) and the internet.
In the term Internet of things, a thing can be (fig. 1-1), a person with a heart monitor implant, an animal in a farm with a biochip transponder (like the same the vet put in our pets), or a object (sensor) in our car ("What is Internet of Things (IoT) | Engineers Gallery| Technology", 2015), (Stočes, Vaněk, Masner, & Pavlík, 2016).
1.2. State of art
On the market many applications about cycling are produced and sent to market by companies or by individual developers, they have in common two aspects they use the phone and all information about the training it is obtained from the position of the phone. They don’t have information about the aspects of the biker and his bicycle. So the innovation purposed in this work is to create WSN to capture some data about the interaction of the biker and his bicycle. Some work in this research field was performed in time and the prototype with limited characteristics was developed. (Barreiro, Postolache, & Passos, 2014).
1.2.1. Embedded Systems
An embedded system is an engineering artifact involving computation that is subject to physical constraints. The physical constraints arise through two kinds of interactions of computational processes with the physical world: (1) reaction to a physical environment, and (2) execution on a physical platform. Accordingly, the two types of physical constraints are reaction constraints and execution constraints (Henzinger & Sifakis, 2006).
So an embedded system is a combination of computer hardware and software, either fixed in capability or programmable, that is specifically designed for a particular function. In our days there are a huge number of hardware that support software and can act as embedded system. Below are presented some examples of embedded systems studied and created:
Towards a Real-Time Embedded System for Water Monitoring Installed in a Robotic Sailboat (Goncalves, Thomaz, Sa, & Henrique, 2016).
Network camera with FPGA technology (Guedes, Neto, & Véstias, 2007)
Design and construction of an embedded real-time system based on Linux (Campos, Fonseca, & Lopes, 2011).
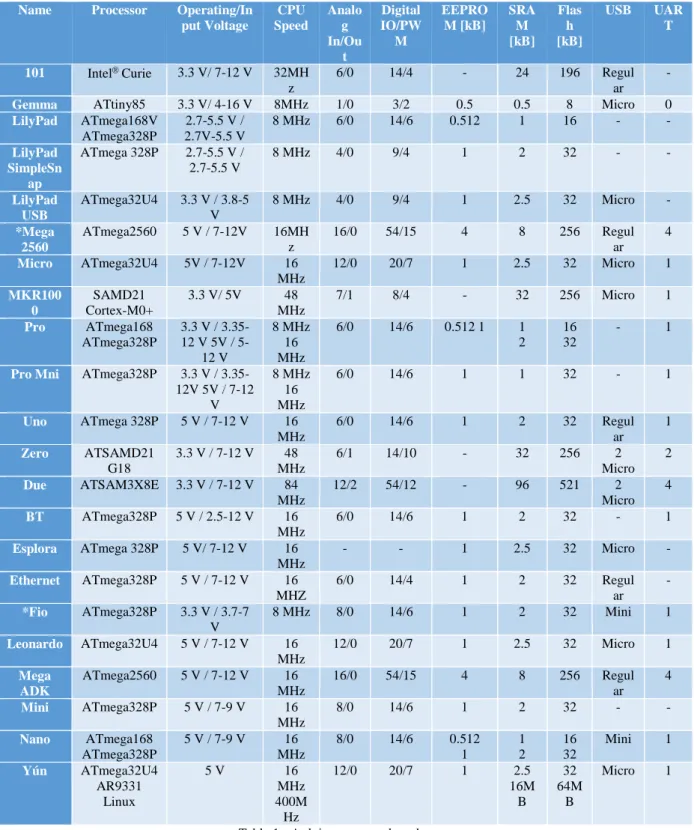
1.2.2. The Arduino Family
Arduino makes several different boards, each with different capabilities, is an open-source platform used for building electronics projects. Arduino consists of both a physical programmable circuit board referred as microcontroller.
hardware consists of an open hardware design with Atmel AVR processor ("What is an Arduino? - learn.sparkfun.com", 2016). Boards can be purchased preassembled, but hardware design information is also available for those willing to build or modify them. Several third-party makers have produced Shields (add-on boards) that are able to extend the basic capabilities of an Arduino. Among these shields, it is worth mentioning the XBee shield allows multiple Arduino boards to communicate wirelessly (Bell, 2013).
Name Processor Operating/In put Voltage CPU Speed Analo g In/Ou t Digital IO/PW M EEPRO M [kB] SRA M [kB] Flas h [kB] USB UAR T 101 Intel Curie 3.3 V/ 7-12 V 32MH z 6/0 14/4 - 24 196 Regul ar -
Gemma ATtiny85 3.3 V/ 4-16 V 8MHz 1/0 3/2 0.5 0.5 8 Micro 0
LilyPad ATmega168V ATmega328P 2.7-5.5 V / 2.7V-5.5 V 8 MHz 6/0 14/6 0.512 1 16 - - LilyPad SimpleSn ap ATmega 328P 2.7-5.5 V / 2.7-5.5 V 8 MHz 4/0 9/4 1 2 32 - - LilyPad USB ATmega32U4 3.3 V / 3.8-5 V 8 MHz 4/0 9/4 1 2.5 32 Micro - *Mega 2560 ATmega2560 5 V / 7-12V 16MH z 16/0 54/15 4 8 256 Regul ar 4 Micro ATmega32U4 5V / 7-12V 16 MHz 12/0 20/7 1 2.5 32 Micro 1 MKR100 0 SAMD21 Cortex-M0+ 3.3 V/ 5V 48 MHz 7/1 8/4 - 32 256 Micro 1 Pro ATmega168 ATmega328P 3.3 V / 3.312 V 5V / 5-12 V 8 MHz 16 MHz 6/0 14/6 0.512 1 1 2 16 32 - 1
Pro Mni ATmega328P 3.3 V / 3.35-12V 5V / 7-12 V 8 MHz 16 MHz 6/0 14/6 1 1 32 - 1 Uno ATmega 328P 5 V / 7-12 V 16 MHz 6/0 14/6 1 2 32 Regul ar 1 Zero ATSAMD21 G18 3.3 V / 7-12 V 48 MHz 6/1 14/10 - 32 256 2 Micro 2 Due ATSAM3X8E 3.3 V / 7-12 V 84 MHz 12/2 54/12 - 96 521 2 Micro 4 BT ATmega328P 5 V / 2.5-12 V 16 MHz 6/0 14/6 1 2 32 - 1 Esplora ATmega 328P 5 V/ 7-12 V 16 MHz - - 1 2.5 32 Micro - Ethernet ATmega328P 5 V / 7-12 V 16 MHZ 6/0 14/4 1 2 32 Regul ar - *Fio ATmega328P 3.3 V / 3.7-7 V 8 MHz 8/0 14/6 1 2 32 Mini 1 Leonardo ATmega32U4 5 V / 7-12 V 16 MHz 12/0 20/7 1 2.5 32 Micro 1 Mega ADK ATmega2560 5 V / 7-12 V 16 MHz 16/0 54/15 4 8 256 Regul ar 4 Mini ATmega328P 5 V / 7-9 V 16 MHz 8/0 14/6 1 2 32 - - Nano ATmega168 ATmega328P 5 V / 7-9 V 16 MHz 8/0 14/6 0.512 1 1 2 16 32 Mini 1 Yún ATmega32U4 AR9331 Linux 5 V 16 MHz 400M Hz 12/0 20/7 1 2.5 16M B 32 64M B Micro 1
1.2.3. The BeagleBone Family
The Beagle boards are open-hardware, open-software computers. The BeagleBone is one of the best tools to use to discover embedded programming and electronics. It’s a good way to see and understand more closely how a computer works (Santos & Perestrelo, 2015). The BeagleBone is a compact, low-cost, open-source Linux computing platform that can be used to build complex applications that interface high-level software and low-level electronic circuits. BeagleBone runs the Linux operating system, which means that is possible use many open-source software libraries and applications directly. This platform is formed by the integration of a high-performance microprocessor on a printed circuit board (PCB) and an extensive software ecosystem (Molloy, 2015).
BeagleBoard.org BeagleBone Black BeagleBoard.org BeagleBone (original) SeedStudio BeagleBone Green SanCloud BeagleBone Enhanced Processor AM3358 ARM
Cortex-A8 AM3358 ARM Cortex-A8 AM3358 ARM Cortex-A8 AM3358 ARM Cortex-A8 Maximum Processor Speed 1GHz 720MHz (1GHz on latest) 1GHz 1GHz Analog Pins 7 7 7 7 Digital Pins 65 (3.3V) 65 (3.3V) 65 (3.3V) 65 (3.3V) Memory 512MB DDR3 (800MHz x 16), 2GB (4GB on Rev C) onboard storage using eMMC, microSD card
slot
256MB DDR2 (400MHz x 16), microSD card slot
512MB DDR3 (800MHz x 16), 4GB
on-board storage using eMMC, microSD card slot
1GB DDR3 (800MHz x 16), storage using eMMC,
microSD card slot
USB miniUSB 2.0 client port, USB 2.0 host
port
miniUSB 2.0 client port, USB 2.0 host
port
microUSB 2.0 client port, USB 2.0 host
port
miniUSB 2.0 client port, 4 USB 2.0 Ports (2 A-type connectors, 2 on pin headers)
Video microHDMI, cape add-ons
cape add-ons Cape add-ons microHDMI, cape add-ons
Audio microHDMI, cape add-ons
Cape add-ons Cape add-ons microHDMI, cape add-ons Supported Interfaces 4x UART, 8x PWM, LCD, GPMC, MMC1, 2x SPI, 2x I2C, A/D Converter, 2xCAN Bus, 4 Timers 4x UART, 8x PWM, LCD, GPMC, MMC1, 2x SPI, 2x I2C, A/D Converter, 2xCAN Bus, 4 Timers, FTDI USB to Serial, JTAG
via USB 4x UART, 8x PWM, LCD, GPMC, MMC1, 2x SPI, 2x I2C, A/D Converter, 2xCAN Bus, 4 Timers, 2 Grove (I2C, UART) 4x UART, 8x PWM, LCD, GPMC, MMC1, 2x SPI, 2x I2C, A/D Converter, 2xCAN Bus, 4 Timers
Sensors n/a n/a n/a Barometer,
Accelerometer, Gyro, Temperature Table 2 - BeagleBone compare board specs
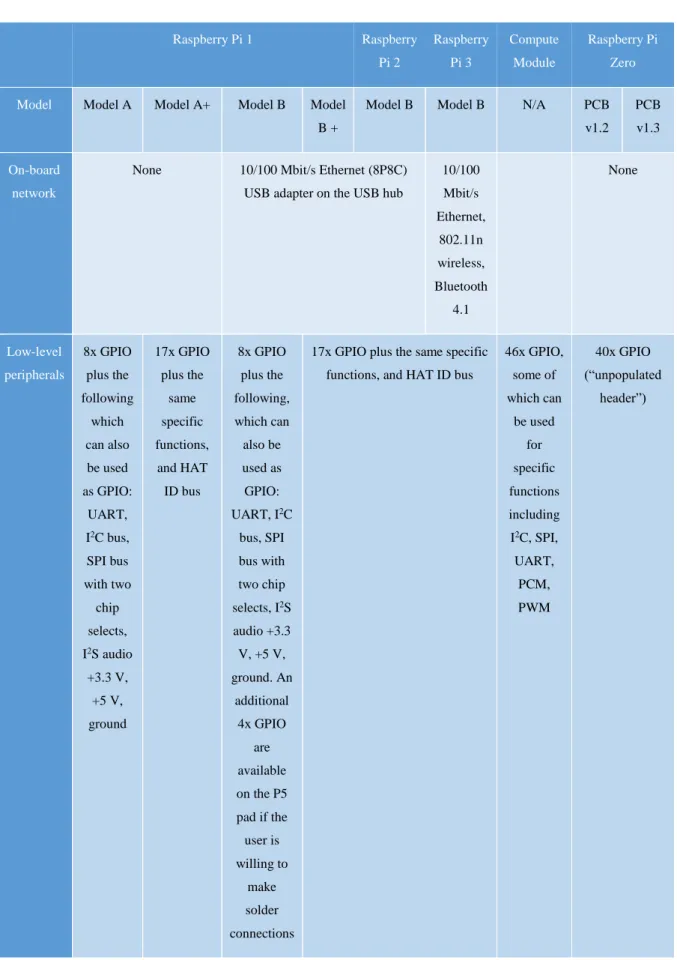
1.2.4. The Raspberry Pi Family
The Raspberry Pi is a credit card sized single-board computer developed in the UK by the Raspberry Pi Foundation with the intention of stimulating the teaching of basic computer
on chip (SoC), which includes an ARM1176JZF-S 700 MHz processor, VideoCore IV GPU, and was originally shipped with 256 megabytes of RAM, later upgraded to 512 MB and on the present the boards already have 1024 MB. It does not include a built-in hard disk or solid-state drive, but uses an SD card for booting and persistent storage.
Raspberry Pi 1 Raspberry Pi 2 Raspberry Pi 3 Compute Module Raspberry Pi Zero
Model Model A Model A+ Model B Model B +
Model B Model B N/A PCB v1.2
PCB v1.3
Architecture ARMv6 (32 bit) ARMv7
(32-bit)
ARMv8
(64/32-bit)
ARMv6 (32-bit)
SoC Broadcom BCM2835 Broadcom
BCM2836
Broadcom BCM2837
Broadcom BCM2835
CPU 700 MHz single-core ARM1176JZF-S 900MHz 32-bit quad-core ARM Cortex-A7 1.2 GHz 64-bit quad-core ARM Cortex-A53 700 MHz single-core ARM1176JZF-S 1 GHz ARM1176JZF-S single-core
GPU Broadcom VideoCore IV @ 250 MHz (BCM2837: 3D part of GPU @ 300MHz, video part of GPU @ 400
MHz)
OpenGL ES 2.0 (BCM2835, BCM2836: 24 GFLOPS / BCM2837: 28.8 GFLOPS)
Memory (SDRAM)
256MB 512 MB (shared with GPU). Older boards had 256MB (shared
with GPU)
1 GB (shared with GPU)
512 MB (shared with GPU)
USB 2.0 ports 1 (direct from BCM2835 chip) 2 (via the on-board 3-port USB hub)
4 (via the on-board 5-port USB hub) 1 (direct from BCM2835 chip) 1 Micro-USB (direct from BCM2835 chip) Table 3 - Raspberry Pi compare board specs (part. 1)
Raspberry Pi 1 Raspberry Pi 2 Raspberry Pi 3 Compute Module Raspberry Pi Zero
Model Model A Model A+ Model B Model B +
Model B Model B N/A PCB v1.2
PCB v1.3
Video Input
15-pin MIPI camera interface (CSI) connector, used with the Raspberry Pi camera or Raspberry Pi NoIR camera
2x MIPI camera interface (CSI) None MIPI camera interface (CSI) (rev 1.3) Video Output HDMI (rev 1.3) composite video (RCA jack) HDMI (rev 1.3), composite video (3.5 mm TRRS jack) HDMI (rev 1.3), composite video (RCA jack)
HDMI (rev 1.3), composite video (3.5 mm TRRS jack) HDMI, 2x MIPI display interface (DSI) for raw LCD panels, composite video Mini-HDMI, 1080p60, composite video via GPIO Audio inputs
As of revision 2 boards via I2S
Audio outputs
Analog via 3.5 mm phone jack; digital via HDMI and, as of revision 2 boards, I2S Analog, HDMI, I2S Mini-HDMI, stereo audio through PWM on GPIO On-board storage SD, MMC, SDIO card slot (3.3 V with card power only) MicroSDHC slot SD, MMC, SDIO card slot MicroSDHC slot 4 GB eMMC flash memory chip MicroSDHC
Raspberry Pi 1 Raspberry Pi 2 Raspberry Pi 3 Compute Module Raspberry Pi Zero
Model Model A Model A+ Model B Model B +
Model B Model B N/A PCB v1.2
PCB v1.3
On-board network
None 10/100 Mbit/s Ethernet (8P8C) USB adapter on the USB hub
10/100 Mbit/s Ethernet, 802.11n wireless, Bluetooth 4.1 None Low-level peripherals 8x GPIO plus the following which can also be used as GPIO: UART, I2C bus, SPI bus with two chip selects, I2S audio +3.3 V, +5 V, ground 17x GPIO plus the same specific functions, and HAT ID bus 8x GPIO plus the following, which can also be used as GPIO: UART, I2C bus, SPI bus with two chip selects, I2S audio +3.3 V, +5 V, ground. An additional 4x GPIO are available on the P5 pad if the user is willing to make solder connections
17x GPIO plus the same specific functions, and HAT ID bus
46x GPIO, some of which can be used for specific functions including I2C, SPI, UART, PCM, PWM 40x GPIO (“unpopulated header”)
Raspberry Pi 1 Raspberry Pi 2 Raspberry Pi 3 Compute Module Raspberry Pi Zero
Model Model A Model A+ Model B Model B +
Model B Model B N/A PCB v1.2 PCB v1.3 Power Ratings 300mA (1.5 W) 200 mA (1 W) 700 mA (3.5 W) 600 mA (3.0 W) 800 mA (4.0 W) 200 mA (1 W) ~160 mA (0.8 W) Power Source
5 V via MicroUSB or GPIO header
Table 6 - Raspberry Pi compare board specs (part. 4)
1.2.5. Tactile Sensing Technologies
The “sense of touch” in humans comprises two main sub modalities: cutaneous and kinesthetic (neural inputs). Cutaneous sense receives sensory inputs from the receptors embedded in the skin and kinesthetic sense receives sensory inputs from the receptors located in muscles, tendons and joints. Cutaneous system involves physical contact with the stimulation and provides the awareness of the stimulation of the outer surface of body by means and receptors in the skin associated somatosensory area of central nervous system. The kinesthetic system provides humans information about the static and dynamic body posture on the basis of afferent information originating from the muscles, joints and skin. Human tactile sensing has generally served as a reference point for tactile sensing in robotics. Even though human tactile sensing has been a reference point for robotic tactile sensing, the way tactile sensing is defined in robotics falls short of what it means in humans. Most of the times, the robotic tactile sensing has been associated with the detection and measurement of forces in a predetermined area only. The tactile or cutaneous sensing is associated with the detection and measurement of contact parameters, which can be mechanical stimulation (force, stress, roughness etc.), temperature, moistness etc. The definition of a pressure sensor by Lee et al. (Almassri et al., 2014) is a device that measures a physical quantity and converts it into a signal which can be read by an observer or an instrumented. There are various types of sensors: thermal sensor, electromagnetic sensor, pressure sensor, mechanical sensor and others. In the case of pressure is sensed by mechanical elements such as plates, shells, and tubes that are designed and constructed to deflect when pressure is applied (Fässler, 2010).
Technology Type Advantages Disadvantages
Mechanical Whisker / Antenna Simple; Robust; Can measure touch location
Bad spatial resolution: Can not measure force
Mechanical displacement Simple; Robust; Inexpensive Limited spatial resolution
Pneumatic touch sensor / Foil switches
Simple; Robust; Can measure touch location; Inexpensive
Can not measure force
Digital tactile sensor array No analog to digital conversion Prone to damage
Capacitive Good sensitivity; Moderate
hysteresis; Wide dynamic range; Linear response; Robust
Complex circuitry; Susceptible to noise; Limited
spatial resolution; some dielectrics are temperature
sensitive
Strain Gauges Metal Strain Gauges More robust than semiconductor strain gauges
Temperature dependence; Small k-factor compared to semiconductor strain gauges
Semiconductor strain gauge Very linear response; Low hysteresis; Low creep; Large
k-factor
Vulnerable to overload; Can not be shaped; Temperature
dependence
Piezoresistive Conductive elastomers Shapeable; Good gripping surface Creep; Memory; Hysteresis; Temperature dependence
Carbon felt and Carbon fibers
Shapeable; Withstand very high temperatures; Withstand high
overloads
Sensor noise at low loads; Not suited for miniature
sensors
Piezoelectric Wide dynamic range; Durability; Good mechanical material
properties
Fragility of electrical junctions; Inherently dynamic; Good solutions are
complex; Difficulty of separating pyroelectric /
piezoelectric effects Table 7 - General advantages and disadvantages of different sensor technologies (part.1)
Technology Type Advantages Disadvantages
Pyroelectric Wide dynamic range; Durability; Good mechanical material
properties
Inherently dynamic; Good solutions are complex; Difficulty of separating pyroelectric / piezoelectric
effects
Optical Frustrated internal reflection
Shapeable; Very high resolution tactile images
Bulky; Complex construction
Opto-mechanical Good repeatability Creep; Memory; Hysteresis; Temperature dependence
Fiber-optic Lower noise than the above; Flexible
Complex construction
Photoelasticity Good results in terms of linearity, Hysteresis, Creep and memory
Complicated optic system; Not shapeable
Tracking of optical markers No interconnects to break Requires PV for computing applied forces; Hard to
customize
Magnetic Hall effect Wide dynamic range; Low hysteresis; Linear response; Robust
Measure field in only 1 direction
Magnetoelastic Simpler then hall effect; Measures field in 2 directions; Wide dynamic
range; Low hysteresis; Linear response; Robust
Susceptibility to stray fields and noise
Ultrasonic Wide dynamic range; Good spatial resolution
Can not measure when touching material has similar
acoustic impedance as skin material
Electrochemical No steady state response; Bad
spatial resolution; Low sensitivity Table 8 - General advantages and disadvantages of different sensor technologies (part.2)
1.2.6. Inertial Measurement Unit
An Inertial measurement unit, or IMU, is the main component of inertial guidance systems used in air space, and watercraft, including guided missiles. An IMU works by sensing motion including the type, rate, and direction of that motion using a combination of accelerometers and gyroscopes. Accelerometers are placed such that their measuring axes are orthogonal to each other. An IMU works by detecting the current rate of acceleration, as well as it changes in rotational attributes, including pitch, roll and yaw (Hazry, Sofian, & Azfar, 2009), ("A Guide To using IMU (Accelerometer and Gyroscope Devices) in Embedded Applications. « Starlino Electronics", 2009), (Woodman, 2007).
IMUs available in the market now are in various types and shape. The IMU can be selected from its degrees of freedom (DOF). Actually is possible encounter boards with three, six, nine and ten DOF. For three DOF, sensors configurations are two accelerometers and a gyroscope that measures yaw. For six DOF, all axes for accelerometer and gyroscope for measurement are available (pitch and roll). For nine DOF, all axes are measure for accelerometer, gyroscope and magnetometer (pitch, roll and yaw). For ten DOF, all axes for accelerometer and gyroscope for measurement are available (pitch, roll and yaw), but the IMU have a barometer too (Performance, n.d.).
Degrees of Freedom Function
3 DOF Accel/gyro
6 DOF Accel/gyro
9 DOF Accel/gyro/magn
10 DOF Accel/gyro/magn/baro
Table 9 - IMU configurations DOF
1.2.7. Communications
A Computer network is a collection of computers and devices interconnected by communications channels that facilitate communications and allows sharing of resources and information among interconnected devices. Networks may be classified according to a wide variety of characteristics such as medium used to transport data.
Types of Networks
Wide Area Networks (WANs)
Wireless Local Area Networks (WLANs)
Ethernet is the most popular physical layer LAN technology in use today. It defines the number of conductors that are required for a connection, the performance is an important point on networks because the data transmission and communication needs to be always operational. A standard Ethernet network can transmit data at a rate up to 10 Megabits per second (10 Mbps). Other LAN types include Token Ring, Fast Ethernet, Gigabit Ethernet, Fiber Distributed Data Interface (FDDI), Asynchronous Transfer Mode (ATM) and LocalTalk. Ethernet is popular because it strikes a good balance between speed, cost and ease of installation.
Name IEEE
Standard Data Rate Media Type Maximum Distance
Ethernet 802.3 10 Mbps 10Base-T 100 meters
Fast Ethernet/ 100Base-T 802.3u 100 Mbps 100Base-TX 100 meters 100Base-FX 2000 meters Gigabit Ethernet/ GigE 802.3z 1000 Mbps 1000Base-T 100 meters 1000Base-SX 275/550 meters 1000Base-LX 550/5000 meters 10 Gigabit Ethernet IEEE 802.3ae 10 Gbps 10GBase-SR 300 meters 10GBase-LX4 300m MMF/ 10km SMF 10GBase-LR/ER 10km/40km 10GBase-SW/LW/EW 300m/10km/40km Table 10 - LAN Technology Specifications
Token Ring is another form of network configuration. It differs from Ethernet in that all messages are transferred in one direction along the ring at all times. Token Ring networks sequentially pass a “token” to each connected device. When the token arrives at a particular computer or device, the recipient is allowed to transmit data onto the network. Since only one
Wireless LANs, or WLANs, use radio frequency (RF) technology to transmit and receive data over the air. WLANs give users mobility as they allow connection to a local area network without having to be physically connected by a cable. With mobility, WLANs give flexibility and increase productivity, appealing to both entrepreneurs and to home users. The Institute for Electrical and Electronic Engineers (IEEE) developed the 802.11 ("Performance of Wireless Networks: WiFi - High Performance Browser Networking (O'Reilly)", 2016) specification for wireless LAN technology. 802.11 specifies over-the-air interface between a wireless client and a base station. WLAN 802.11 standards also have security protocols (Wired Equivalent Privacy - WEP and Wi-Fi Protected Access - WPA) that were developed to provide the same level of security as that of a wired LAN (“Ethernet Tutorial - Part I: Networking Basics | Lantronix", 2016).
Specification Data Rate Modulation Scheme Security
802.11 1 or 2 Mbps in the 2.4 GHz band
FHSS, DSSS WEP and WPA
802.11a 54 Mbps in the 5 GHz band OFDM WEP and WPA
802.11b/High Rate/Wi-Fi 11 Mbps (with a fallback to 5.5, 2, and 1 Mbps) in the
2.4 GHz band
DSSS with CCK WEP and WPA
802.11g/Wi-Fi 54 Mbps in the 2.4 GHz band
OFDM when above 20Mbps, DSSS with CCK
when below 20Mbps
WEP and WPA
Table 11 - Wireless Protocols
In terms of the cellular networks, the data is transmitted not to a central hub in a small network of devices (as it is with Wi-Fi) or even directly from device to device (as it with Bluetooth), but through a global network of transmitters and receivers. A typical cellular network can be envisioned as a mesh of hexagonal cells, as shown in fig. 1-2, each with its own base station at the center. The cells slightly overlap at the edges to ensure that users always remain within range of a base station (Miller, 2013).
Figure 1-2 - Cells in a cellular network
The base station at the center of each group of cells functions as the hub for those cells not of the entire network, but of that individual piece of the network. RF signals are transmitted by an individual phone and received by the base station, where they are then re-transmitted from the base station to another mobile phone. Transmitting and receiving are done over two slightly frequencies. Base stations are connected to one another via central switching centers which track calls and transfer them from one base station to another as callers move between cells; the handover is (ideally) seamless and unnoticeable. Each base station is also connected to the main telephone network, and can thus relay mobile calls to landline phones (Pearson, 2011), (Pereira & Sousa, 2004), (Akyildiz, Gutierrez-Estevez, & Reyes, 2010), (Jary, 2014).
Symbol Standard Full Name Maximum
Download Speed (Theoretical)
Maximum Upload Speed (Theoretical)
2G GSM Global System for Mobile Communications
14.4 Kbits/s 14.4 Kbits/s
G GPRS General Packet Radio Service 53.6 Kbits/s 28.8 Kbits/s
E EDGE Enhanced Data rates for GSM Evolution
271.6 Kbits/s 108.8 Kbits/s
3G UMTS Universal Mobile Telecommunications System
384 Kbits/s 128 Kbits/s
H HSPA High-Speed Packet Access 7.2 Mbits/s 3.6 Mbits/s
Symbol Standard Full Name Maximum Download Speed
(Theoretical)
Maximum Upload Speed (Theoretical)
H+ HSPA+ Evolved High-Speed Packet Access – Release 6
14.4 Mbits/s 5.76 Mbits/s
H+ HSPA+ Evolved High-Speed Packet Access – Release 7
21.1 Mbits/s or 28 Mbits/s
11.5 Mbits/s
H+ HSPA+ Evolved High-Speed Packet Access – Release 8
42.2 Mbits/s 11.5 Mbits/s
H+ HSPA+ Evolved High-Speed Packet Access – Release 9
84.4 Mbits/s 11.5 Mbits/s
H+ HSPA+ Evolved High-Speed Packet Access – Release 10
168.8 Mbits/s 23 Mbits/s
4G LTE Long Term Evolution 100 Mbits/s 50 Mbits/s
4G LTE-A Long Term Evolution - Advanced
1 Gbits/s 500 Mbits/s
Table 13 - Cellular Technologies (part.2)
1.2.8. Machine-to-Machine (M2M)
The term M2M communication describes devices that are connected to the Internet, using a variety of fixed and wireless networks and communicate with each other and the wider world. The term is slightly erroneous through as it seems to assume there is no human in the equation, which quite often there is in one way or another (Oecd, 2012). So M2M communications is an emerging technology that envisions the interconnection of machines without the need of human interventions. The main concept lies in seamlessly connecting an autonomous and self-organizing network, of M2M-capable devices to a remote client, through wired or wireless network. The M2M is a combination of various heterogeneous electronic communication, and software technologies. An software application is usually employed at the remote client to process the collect data and provide the end user with a set of smart services and a practical interface. The penetration of M2M solutions for monitoring and remote control in a wide range of markets, including industrial automation, security and surveillance, smart metering, energy management, and transportation generates great business opportunities. The above challenges stress the imperative need for standardization of M2M
communications (Kartsakli et al., 2014). The ability to connect new devices to the network lead to the evolution of the IoT. The Internet will be no longer just a network of computers, but will potentially involve trillions of smart things with embedded systems. IoT will greatly increase the size and scope of current Internet, providing new design opportunities and challenges (Zeng, Guo, & Cheng, 2011). In this scenario, Cloud Computing (Zhang, Cheng, & Boutaba, 2010) can be seen as a scalable infrastructure (Höfer & Karagiannis, 2011) that supports computing power, storage and software services.
1.2.9. Wireless Sensor Network
With the advances in Wireless Sensor Networks (WSN), the use of these networks for collect and interpret data in real time was facilitated. In the past they were typically used wired sensor networks but have always been expensive, due to installation and maintenance costs. But the large amount of research projects in this area allows for the existence of tiny hardware (and more accurate) devices with reduced cost/size. In the recent years the WSN are used in various monitoring applications, such as:
One of the areas on the rise is the monitoring in automobiles (Tavares, Velez, & Ferro, 2008).
Physiological Monitoring – consists of an array of sensors embedded into the fabric of the wearer to continuously monitor the physiological parameters (Pandian et al., 2008).
Military – Sensing intruders on bases, detection of enemy units’ movements on land/sea, chemical/biological threats and offering logistics in urban warfare (Mehndiratta & Bedi, 2013).
Wireless sensor networks consist of nodes with sensing, computation, and wireless communications capabilities. Many routing, power management, and data dissemination protocols have been specifically designed for WSNs where energy awareness is an essential design issue. The IEEE standard 802.15.4 and ZigBee protocol ("XBee ZigBee Addressing", 2016), has as objectives to provide a stable and secure communication, the low energy consumption, an easy installation, reduced maintenance effort and low cost. The ZigBee protocol was developed by the ZigBee Alliance, an organization composed by several companies (including, e.g., Logitech, Intel, LG, Cisco, Sony, Samsung ("Our Members | The
networking in environments with a very large number of nodes. It should be noted that, although similar, ZigBee, Bluetooth, and WLAN (Wi-Fi) are designed for different purposes and different applications (Huang, Hsieh, & Sandnes, 2008).
ZigBee (802.15.4) Bluetooth (802.15.1) Wi-Fi (802.11) Data rate 20-250 kbps 1 Mbps 11 & 54Mbps
Range 10-100 meters 10 meters 50-100 meters
Frequency band 868 MHz (Europe) 900-928 MHz (NA), 2.4GHZ (worldwide) 2.4GHz 2.4 and 5 GHz Transmit power 0.5, 1, or 3mW 1, 2.5 or 100mW 100mW
Nodes per Network 256+ 8 Unlimited (Depending on applications))
Topology Ad hoc, peer-to-peer,
star, mesh Ad hoc, infrastructure
Ad hoc, very small networks Complexity (Device
and application impact)
Low High High
Power Consumption (Very) Low High Medium
Table 14 - ZigBee, Bluetooth, and Wi-Fi characteristics
These advances include the development of communication standards such as IEEE 802.15.4/ZigBee like described above. This sensor network support small power consumption and node expansion compared to other networks standards for WSN (García-hernández, Ibargüengoytia-gonzález, García-hernández, & Pérez-díaz, 2007).
ZigBee networks can have one of three different topologies. These topologies are summarized below:
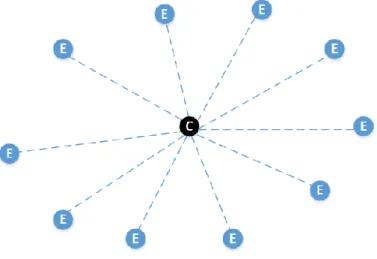
Star topology fig. 1-3 is the simplest and most limited topology available. All devices connect to a single Coordinator node and all communication goes via coordinator.
Figure 1-3 - WSN Star topology
Tree topology fig. 1-4 the coordinator forms the root node of a tree of child nodes. Direct communication can only occur between a child node and its parent, but all nodes can communicate together by traversing up the tree to a common ancestor and then down to the largest node. In this topology routers are able to extend the range of the network, but if a router fails there is no alternative route and portions of the network can become disconnected.
Figure 1-4 - WSN Tree topology
Mesh topology fig. 1-5 is one of the most flexible offered by ZigBee. It is similar to the tree topology but without the following the rigid tree structure and a router can communicate directly with any other router or the coordinator if it is in the range. This means that is possible to have many different routes through the network to certain node (Hillman, n.d.).
Figure 1-5 - WSN Mesh topology
1.2.10.
Joining M2M communication, WSN and Cloud
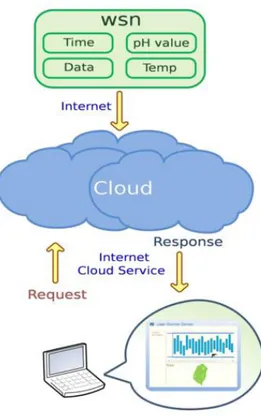
This architecture allows to store and process the sensor data in a more accessible form, available timely, and cost-effective. This concept can be called “Sensor-Cloud” (Ahmed & Gregory, 2011), (Yuriyama & Kushida, 2010), that it allows easier integration with new mobile devices like tablets or smartphones through customized mobile applications that collect data from cloud and process all sensor data. The sensor-cloud infrastructure fig. 1-6 virtualizes a physical sensor as virtual sensor on the cloud computing. Dynamic grouped virtual sensors on cloud computing can be automatic provisioned when users need them. With the development of hardware limitations (in terms of size), and in pursuit of a better performance and enhancing greater computing capability, people turn to find other techniques to achieve these goals. Therefore, the concept of “cloud” was born. In fact, as early as the Internet appeared, the “cloud” has already existed silently providing for us some services (Chung, Yu, & Huang, 2013).
Figure 1-6 - Sensor cloud infrastructure
Like in above image the concept sensor-cloud can be seen, that is, the values/data are sent to the server and the same data are accessed remotely by clients through computers, smartphones or tablets, handling sensor data efficiently.
1.2.11.
Mobile Applications
The growth of information technology and the easy access to it allowed currently several thousands of applications are released to the market every day. Mobile communication is so integrated into our lives that many people feel uncomfortable without a smartphone, a smartphone is a piece of technology multifunctional device that not only communicates, but helps to learn, earn, and have fun. This is made possible by the development of mobile applications. Some of these apps are related with the use of bicycles and cycling, but most only collect information via mobile phone modules. The difference through this work is the use WSN that can in real time detect all interactions that a biker has with his bike and through M2M communications send this data to the cloud, to be analyzed and processed in the mobile application.
According with the website Cycling Weekly (Wynn & Elton-Walters, 2016) these are the best applications that a biker could use:
Cyclemeter: This application fig. 1-7 uses the GPS functions of Apple devices to create a host of statistics to help a biker log and improve cycling performance ("Abvio | Cyclemeter", 2016). This application has the capability to record speed, time, distance and has an extensive array of workouts to follow, making it a virtual training partner.
Courtesy of Abvio app.
Figure 1-7 – Cyclemeter application
Bike Gear Calculator: This is a little different application fig. 1-8 in this case the application is used for every user compare gear ratios on bike to optimize his setup ("Bike Gears, Bike Gear Calculator application for iPhone and iPod Touch.", 2016).
Courtesy of Bike Gear Calculator Iphone application.
Figure 1-8 - Bike Gear aplication
Strava: One of the most application used and consequently most popular is Strava fig. 1-9, this GPS cycling app offer an array of handy ride logging functions which are then uploaded to our online account profile. The app keeps track of ours ride stats as travels, including speed, time and distance. At the end of the ride the biker could view further some stats about calories burned and elevation ridden ("Strava | Run and Cycling Tracking on the Social Network for Athletes", 2016).
Courtesy of Strava, Inc.
Figure 1-9 - Stava application
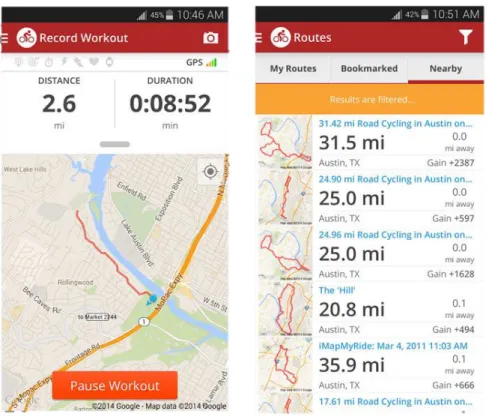
Map My Ride: Another GPS cycling application fig. 1-10 that records a host of data from our ride, including distance, speed, elevation and a detailed route. This app has the capability to upload all data to a site for detailed analysis and sharing with others users ("Bike Maps, Cycling Workout, Biking Routes | MapMyRide", 2016).
Courtesy of MapMyFitness, Inc.
Figure 1-10 - Map My ride application
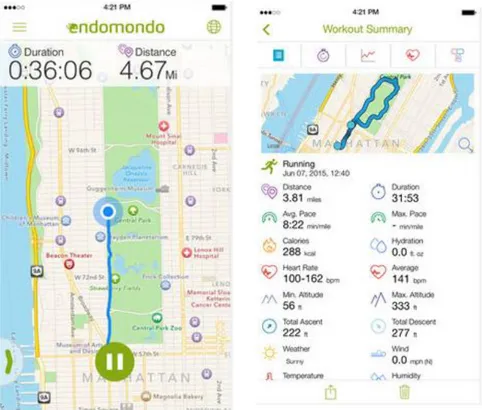
Endomodo: Is an application fig. 1-11 designed to be a personal trainer and as such features “audio encouragement” to motivate the athletes during the exercise, rather than just tracking and logging app ("Endomondo", 2016).
Courtesy of UNDER ARMOUR CONNECTEDFITNESS.
Figure 1-11 - Endomodo application
1.2.12.
Mountain Bike
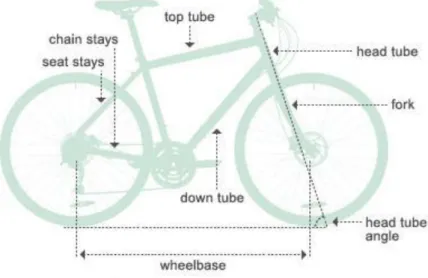
There are an enormous number of sports that nowadays can practice with a bicycle. For this reason, many bicycles can be produced with some aspects that the athletes can specify to the manufactures. Cycling is practice with bicycles normally produced of fiber-carbon and with tires very thin, to improve his weight, lower rolling resistance and grip while cornering. In the case of the sports practiced on the mountain bikes the weight is put aside and the concern is more with the strength and safety of the bikers. The first thing to know is that mountain biking is a sport or recreational activity that consists of a person riding over a rough terrain, using a specially adapted mountain bike. The first mountain bike was a cruiser bicycle that was modified to enable cyclists to freewheel down mountain bike trails (STEYN, VAN NIEKERK, & JACOBS, 2014). The sport became popular in the 1970s in Marin Country, California, USA. A bicycle frame is the main part of a bicycle, onto which the wheels and all other components are attached fig. 1-12. The geometry of a mountain bike varies based on the angle of the seat post and the head tube measured from the horizontal. Mountain bike frames are manufactured using materials such as carbon steel, steel alloys, aluminium alloys, titanium and carbon fiber ("HISTORY | The Marin Museum of Bicycling and Mountain Bike Hall of Fame", 2016).
Figure 1-12 – Safety Bike struture
The invention of the Wheel is one of the most significant advances in history. Rolling resistance between the Wheel and road surface is a major factor in the performance of any vehicle. The terrain surface has a major impact on the rolling speed of a wheel and the overall performance of the vehicle (Jackson et al., 2011), (Steyn & Warnich, 2014).
1.3.
Objectives
The main objective with this work is to build and develop a monitoring system associated athlete of mountain Bike, using a distributed WSN on his equipment and bicycle. This equipment should not interfere with his workout, should contribute to achieve a better performance.
The system included historically information from the athletes, with the objective to each one achieve better performance.
The following four topics describe the developed system very briefly:
1. Wireless Sensor Network: Creation of wireless sensor network that can capture the interactions of bicycle and biker. This implies the choice of sensors and his assembly. 2. Developing acquisition, processing application: On the microcontrollers is important
to acquire the information from the sensors, this information needs to be locally processed and sent to the database.
3. Database: Creation and installation of mountainBikeDB, with the supposed mechanism to read and write to it.
4. Mobile Application: Developing of an Android application for tablet or smartphone that could provide the visualization of all metrics calculated using the training data obtained during practice.
1.4.
Related Work
Cycling it’s a complex physical activity that involves a set of movements. The cycling also provides a framework to a variety of complex problems in system dynamics and control. These include multi-body dynamics, nonlinear and linear system descriptions, human control, system simulation and instrumentation. The bicycle with a human comprises a human vehicle with dynamic behavior. In contrast with an automobile or aircraft, the pilot of a bicycle comprises 80%~90% of the overall system mass and thus the motion of the rider is not negligible. These movements can be analyzed using different techniques, such as instrumented bicycle or motion capture techniques ("Bicycle dynamics, control and handling — Sports Biomechanics Lab", 2016). These two techniques highlight the complexity of the study. The first one it’s related with the use of sensors on the bike or in the biker’s equipment like pressure sensors and GPS. The second technique could be related with the movement of the biker related with the bicycle, that is, analyze the influence of the position of the upper body and the legs while the bicycle is on movement. These two techniques allow the creation of models that describe the movement, the points of pressure (Lie & Sung, 2010) and speed that a biker could be doing while training on certain track. These data could be used to provide a track specific performance report.
1.5.
Methods of Analyze
Like in football specially in pre-season many of the athletes of this sport use some equipment’s to track is own training, this equipment is produced by the GPSports company ("Home - GPS Tracking Systems for Elite Sports", 2016), this equipment incorporates advanced GPS tracking with heart rate and accelerometer monitoring. In the case of cycling the heart-rate monitor is one piece of technology most used to improve speed, fitness and body composition in the training of bikers (cyclists, 2016). On the University of California, they are using some instrumented bikes to study the bicycle dynamics, control and handling ("Instrumented Bicycle — Sports Biomechanics Lab", 2016). They are using some sensors on the bicycle to collect information about some variables related with force and accelerations produced. This type of study allows the creation of models that describe all the movements and balance that a biker produce with his bicycle. As well the research related with braking on a bicycle (Sundström, Bäckström, Carlsson, & Tinnsten, 2015), (Beck, 2009).
Chapter 2 - System Description
2.
Overview
The architecture of the system has three blocks fig. 2-1. At first block is represented the bicycle and the biker, so it is easy to assume that wireless sensor network was placed, on the sports equipment (i.e., gloves, shoes, chest trap and bicycle frame).
Figure 2-1 - System Architecture
Each of the end-nodes has a microcontroller ATmega328p that will read the behavior and the interaction of the biker with his bicycle. These nodes will make the acquisition and processing of primary data and then send it to coordinator ATmega2560, that stores the information on a local database and send it to the cloud. The second block is the server (cloud), which receives the information and makes it available to be accessed later. The third block, represents a mobile application that access the information in the cloud, interprets and correlates all biker information and allows data visualization with a friendly graphical user interface. In the above figure is presented some yellow dots and a parallelepiped, this is to illustrate where the end- nodes and coordinator where placed. They are based on the microcontrollers platform shown on fig. 2-2.
Figure 2-2 - Representation Coordinator & End-node
2.1. Hardware Components
The Hardware involved in the WSN is responsible for the acquisitions, processing and sending of data to the server. So, in the WSN are the force sensors, inertial measurement boards, shields to attach to the microcontrollers and the microcontrollers himself.
2.1.1. Force Sensors
Force Sensors from FlexiForce ("FlexiForce A201 Sensor", 2014), act as a force sensing resistor in an electric circuit, when no pressure is applied to the sensor the resistance is very high, otherwise the resistance decrease (Manual, 2016). The force sensor is materialized by A201 FlexiForce thin film piezoresistor fig. 2-3 included in a voltage divider implementation.
Figure 2-3 - FlexiForce a201 Composition
The FlexiForce force sensor is an ultra-thin, flexible printed circuit. The standard A201 force sensor is constructed of two layers of substrate (polyester) film. On each layer, a conductive material (silver) is applied, followed by a layer of (Pressure-Sensitive Ink). Adhesive is then used to laminate the two layers of substrate together to form the force sensor. The active sensing area is defined by the (silver) circle on top of the (Pressure-Sensitive Ink). Silver extends from the sensing area to the connectors at the other end of the sensor, forming the conductive leads. A201 force sensors are terminated with male square pins, allowing them to be easily incorporated into a circuit. These sensors are available in three force ranges Low 4.4N, Medium 111N and High 445N. Foil sensors such as produced by FlexiForce are also commonly used in commercial applications. One example are PlayStation controllers which have buttons that do not only have an on-off function but also a scaled input according to the applied force on the button.
Performance
Linearity (Error): <±3%
Repeatability: <±2.5% of Full Scale Hysteresis: <4.5% of Full Scale
Response Time: <5sec
Operating Temperature: (-9ºC – 60ºC)
In this work the sensor used is the Sensor HT201-L (Low: 0-30lb [133N] force range). To know the real force, applied on sensor it’s needed to execute some calibration. In the fig. 2-4, the graphs show the resistance curve and the conductance curve (1/R).
Figure 2-4 - Force versus Conductance
In the project these sensors are in the biker shoes and gloves, these ten sensors acquire the interaction described. The following conditioning circuit fig. 2-5 is used:
Figure 2-5 - Conditioning circuit for force sensors The equation of the output voltage is represented as follows:
𝑉𝑜𝑢𝑡 = 𝑅
𝑅𝑠 + 𝑅×𝑉𝑟𝑒𝑓
where the parameters in equation (1)are defined as follows: Vout: is the output voltage [V];
Rs: is the variable resistance, force sensor []; R: is the reference resistor [];
Vref: is the reference voltage [V];
This condition circuit is used because the acquisition module only reads voltage values. It’s important to say that in our circuit Vref is 3.3V and the R=1M.
For the conversion of the ADC values from the sensors for Newtons (N) in the side of the application is used the following formulas:
𝑔𝑎𝑖𝑛 =𝐾𝑛𝑜𝑤𝐹𝑜𝑟𝑐𝑒 𝐴𝐷𝑉𝑉𝑎𝑙𝑢𝑒 ≈
1500𝑔
172 ≈ 8.72
In order to obtain a calibration value is necessary to apply a known force (in this case 1.5Kg) and read the ADC value, after that is divided the force value by the ADC value read.
𝑤𝑒𝑖𝑔ℎ𝑡 (𝑖𝑛 𝑁𝑒𝑤𝑡𝑜𝑛) = 𝑔𝑎𝑖𝑛×(𝐴𝐷𝐶𝑣𝑎𝑙𝑢𝑒)×0.001×9.80665002864
Then the equation (3) is applied to obtain the force applied in each force sensor.
On fig. 2-6 is possible to observe the location if a biker applied a force of approximately 14.53N equivalent to 1482 grams on the pressure sensor.
(2)
(3) (1)
Figure 2-6 – Characteristic of the sensor
2.1.2. Inertial Measurement Unit
IMU, is an inertial measurement unit that packs an L3GD20H 3-axis gyro and an LSM303D 3-axis accelerometer and 3-axis magnetometer onto a tiny 0.8x0.5 board. This board fig. 2-7 and fig. 2-8, allows to calculate some angles between the bicycle and the rider as well as the direction of the movement ("Pololu - MinIMU-9 v3 Gyro, Accelerometer, and Compass (L3GD20H and LSM303D Carrier)", 2016).
Figure 2-7 - MinIMU-9 v3 Gyro, Accelerometer, and Compass
14.53892882 0 10 20 30 40 50 60 0 100 200 300 400 500 600 700 N ew to n ADC Values
Characteristic
Figure 2-8 - IMU schematic
The nine independent rotation, acceleration and magnetic readings (known as 9 Degrees of Freedom) provides all the data needed to make an altitude and heading reference system (AHRS). These sensors, combined with a built in processor create an inertial sensor system fully capable to measure the altitude of objects in 3D space. The accelerometers measure proper acceleration – the rate at which the velocity of an object is changing. They measure the static (gravity) or dynamic (motion vibration) acceleration forces of a given object. The ideal accelerometer in AHRS provides a long term stability, low vibration error and reliability. Magnetometers are used in AHRS to measure the direction of the magnetic field at a point in space. In case of gyroscope the AHRS demand very precise sensors, the gyros are used as the primary source of orientation information. The quality of these devices has big impacts in overall performance of the inertial sensor system (Honglong, Liang, Wei, Guangmin, & Weizheng, 2008). This technology provides good accuracy and reliability, it is not conducive to a MEMS-based AHRS due to its larger size and greater power requirements.
This sensor is used on the chest of the rider to measure the upper body motion and in the bicycle frame to record the oscillations on the three plans of motion (Prayudi & Kim, 2012). Each of the three sensors acts as a slave device on the same I2C bus.