DOI: 10.20472/ES.2016.5.1.002
ON THE RELATIONSHIP BETWEEN SOVEREIGN BONDS
AND CREDIT DEFAULT SWAPS IN PORTUGAL*
JORGE M. ANDRAZ, CRISTINA M. VIEGAS, NÉLIA M. NORTE
Abstract:This paper aims at identifying the relationship between government bonds spreads and credit default swaps premiums in Portugal for long and short maturities, covering a period that includes the beginning of the 2008 international financial crisis. We estimate Autoregressive Distributed Lag error correction models for the sub periods prior and after the moment crisis started. Results reveal the absence of cointegration over the sample period, with important differences prior and after 2010 in both maturities. There is no evidence of long-run relationship between both markets in both maturities, as the 2007 crisis has interrupted the long run relationship that was observed in the 5-year segment, and enacted a long run relationship in shorter maturities. The credit default swaps market performs a leading role on price determination in short- and long-run before the crisis but the role of the bond spread as a credit risk information has increased during the crisis.
Keywords:
Credit default swaps; sovereign bonds; unit roots; regime changes; cointegration; ARDL.
JEL Classification: C13, C32, G14 Authors:
JORGE M. ANDRAZ, Faculty of Economics, University of Algarve and CEFAGE (UE) – Center for Advanced Studies in Management and Economics, Portugal, Email: [email protected]
CRISTINA M. VIEGAS, Faculty of Economics, University of Algarve and CEFAGE (UE) – Center for Advanced Studies in Management and Economics, Portugal, Email: [email protected]
NÉLIA M. NORTE, Faculty of Economics, University of Algarve and CEFAGE (UE) – Center for Advanced Studies in Management and Economics, Portugal, Email: [email protected]
Citation:
JORGE M. ANDRAZ, CRISTINA M. VIEGAS, NÉLIA M. NORTE (2016). On the relationship between sovereign bonds and credit default swaps in Portugal*. International Journal of Economic Sciences, Vol. V(1), pp. 18-36., 10.20472/ES.2016.5.1.002
*The authors are pleased to acknowledge financial support from Fundação para a Ciência e a Tecnologia and FEDER/COMPETE (grant PEst-C/EGE/UI4007/2013). The authors also thank the useful suggestions and comments of two anonymous referees.
1 Introduction
With the international financial crisis, starting in 2007, concerns about the solvency of institutions, in particular the financial institutions, began to be in the spotlight. These concerns rapidly spread out to sovereign debts in 2009 when the Dubai government was forced to reschedule the debt payment motivated by the lack of liquidity in the international market and the crisis in the real estate sector. Other events have also contributed to the increasing economics agents’ disbelief.1 On the European side, the lack of confidence on public accounts, together with the perspectives of reduced economic growth of the Greek economy, rose up the default risk of the Greek government and this rapidly spread to the Euro Zone’s more fragile economies. Both the financial crisis at the international level and the European sovereign debt crisis impacted on the Portuguese sovereign debt interest rates, which rapidly reached the psychological level of 7%. This, together with the high Portuguese public deficit and debt constituted a clue to the markets of the increased risk of default of the Portuguese State.
This context motivates the purpose of this paper of revising the relationship between sovereign bonds market and sovereign credit default swaps market in Portugal since the 2007 crisis has certainly imposed new dynamics in the way they interact. Our motivation is strengthened by the absence of consensus in the literature on this issue. If, on one hand, many studies report that credit default swap premiums lead bond prices, others report the inverse conclusion (a literature review is provided in the next section).
In our opinion, this work extends the literature in several directions. First, we use data for Portugal which is one of the European most indebt country that asked for external financial assistance and for which there is a shortage of information on the implications of the financial crisis on credit default swaps and sovereign bonds markets. Second, we identify the main changes on the relationship between the Portuguese government bonds yield spreads and the credit default swaps premiums of the sovereign debt, introduced by the worldwide financial crisis. In particular, we attend to the relation between the Portuguese government bonds yield spreads and the credit default swaps premiums both in the short- and long-run and to what extend the international financial crisis has changed the agents’ behavior and therefore the nature of that relationship. Finally, the analysis is conducted for different maturities. In particular, we consider data on 2 and 5-years of Treasury bonds and credit default swaps and investigate the above mentioned issues on these maturities. On methodological grounds, we based our analysis on cointegration and causality analysis, considering the existence of potential regime changes, and estimate distributed autoregressive models with error correction mechanisms in which the dynamic relationships between variables are fully considered. This approach allows for the consideration of dynamic feedbacks which, in our opinion, are essential to understand the
1 Among those events there is the huge increase of the Greek public debt, the Fannie Mae and Freddy rescue and the
relationship between markets.
This paper is structured as follows. Section 2 reports a brief literature review on the relationship between the differentials in Treasury bonds and credit default swaps for different countries. Section 3 introduces the data and preliminary statistical analysis. Section 4 describes the methodology and reports the estimation results. Finally, section 5 provides concluding remarks.
2 Literature Review
Early studies are focused on the relationship between corporate bonds and credit default swaps, as well as on the impact of credit rating changes on credit default swaps. Examples of studies that confirm the leading role of credit default swaps markets with respect to corporate bonds markets include, among others, Blanco et al. (2005), Longstaff et al. (2005), Zhu (2006), Alexopoulou et al. (2009) and Forte and Peña (2009).
On the other hand, a number of papers have studied the interrelation between government bond spreads and their associated credit default swaps. Chan-Lau and Kim (2004) and Ammer and Cai (2011) report mixed evidence on the relationship between those markets in emergent economies. According to Aktug et al. (2012), this relationship has strengthen over the period 2001-2007 in several emerging countries, in which bond markets lead credit default swaps markets in general. Already, Levy (2009), for a set of emerging markets, states that there is no consistent pattern of one market leading the other and the price discovery occurs on the market with higher liquidity.
Recently, several studies have analyzed the relationship between sovereign bonds and credit default swaps in the Euro Zone. Given the impact of the European sovereign debt crisis on public opinion, Andenmatten and Brill (2011) conclude that credit default swaps market are not vulnerable to investor’s actions for a set of European countries and there is a long-run relationship between credit default swaps and sovereign bonds spreads. In particular, the credit default swaps market is responsible for price formation in 71% of the cases.
In another study, Fontana and Scheicher (2010), using a different group of European countries, concluded that the premium on credit default swaps exceeds the yields differentials on government bonds in most countries, with the exceptions of Portugal, Ireland and Greece. In their work, credit default markets are leading in price discovery, followed by the bond market adjustment in half of the sampled countries (including Portugal). This mixed evidence is already confirmed by Delatte et al. (2012) that analyze the relation between credit default swaps and bonds in the so-called “PIIGS” (Portugal, Ireland, Italy, Greece and Spain) and five other high and low-yield core European countries over the period 2008-2010. The authors conclude that such relation is not linear and that credit default swaps spreads lead to sovereign bonds during the periods of turmoil. Carboni (2011) analyzes a sample of 18 European sovereign entities and conclude that credit
default swaps markets lead price discovery during 2010 while both markets contribute to price discovery during the pre-Lehman period. On the other hand, Delis and Mylonidis (2011) analyzed specifically the causality relationship between sovereign bonds and the corresponding credit default swaps with 10 years maturity in Southern European countries. The results suggest the existence of causality after the international crisis in 2007. Specifically, credit default swaps premiums lead sovereign Treasury bonds and feedback causality is detected in periods of market distress. In a recent study, Calice et al. (2013) found evidence that liquidity of sovereign credit default swaps markets has a substantial time varying influence on bonds markets in Ireland, Greece and Portugal. Therefore, it seems that a conclusive evidence about which market does lead the other is absent from the literature, as some studies consider that credit default swaps markets lead bonds markets while others report that bonds markets is responsible for credit default swaps movements. However, the literature seems to be consensual around the idea of the leading role of the credit default swaps market in Portugal.
3 Data: Sources and preliminary statistical analysis
This section reports the data statistical analysis which aims to identify the main stylized facts and corresponding sources. A preliminary data analysis concerning stationarity and structural changes is also reported.
3.1 Data: sources and descriptive analysis
The data consist on daily observations of the Portuguese government bonds spreads (TB, hereafter) and credit default swaps premiums of the Portuguese sovereign debt (CDS, hereafter) with maturities of two and five years, covering the period from May 1, 2007 to October 7, 2011, in a total of 1156 observations.
Sovereign debt bonds are fixed-income securities issued by central governments in international markets. Sovereign credit default swaps are insurance policies provided by a third party, such as a bank or a hedge fund, against the risk of default by central governments on their debt obligations. The total amount paid per year, as a percentage of the notional principal, to buy protection is known as the credit default swaps premium. The sovereign credit default swaps are a small but rapidly growing part of the CDS market, which began in the early 2000s, although comprehensive CDS statistics began to be collected in 2004. By the end-June 2012, the gross notional amount of sovereign credit default swaps outstanding was about $ 3 trillion versus $ 27 trillion in CDS as a whole. However, the size of the sovereign credit default swap market has increased noticeably since 2008, while other CDS markets have fallen off. (see, International Monetary Fund, 2015).
The determinants that drive differences between sovereign credit default swaps and government bonds are often stated in several official reports (see, for example, International Monetary Fund, 2015). Those factors include government debt, gross
domestic product growth and foreign reserves to a lesser extent.
The Agency for Public Debt and Treasury Management is responsible for the Portuguese public debt management. Its functions include the management of the State's treasury and public debt funding sources, as well as public debt issuing. Although Treasury Bonds and Treasury Bills are tools for debt issuing, the former is by far the most used option. This tool is dealt in the domestic market through the Special Market of Public Debt, and in the international market through the international platform EuroMTS. This platform is the largest trading system of sovereign bonds in the Euro Zone, based on electronic trade and it is one of the most important financial markets worldwide.
The standard contracts of credit default swaps were created in 1998-1999 by the International Swap and Derivative Association (ISDA). These tools are traded in non-regulated markets (OTC – Over The Counter). In 2012, the European authorities came out to forbid the short selling of credit default swaps, in particular those related to sovereign debt.
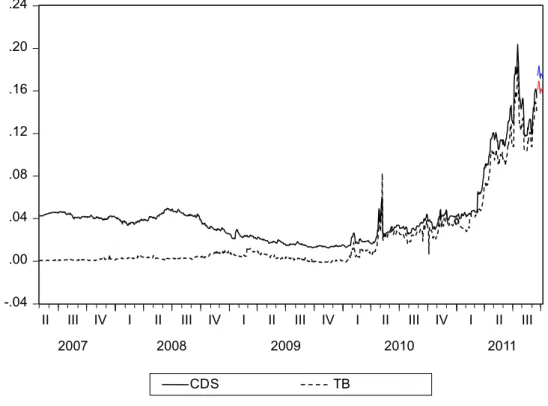
In our study, the bond spread is defined as the difference between the Portuguese government yield and the German yield, which is the benchmark for the euro area. The data series are illustrated in Figs 1 and 2 for both maturities and their sources were the Bloomberg database and the Wall Street Journal, for TB and SCDS data, respectively.
The basis, defined as the difference between the CDS premium and the TB spread, in the period following the Lehman collapse, has become smaller and in some cases negative (maturities of two years, in particular in 2010). The figures suggest that both series report a similar evolution over the sample period, while with different patterns before and after 2009. This evidence justifies our methodological option of considering both variables as endogenous and performing the analysis not only for the whole sample period but also for different sub periods. By visual inspections, it is quite perceptible a stronger relationship of both series after 2008, when the Lehman Brothers bankruptcy took place.
Figure 1: CDS premiums and the TB spread in two years maturity segment
Source: Bloomberg and Wall Street Journal.
Figure 2: CDS premiums and the TB spreads in five-years maturity segment
Source: Bloomberg and Wall Street Journal.
.00 .04 .08 .12 .16 .20
II III IV I II III IV I II III IV I II III IV I II III
2007 2008 2009 2010 2011 TB CDS -.04 .00 .04 .08 .12 .16 .20 .24
II III IV I II III IV I II III IV I II III IV I II III
2007 2008 2009 2010 2011
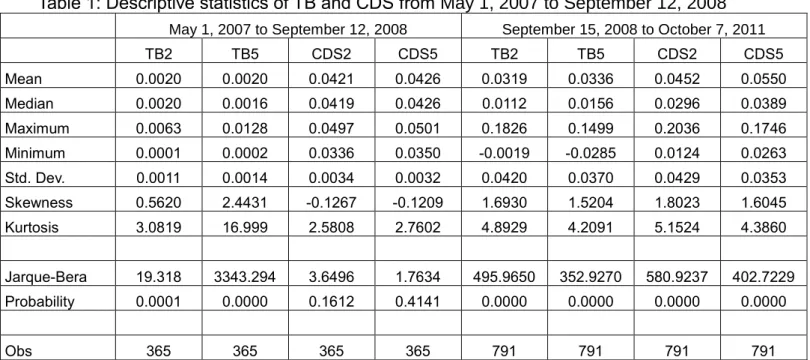
Given the differences of both series trajectory over the period, Table 1 provides some summary statistics for the 2 and 5-year TB and CDS over the periods before and after September 15, 2008.2 As expected, the averages of both series rise in the second period. This upward trend is also accompanied by variability increase, measured by the standard deviation. The minimum and maximum values of both variables in all maturities are observed after September 15, 2008. The series are positively skewed and leptokurtic, with the exception of the 2 and 5-year CDS series for the period before September 15, 2008 for which the normality is not rejected.
Table 1: Descriptive statistics of TB and CDS from May 1, 2007 to September 12, 2008
May 1, 2007 to September 12, 2008 September 15, 2008 to October 7, 2011
TB2 TB5 CDS2 CDS5 TB2 TB5 CDS2 CDS5 Mean 0.0020 0.0020 0.0421 0.0426 0.0319 0.0336 0.0452 0.0550 Median 0.0020 0.0016 0.0419 0.0426 0.0112 0.0156 0.0296 0.0389 Maximum 0.0063 0.0128 0.0497 0.0501 0.1826 0.1499 0.2036 0.1746 Minimum 0.0001 0.0002 0.0336 0.0350 -0.0019 -0.0285 0.0124 0.0263 Std. Dev. 0.0011 0.0014 0.0034 0.0032 0.0420 0.0370 0.0429 0.0353 Skewness 0.5620 2.4431 -0.1267 -0.1209 1.6930 1.5204 1.8023 1.6045 Kurtosis 3.0819 16.999 2.5808 2.7602 4.8929 4.2091 5.1524 4.3860 Jarque-Bera 19.318 3343.294 3.6496 1.7634 495.9650 352.9270 580.9237 402.7229 Probability 0.0001 0.0000 0.1612 0.4141 0.0000 0.0000 0.0000 0.0000 Obs 365 365 365 365 791 791 791 791
Notes: "TB2" and "CDS2" stand for government bonds and credit default swaps at 2-years maturity, respectively; "TB5" and "CDS5" stand for government bonds and credit default swaps at 5-years maturity, respectively
Source: Authors’ calculation.
3.2 Stationarity and structural changes
To determine the variables’ integration order, we use the Augmented Dickey-Fuller (ADF) test. The Bayesian Information Criterion (BIC) is adopted to define the optimal number of lagged differences in the regressions and deterministic components are included if statistically significant. The results are reported in Table 2.
We start by applying the ADF tests to TB and CDS for both maturities, in levels, for the whole sample period and for the periods before and after the Lehman Brothers bankruptcy, with the benchmark date being fixed on September 15, 2008. The results overwhelmingly suggest that these variables are not I(0).
2 In an attempt to establish a benchmark date for the beginning of the international crisis, we consider September 15,
2008, when the Lehman Brothers Corporation filed for Chapter 11 bankruptcy protection. Therefore, the analysis is conducted both for the whole sample period, and for the periods before and after that date.
Table 2: Augmented Dickey-Fuller tests Variables
Deterministic
components Order (BIC) Test statistic
Critical values
5% 1%
Levels (maturity in years)
Sample period: May 1, 2007 to October 7, 2011
CDS2 CT 4 0.269066 -3.413718 -3.966033
TB2 C 0 0.507876 -2.863831 -3.435792
CDS5 C 8 0.602751 -2.863848 -3.435831
TB5 CT 4 -0.346545 -3.413718 -3.966033 Sub-period: May 1, 2007 to September 12, 2008
CDS2 C 0 -1.680040 -2.869488 -3.448622 TB2 C 2 -2.836722 -2.869442 -3.448518 CDS5 C 0 -1.559176 -2.869488 -3.448622 TB5 CT 4 0.887105 -2.864943 -3.438309
Sub-period: September 15, 2008 to October 7, 2011
CDS2 CT 1 -1.438934 -3.415457 -3.969593 TB2 CT 0 -1.598633 -3.415457 -3.969593 CDS5 CT 8 -1.460843 -3.415457 -3.969593
TB5 C 4 0.884782 -2.864947 -3.438319
1st Differences (maturity in years)
Sample period: May 1, 2007 to October 7, 2011
DCDS2 CT 3 -15.995086 -3.415457 -3.969593 DTB2 C 0 -36.47945 -2.863833 -3.435797 DCDS5 C 7 -12.08526 -2.863848 -3.435831 DTB5 CT 3 -19.944198 -3.413718 -3.966033
Sub-period: May 1, 2007 to September 12, 2008
CDS2 C 0 -20.35563 -2.869488 -3.448622 TB2 C 2 -15.25176 -2.869488 -3.448622 CDS5 CT 0 -18.71415 -2.869488 -3.448622 TB5 C 2 -13.60275 -2.869488 -3.448622
Sub-period: September 15, 2008 to October 7, 2011
CDS2 CT 3 -15.99513 -3.415457 -3.969593 TB2 CT 0 -1.598643 -3.415457 -3.969593 CDS5 C 7 -10.10681 -2.864947 -3.438319 TB5 C 3 -16.49817 -2.864947 -3.438319
Notes: C stands for “constant; CT stands for “constant and trend. Source: Authors’ calculation.
In all cases the test statistic absolute values are lower than the critical value at the 1% level. However, when the ADF test is applied to the series in first differences, the results clearly suggest that these variables are I(1), that is they are stationary in first differences in all maturities, either for the entire sample period and for the periods before and after the Lehman Brothers bankruptcy.
Given the lack of power of this test (and other traditional unit root tests such as the Phillips-Perron test3) to differentiate between paths of a stationary unit root when there is a
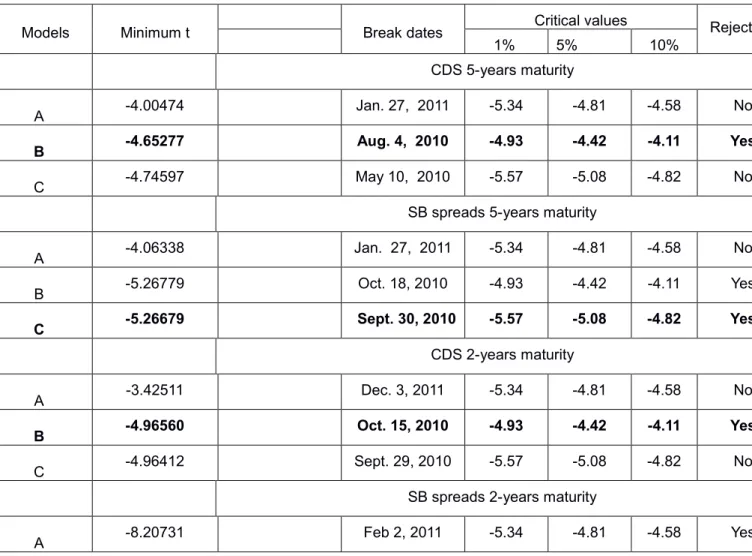
structural change, we also implement the Zivot-Andrews test (Zivot and Andrews 1992). By this way, we confirm whether our results on the variables' integration order are robust to the presence of structural breaks in the data generating process of the series. The results are reported in Table 3.
The results suggest that, for both maturities, CDS and TB spreads series are stationary around a broken trend and level and tend, respectively. The regime changes in all series occurred in 2010.
Table 3: Zivot and Andrews one break test
Models Minimum t Break dates Critical values Reject H0*
1% 5% 10%
CDS 5-years maturity
A -4.00474 Jan. 27, 2011 -5.34 -4.81 -4.58 No
B -4.65277 Aug. 4, 2010 -4.93 -4.42 -4.11 Yes
C -4.74597 May 10, 2010 -5.57 -5.08 -4.82 No
SB spreads 5-years maturity
A -4.06338 Jan. 27, 2011 -5.34 -4.81 -4.58 No B -5.26779 Oct. 18, 2010 -4.93 -4.42 -4.11 Yes C -5.26679 Sept. 30, 2010 -5.57 -5.08 -4.82 Yes CDS 2-years maturity A -3.42511 Dec. 3, 2011 -5.34 -4.81 -4.58 No B -4.96560 Oct. 15, 2010 -4.93 -4.42 -4.11 Yes C -4.96412 Sept. 29, 2010 -5.57 -5.08 -4.82 No
SB spreads 2-years maturity
A -8.20731 Feb 2, 2011 -5.34 -4.81 -4.58 Yes
3 See Phillips and Perron (1988).
B -11.06096 Nov. 1, 2010 -4.93 -4.42 -4.11 Yes
C -11.06094 Oct. 19, 2010 -5.57 -5.08 -4.82 Yes
Notes: * Decision considering the 5% level of significance; the null states the existence of a unit root; the chosen model is in bold.
Source: Authors' calculation.
We also check whether these patterns have been robust to the financial crisis and run the Zivot and Andrews test for the periods before and after the break dates previously identified. For testing purposes, we consider the earlier breaks identified in each maturity: August 4, 2010 for the 5-year maturity and September 29, 2010 for the 2-year maturity. The results are reported in Tables 4 and 5, respectively.
For the 5-year maturity, we observe a behavior change in the TB spreads series. The CDS series contains a unit root in both periods. For the shorter 2-year maturity, the TB spreads series is trend stationary around a broken level and trend in both periods, while the CDS series continues to exhibit a unit root. However, there has been a change in the TB spreads series fundamentals in both maturities. Therefore, our series are integrated of different orders: at 5-year maturity, the TB spreads series is I(0) in the first period and I(1) in the second period, while the CDS series is I(1) in both periods; for 2-year maturity, the TB spreads and the CDS series are I(0) and I(1) in both periods, respectively.
Table 4: Zivot and Andrews one break test in the 5-years maturity segment
Models Minimum t Break date Critical values Reject H0*
1% 5% 10%
Before August 4, 2010 TB spreads 5-years maturity
A -4.56761 Jan. 29, 2010 -5.34 -4.81 -4.58 No B -5.17473 Jan. 11, 2010 -4.93 -4.42 -4.11 Yes C -5.71348 Aug. 26, 2009 -5.57 -5.08 -4.82 Yes CDS 5-years maturity A -4.02241 Jan. 15, 2010 -5.34 -4.81 -4.58 No B -4.23985 Nov. 11, 2009 -4.93 -4.42 -4.11 No C -4.54778 Jun. 16, 2009 -5.57 -5.08 -4.82 No After August 4, 2010
TB spreads 5-years maturity A -3.80849 Apr. 8, 2011 -5.34 -4.81 -4.58 No B -3.49598 Jan. 14, 2011 -4.93 -4.42 -4.11 No C -4.04538 Mar. 23, 2011 -5.57 -5.08 -4.82 No CDS 5-years maturity A -3.88871 Mar. 23, 2011 -5.34 -4.81 -4.58 No B -3.21817 Jul. 8, 2011 -4.93 -4.42 -4.11 No C -3.78096 Mar. 23, 2011 -5.57 -5.08 -4.82 No
Notes: * Decision considering the 5% level of significance. Source: Authors' calculation.
Table 5: Results of Zivot and Andrews one break test for the 2-years maturity segment
Models Minimum t Break date Critical values Reject H0*
1% 5% 10%
Before September 29, 2010 TB spreads 2-years maturity
A -8.49755 Mar. 22, 2010 -5.34 -4.81 -4.58 Yes B -8.85954 Dec. 30, 2009 -4.93 -4.42 -4.11 Yes C -9.25136 Mar. 22, 2010 -5.57 -5.08 -4.82 Yes CDS 2-years maturity A -3.43224 Mar. 29, 2010 -5.34 -4.81 -4.58 No B -3.95955 Nov. 19, 2009 -4.93 -4.42 -4.11 No C -3.95076 Aug. 11, 2009 -5.57 -5.08 -4.82 No After September 29, 2010 TB spreads 2-years maturity
A -6.98749 Mar. 31, 2011 -5.34 -4.81 -4.58 Yes
B -6.55603 Jan. 28, 2011 -4.93 -4.42 -4.11 Yes
C -7.26648 Aug. 10, 2011 -5.57 -5.08 -4.82 Yes
A -3.55392 Mar. 28, 2011 -5.34 -4.81 -4.58 No
B -3.05621 Jan 12, 2011 -4.93 -4.42 -4.11 No
C -3.65449 Mar. 11, 2011 -5.57 -5.08 -4.82 No
Notes: * Decision considering the 5% level of significance. Source: Authors' calculation.
4 Empirical results
In this section we proceed with the cointegration analysis and the estimation of the relationship between credit default swaps and sovereign bond markets in the short- and long-run.
4.1 Cointegration analysis
Given that the occurrence of significant breaks motivates differences in the series' integration order, we use the ARDL approach developed by Pesaran and Shin (1995)4,
Pesaran and Shin (1999) and Pesaran et al. (1996, 2001) to test the existence of cointegration, The main advantage of the ARDL model, given the power and testing of the long-run relationship, is precisely the possibility to be applied irrespective of the series’ integration order.
The ARDL framework is as follows: ∆𝐶𝐷𝑆𝑡= 𝛼0+ ∑𝑛 𝑏𝑗∆𝐶𝐷𝑆𝑡−𝑗
𝑗=1 + ∑𝑛𝑗=0𝑐𝑗∆𝑇𝐵𝑡−𝑗+ 𝛾1𝐶𝐷𝑆𝑡−1+ 𝛾2𝑇𝐵𝑡−1+ 𝜀𝑡. (1)
where 𝛼0 is the drift component and 𝜀𝑡 is a random error. The parameters 𝛾𝑖, where 𝑖 = 1, 2, are the corresponding long-run multipliers, while the parameters 𝑏𝑗, 𝑐𝑗 are the short-run dynamic coefficients of the underlying ARDL model.
In the ARDL model, we first test the null of no cointegration (i.e. 𝐻0: 𝛾1 = 𝛾2 = 0) against the alternative using the F-test with critical values tabulated by Pesaran et al. (2001). Given the long sample size, we performed a general to specific approach by including several lagged terms in the regression and excluding those terms whose coefficients are not statistically significant. The maximum length of three was chosen for the ARDL. The results are reported in Table 6 and they suggest that there is no long-run relationship between the two markets over the sample period in both maturities. However, while valid for the entire sample, this result may cover different patterns over the sub periods. In fact, the analysis for each subsample reveals mixed results. For the 2-years maturity, CDS and TB markets are not cointegrated in the period prior to September 29, 2010, e.g. the period
prior to the financial crisis, but they exhibit a long-run relationship afterwards. However, the inverse pattern is observed for the 5-years maturity. While it is observed a common stochastic trend prior to August 4, 2010, there is no cointegration between the series in the following period.
These results illustrate how the instability generated by the financial crisis seems to have impacted on the way both markets price risk in the long-term. If for the 2-years maturity it is detected a co-movement of both markets after September 2010, there seem to be no connection between them over the previous period. By the contrary, with the financial crisis, both markets started to price the risk differently in the five-year maturity segment. Therefore, with the financial crisis, economic forces seem to have worked in the direction of eliminating short-run deviations from the long-term relationship in the 2-years contracts but not in the 5-years segment.
Table 6: Bounds-testing procedure results
Cointegration hypothesis Period F-statistic
Maturity: 5 years F(CDS|TB) Sample period 1.602 F(CDS|TB) Before August 4, 2010 4.401** F(CDS|TB) After August 4, 2010 1.502 Maturity: 2 years F(CDS|TB) Sample period 1.172 F(CDS|TB) Before September 29, 2010 1.735 F(CDS|TB) After September 29, 2010 5.228***
Note: *** Rejection of the null of no cointegration at 1% level of significance; ** Rejection of the null of no cointegration at 5% level of significance.
The critical values in Peasaran et al. (2001) are 2.45 – 3.52, 2.86 – 4.01, 3.71 – 5.06 for 10%, 5% and 1% level of significance, respectively.
Source: Authors' calculation.
Several factors have been referred to justify the absence of cointegration. The absence of cointegration can be motivated by the fact that at least one market contains time-varying non-transient factors that reflect something other than credit risk or, at least, one market price contains time-varying non-transient measurement error. Other explanation is consistent with Merton's theory according to which the lack of a long-run relationship
between markets is susceptible to occur in countries whose debt to asset values are volatile, imposing thereby a non-linear relationship. In those cases there is no place for cointegration analysis. We believe this last explanation is more adequate for Portugal, given the increase of the public debt in the last years that has leaded the country to ask for external financial assistance. The global crisis context and, in particular the country´s high debt levels, both public and private, is probably behind the agents' preference for shorter maturities since the involved risks are lower for both parts (the buyer and the seller). Therefore, there is evidence that arbitrage activities force CDS and bonds spreads to converge in the 2-years segment.
4.2 Who’s leading the price determination?
The price discovery is a critical issue in financial markets functioning and extremely vulnerable to external shocks to markets. To compute the markets' contributions to price discovery, we estimate autoregressive distributed lag models with error correction mechanism and follow the approach detailed in Gonzalo and Granger (1995) according to which the leading market adjusts the least to price movements in the other market.
The ARDL_ECM models can be expressed by the following expressions: ∆𝐶𝐷𝑆𝑡= 𝛼1 𝐸𝐶𝑡−1+ ∑𝑛 𝛽1𝑗∆𝐶𝐷𝑆𝑡−𝑗
𝑗=1 + ∑𝑛𝑗=0𝛾1𝑗∆𝑇𝐵𝑡−𝑗+ 𝜀1𝑡 (2)
∆𝑆𝐵𝑡 = 𝛼2 𝐸𝐶𝑡−1+ ∑𝑛 𝛽2𝑗∆𝐶𝐷𝑆𝑡−𝑗
𝑗=0 + ∑𝑛𝑗=1𝛾2𝑗∆𝑇𝐵𝑡−𝑗+ 𝜀2𝑡 (3)
where 𝜀1𝑡 and 𝜀2𝑡 are i.i.d. shocks; 𝛽𝑖𝑗, 𝑖 = 1, 2 are short-run multipliers; 𝛼𝑖, 𝑖 = 1, 2 are the
coefficients of the error correction terms; and 𝐸𝐶𝑡−1 represent the error correction term and it corresponds to the last period's deviation from the long-term equilibrium. Therefore, it consists on the lagged residuals of the cointegration regression given below:
𝐶𝐷𝑆𝑡= 𝛿0+ 𝛿1𝑇𝐵𝑡+ 𝑢𝑡, 𝑢𝑡~𝑁(0, 𝜎2) . (4)
That is, 𝐸𝐶𝑡−1= 𝐶𝐷𝑆𝑡−1− 𝛿0− 𝛿1𝑇𝐵𝑡−1 .
We specify both models (2) and (3) with the optimal number of lags for each cointegrating relation. If the TB market is contributing significantly to price discovery of the credit risk, then the CDS market will adjust imediatelly and therefore 𝛼1 will be negative and statistically significant. Similarly, if the CDS market is leading the price discovery process, then 𝛼2 will be positive and statistically significant. Finally, if both coefficients are significant, then both markets contribute significantly to price discovery. To measure the relative contribution of the two markets to price discovery we use the Gonzalo-Granger measure defined by the ratio 𝛼2
𝛼2−𝛼1. (See Gonzalo and Granger 1995).
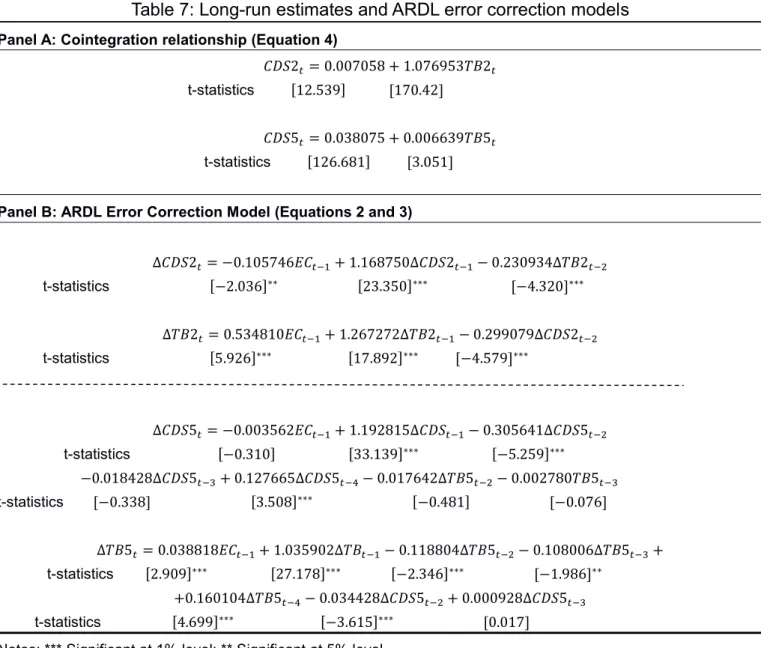
Table 7: Long-run estimates and ARDL error correction models
Panel A: Cointegration relationship (Equation 4)
𝐶𝐷𝑆2𝑡= 0.007058 + 1.076953𝑇𝐵2𝑡
t-statistics [12.539] [170.42]
𝐶𝐷𝑆5𝑡= 0.038075 + 0.006639𝑇𝐵5𝑡
t-statistics [126.681] [3.051]
Panel B: ARDL Error Correction Model (Equations 2 and 3)
∆𝐶𝐷𝑆2𝑡= −0.105746𝐸𝐶𝑡−1+ 1.168750∆𝐶𝐷𝑆2𝑡−1− 0.230934∆𝑇𝐵2𝑡−2 t-statistics [−2.036]∗∗ [23.350]∗∗∗ [−4.320]∗∗∗ ∆𝑇𝐵2𝑡= 0.534810𝐸𝐶𝑡−1+ 1.267272∆𝑇𝐵2𝑡−1− 0.299079∆𝐶𝐷𝑆2𝑡−2 t-statistics [5.926]∗∗∗ [17.892]∗∗∗ [−4.579]∗∗∗ ∆𝐶𝐷𝑆5𝑡= −0.003562𝐸𝐶𝑡−1+ 1.192815∆𝐶𝐷𝑆𝑡−1− 0.305641∆𝐶𝐷𝑆5𝑡−2 t-statistics [−0.310] [33.139]∗∗∗ [−5.259]∗∗∗ −0.018428∆𝐶𝐷𝑆5𝑡−3+ 0.127665∆𝐶𝐷𝑆5𝑡−4− 0.017642∆𝑇𝐵5𝑡−2− 0.002780𝑇𝐵5𝑡−3 t-statistics [−0.338] [3.508]∗∗∗ [−0.481] [−0.076] ∆𝑇𝐵5𝑡= 0.038818𝐸𝐶𝑡−1+ 1.035902∆𝑇𝐵𝑡−1− 0.118804∆𝑇𝐵5𝑡−2− 0.108006∆𝑇𝐵5𝑡−3+ t-statistics [2.909]∗∗∗ [27.178]∗∗∗ [−2.346]∗∗∗ [−1.986]∗∗ +0.160104∆𝑇𝐵5𝑡−4− 0.034428∆𝐶𝐷𝑆5𝑡−2+ 0.000928∆𝐶𝐷𝑆5𝑡−3 t-statistics [4.699]∗∗∗ [−3.615]∗∗∗ [0.017]
Notes: *** Significant at 1% level; ** Significant at 5% level. Source: Authors' calculation.
The estimates for the long-term relationship (Panel A) reveal positive and statistically significant coefficients for TB spreads in both maturities, which suggests that increases of TB spreads generate increases of CDS prices. Panel B reports the results of the ARDL-ECM models’ estimation with error correction mechanisms for the 5-years maturity segment, over the period until August 4, 2010 and for the 2-years maturity segment, over the period after September 29, 2010. The Akaike Information Criterion was used to determine the number of lags.
In the 5-years segment, only CDS prices impact TB spreads, in the short-run. We also notice that 𝛼2 is positive and statistically significant, while 𝛼1 is not statistically significant. This suggests that the CDS market leads in both short- and long-run. It generates
significant impacts on the TB market in the short-run and contributes significantly to price discovery at the 5-years maturity segment. The estimated value of 0.0388 of the coefficient of the error correction term indicates that the adjustment toward long-run equilibrium takes roughly 25.8 days to be completed.
With the crisis, this long-run relationship in the 5-years maturity segment is broken down and it is observed a closer relationship between the two markets in both short- and long-run in the 2-years maturity segment. All the short-long-run multipliers in both equations are significant, which suggests that there are directional effects between markets. This bi-directional linkage is also observed in the long-term. In fact, the coefficients of the error correction terms are significant in both equations. On the one hand, 𝛼1 is negative which suggests that the TB market contributes significantly to price discovery. But, on the other hand, 𝛼2 is positive which suggests that the CDS market also performs a relevant role in risk pricing. Therefore, it seems that the crisis has strengthened the interactions between the CDS and TB markets in shorter maturities. However, the computed value of the Gonzalo-Granger measure is 0.835 which indicates that the influence of the CDS market in price discovering seems to be dominant. The CDS market leadership explains the faster adjustment process in the TB market to shocks in prices. The parameters estimates lead to the conclusion that the adjustment of the CDS prices to a shock in the TB market will take roughly 9.5 days, while the adjustment of the TB market to shocks in the CDS market is faster.
4.3 Comparison with previous studies
The comparison of our results with other studies’ is not direct. The difficulty is motivated by the adoption of different estimation methodologies and datasets spanning different periods, or even the adoption of different maturities. Notwithstanding these aspects, our results provide additional insights on the relationship between markets, which were not highlighted in previous research. First, the evidence that the crisis has strengthen the relationship between markets at shorter maturities both in the short- and the long-run. This result may be observed in other high indebted countries and not exclusive to Portugal5. Second, the
evidence of the increase of the bonds market role in price determination during distress periods had not been clearly stated in the literature. Several papers provide evidence that the CDS market dominates the price determination during bearish times, but do not provide evidence of the increasing role of the bonds market6.
5 This issue will be object of future research.
5 Conclusions
This paper analyses the relationship between the Portuguese TB yields spreads (over the German Bund) and their associated CDS premiums in the context of the 2007 financial crisis. This applied work focusing on the Portuguese economy represents a contribution to the literature and complements the knowledge on this issue provided by other studies. This study uses daily observations of CDS premiums and TB yields spreads covering the period from May 1, 2007 to October 7, 2011, and therefore it includes the moment the crisis irrupted in the country. The analysis highlights changes in both 2- and 5-years maturity segments. On another hand, regime changes motivated by the financial and economic downturn are fully considered.
The results are quite informative on some aspects. First, we demystify the idea that the series are I(1), often considered in previous studies. The crisis dictated a change in this paradigm. Second, we didn’t find a long-run relationship over the sample period, contrarily to previous studies. Third, the analysis for each sub period reveals mixed results. There is cointegration in the 5-years segment before 2010 and in the 2-years segment after 2010. It seems that the country’s arbitrage opportunities across the markets in the 5-years segment cannot longer be exploited because of the market frictions of technical factors. Instead, arbitrage behavior has been strengthened in shorter maturities, which seem to be preferable over unstable periods. We believe that with the deepening of the crisis there was an increase in the relevance of idiosyncratic factors in determining the spreads reflecting both the adverse developments in sovereign credit risk and deteriorating liquidity conditions, but also the fact that markets have gone to penalize more the interest rates of countries with major macroeconomic imbalances and/or less liquid sovereign debt markets. Regarding to the price determination, we found a dominant role of the CDS market before 2010, both in the short- and long-run, which is consensual with other aaplied studies’ to other countries. In fact, price discovery occurs in the most liquid market and in mature markets the CDS market is more liquid than the bonds market.
However, our results also suggest an increase of the TB market’s role in price determination after 2010, which stands in sharp contrast to other empirical studies. The role of the bond spread as a credit risk information provider has therefore increased during the crisis and, especially, in periods of huge global uncertainty, like in aftermath of the collapse of Lehman Brothers.
Overall, CDS markets help enhance financial stability by providing a mechanism to hedge sovereign risks. We find no evidence to support the concern that CDS markets may be less effective than government bond markets in reflecting economic fundamentals. Nevertheless, the role of sovereign bonds in anticipating risks should not be ignored, in particular in periods of financial distress.
This evidence on the leading role played by the CDS market in the price discovery process does not necessarily imply that the prices of government bonds can be manipulated by trading in the CDS market. In order to minimize this risk implanting regulatory responses, based on constraints or restrictions on CDS transactions, appear to be of dubious effect. They may result in a reduction of liquidity of the CDS market which, in turn, may have a negative impact on the regular functioning of the government bond market. Perhaps obligations of post-trade transparency could instead mitigate the potential destabilizing effects that can be generated by CDS trading.
Although the results reported in this study are exclusively to Portugal, we believe that they constitute valuable information for national and also international financial agents, given that international capitals mobility among economies provides opportunities to markets to converge and thereby to exhibit similar behavior patterns. Nevertheless, further research on this issue is timely.
References
Aktug EA, Vasconcellos G, Bae Y (2012) The dynamics of sovereign credit default swap and bond markets: empirical evidence from the 2001 to 2007 period. Applied Economics Letters 19:251-259. http://dx.doi.org/10.1080/13504851.2011.572839
Alexopoulou, I, Andersson, M. and Georgescu, O. M. (2009) An empirical study on the decoupling movements between corporate bond and CDS spreads, Working Paper Series No. 1085, European Central Bank. Ammer J, Cai F (2011) Sovereign CDS and bond pricing dynamics in emerging markets: does the
cheapest-to-delivery option matter?. Journal of International Financial Markets, Institutions and Money 21:369-387. http://dx.doi.org/10.1016/j.intfin.2011.01.001
Andenmatten S, Brill F (2011) Did the CDS market push up risk premia for sovereign credit?. Swiss Journal of Economics and Statistics 147:275-302.
Blanco R, Brennan S, Marsh IW (2005) An empirical analysis of the dynamic relation between investment-grade bonds and credit default swaps. Journal of Finance 60(5):2255-2281. http://dx.doi.org/10.1111/j.1540-6261.2005.00798.x
Calice, G., Chen, J. and Williams, J. (2013) Liquidity spillovers in sovereign bond and CDS markets: an analysis of the Eurozone sovereign debt crisis, Journal of Economic Behavior and Organization, 85:122-43. http://dx.doi.org/10.1016/j.jebo.2011.10.013
Carboni, A. (2011) The sovereign credit default swap market: price discovery, volumes and links with banks’ risk premia, Working Paper No. 821, Banca d’ Italia Eurosistema.
Chan-Lau JA, Kim YS (2004) Equity prices, credit default swaps, and bond spreads in emerging markets. IMF Working Paper WP/04/27. http://dx.doi.org/10.5089/9781451844559.001
Delatte AL, Gex M, López-Villavicencio A (2012) Has the CDS market influenced the borrowing cost of European countries during the sovereign crisis?.Journal of International Money and Finance 31: 481-497. http://dx.doi.org/10.1016/j.jimonfin.2011.10.008
Delis M D, Mylonidis N (2010) The chicken or the egg? A note on the dynamic interrelation between government bond spreads and credit default swaps. Finance Research Letters 8:163-170. http://dx.doi.org/10.1016/j.frl.2010.09.005
Fontana A, Scheicher M (2010) An analysis of euro area sovereign CDS and their relation with government bonds. European Central Bank Working Paper Series No. 1271.
Forte S, Peña JI (2009) Credit spreads: an empirical analysis on the informational conten of stocks, bonds, and CDS. Journal of Banking and Finance 33:2013-2025. http://dx.doi.org/10.1016/j.jbankfin.2009.04.015
Gonzalo J, Granger CWJ (1995) Estimation of common long-memory components in cointegrated systems. Journal of Business & Economic Statistics 13:27–35.
International Monetary Fund (2015) Global financial stability report, old risks, new challenges, April.
Kouretas, G and Vlamis, P. (2010) The Greek crisis: causes and implications, Panoeconomicus, 4:391-404. http://dx.doi.org/10.2298/PAN1004391K
Levy, A. (2009) The CDS bond basis spread in emerging markets: liquidity and counterparty risk effects. Available at http://econ.haifa.ac.il/~todd/seminars/papers0809/CDS%20Paper%20%28draft%29.pdf (accessed 25 November 2014).
Longstaff, F., Mithal, S. and Neis, E. (2005) Corporate yield spreads: default risk or liquidity? New evidence from the credit default swap market, Journal of Finance, 60:2213-53. http://dx.doi.org/10.1111/j.1540-6261.2005.00797.x
Pesaran MH, Shin Y, Smith RJ (2001) Bounds testing approach to the analysis of level relationships. Journal of Applied Econometrics 16:289-326. http://dx.doi.org/10.1002/jae.616
Pesaran MH, Shin Y (1999) An autoregressive distributed lag modelling approach to cointegration analysis. In: S. Strom (ed) Econometrics and Economic Theory in the 20th Centrury: The Ragnar Frisch Centennial Symposium, Cambridge University Press, Cambridge. http://dx.doi.org/10.1017/CCOL521633230.011
Pesaran MH, Shin Y, Smith R J (1996) Testing for the existence of a long-run relationship. DAE Working Paper No 9622.
Phillips PCB, Perron P (1988) Testing for a Unit Root in Time Series Regression. Biometrika 75(2):335–346. http://dx.doi.org/10.1093/biomet/75.2.335
Zivot E, Andrews DWK (1992) Further Evidence on the Great Crash, the Oil-Price Shock, and the Unit-Root Hypothesis. Journal of Business & Economic Statistics 10(3):251-270.