Games development:
contribution to interactive infographics from a design perspective and methods.
David PEREIRA NETO
1, Flavio Anthero Nunes dos SANTOS
21
Universidade do Estado de Santa Catarina
2Universidade do Estado de Santa Catarina
ABSTRACT
The objective of this work is to look in the games production and development bibliography methods or steps that can be adapted to the design of digital interactive infographics production. As a projectual practice based in products development methodologies (physical and/or communicational) and information systems, design will be used in this work in order to aggregate the methods and steps found in a single methodological approach. Despite the interaction design is directly attached to both areas, it is the understanding that an open method without predefined sequential steps, serves better the proposal of unite these different areas of knowledge and create a greater integration between different professionals, needed to produce such pieces.
KEYWORDS
Infographic, Design, Games, Methodology.
1.
INTRODUCTIONThe incorporation of interactive tools leads to a paradigm change in the view of information (CAIRO, 2008 and 2011). The convergence of media in an hypertextual environment, especially interactive, enhances the possibility of readers to interact with the information, designing their own information according to their preference or necessity (CAIRO, 2008, p.16).
Cairo (2008, p.68) states that the infographics in digital media is no longer a static data presentation but a tool. According to him, "the visual journalist [infographics producer] no longer interpret data for the reader but provides the tools that the reader can use to uncover the truth for himself." (Idem).
The interaction, exchange of information between an user and a system or device, can occur in three graded levels1 (Cairo, 2008, p.70). The instruction, in which the user indicates by buttons what the device
should do; the manipulation, a type of improved instruction, in which the user can change the characteristics of certain objects in the virtual world, such as size, color, position etc.; and exploitation, a
1 The author based on the work of PREECE, ROGERS e SHARP to stipulate these interaction levels. Cf. PREECE, Jenny; ROGERS,
type of manipulation in which readers have an apparently absolute freedom to move around in a virtual environment. Apparently because the users' freedom on the view of information is always simulated, i.e., it is the designer who decides what the reader will see (CAIRO, 2008 p.71-‐75).
The first two modes of interaction are the most currently used in digital computer infographics. Because the examples of exploitative infographics are scarce, Cairo (2008 p.75) presents two famous games2 as
examples of interaction by exploration: World of Warcraft and Dungeons & Dragons Online.
What allows the player to take control of the characters, navigate the environment and make decisions in the game is the interface (NOVAK, 2010, p. 237). Its invisible elements are the controls, keys and mouse, used to sort the player's actions. The visible elements are the features shown on the screen, information considered relevant to the decisions of the players. (NOVAK, 2010, p. 239).
The interface with a virtual world is the main similarity between these two areas: digital games and computer infographics. A design method, discipline that studies the design of interfaces and its manipulation by users, is understood here as the most suitable for converging the different areas in a single production proposal. As pointed Bonsiepe (1997, p.145), "in the virtual reality everything is interface, everything is design." Virtual reality is the "climax of design, because the interface covers everything." (Idem)
The study will look into authors who discuss the games development and their techniques to produce virtual reality (NOVAK, 2010; SHCUYTEMA, 2008; BEHTKE, 2003), contributions that the games development and more specifically its production stages can to the digital infographics production.
Finally, to propose the Unfolding Method in 3 Steps (SANTOS, 2005) as a way to involve all the features necessary for producing such digital pieces. The choice of methodological bias follows the Santos (2005, p.13) understanding: "design method is the set of logically ordered tasks and activities that are the basis and direction for the development of the project, causing it to be systematic and able, reducing uncertainties and increasing the efficiency of the developed work".
2.
DESIGN -‐ INTERFACE AND METHODOLOGYEvery interface "should allow the user to get an overview of the content, surf the mass of data without losing direction and eventually move into the informational space according to his interests." (Bonsiepe, 1997, p.59). According to the author, design figures as a methodological practice that makes the connection between user and tool and action (Bonsiepe, 1997, p.12). This action can be instrumental -‐ use of physical products -‐ or communicative -‐ use of signs, information. The space in which it is structured the interaction between body, tool -‐ sign or object -‐ and purpose of the action, Bonsiepe calls interface, which is exactly the central domain of design.
Among the guidelines for a good game interface (NOVAK, 2010, p.267) are: consistency; hotkeys; feedback providing; defined tasks; easy cancellation of actions; provide means of control to the player, simplicity, personalization features (of interface aspects); include a context-‐sensitive pointer (which changes shape when pointed to an object of interest); implement different modes and; using established conventions.
2 The term game is utilized here to denominate specifically the electronic games. The choice for this term is due to the large use of
Cairo (2008) builds on the basic interaction principles, established by Donald Norman3, to define the
demands of an interactive infographic: visibility, feedback; affordances, or the quality of an object that allows the user to perform actions; constraints and; consistency.
The similarities between the interfaces requirements in both areas are not random, since both rely on design theories and cognitive psychology to define these requirements.
3.
PRODUCTION STAGESDesign method is a set of tasks that serve to guide the projects development. Santos (2005, p.55) examines seven design methods by different authors, demonstrating the central importance of the method for the projectual process of design.
In the games area, the development methods are not always present in the production process (BETHKE, 2003; NOVAK, 2010; SCHUYTEMA, 2008). It is a common practice for developers not to use ordered steps of pre-‐production and start programing the games without the full pre-‐defined structure. This can result in poorly developed games without well-‐defined target audience, for example, resulting thus in market failures. As a way to prevent market and software programming mistakes, the authors present some steps for games developing, generally divided into concept, pre-‐production, prototype, production, alpha stage, beta stage, gold stage and post-‐production (idem). The application of development methods also provides a better understanding among members of the production team.
The production of digital interactive infographics should also consider good communication between members of different knowledge areas such as software programming, design and journalism.
The following is a summary of the main steps of games development found in Novak (2010). The author presents steps similar to other researchers in this area (BETHKE, 2003; SCHUYTEMA, 2008).
Concept: creating the idea of the game. The goal is to decide what constitutes the game and convey that idea to others in writing, identifying the target audience, evaluating company resources and identifying a concept that is attractive to developers and has a potential market (NOVAK, 2010, p .340).
Pre-‐production: attracted the interest of investors, begins the development planning, which results in the creation of the game design document (NOVAK, 2010, p.341). This will be used as a reference guide, so that team members can understand their roles during the production process. It will change almost daily, as the project evolve (NOVAK, 2010, p.374).
Prototype: The prototype can be an item of operating software that captures in the screen the essence of what makes the game special, or a low-‐fidelity exemplary, in paper, but that serves to test it, to ensure that the game mechanics is flawless and the game is fun and attractive (NOVAK, 2010, p. 342). One can also recruit testers of the specific target audience to test it yet at that stage.
Production: approved the prototype, the development team enters the most extensive phase, when the game is effectively developed, which can last from 6 months to 2 years (NOVAK, 2010, p.347). So that there are no unforeseen events during production, it is important that the preceding phases have been well developed.
Test stage -‐ alpha: stage at which a game can be played from beginning to end. Maybe there are some gaps and artistic elements not definitive, but the engine and the user interface are complete. If there are details
that need to be abandoned to meet deadlines release, this is the time to do it. Gameplay testers are incorporated into the team to locate problems (NOVAK, 2010, p.347).
Test stage -‐ beta: In this phase all materials are incorporated into the game and the production process is ended. The beta phase aims to stabilize the project and eliminate the greatest number of defects before the product begins to be sold (NOVAK, 2010, p.348).
Phase gold: after administration and database defects agree that it is ready, the game goes to manufacturing, where the media is produced and packaged. In this stage, the game is marketed. In case of games digitally distributed, phase of manufacture is completely eliminated (NOVAK, 2010, p.349).
Post-‐production: during the post-‐production, several subsequent versions may also be launched to replace and improve the original game, increasing their longevity. Corrections can also be applied to solve programming flaws noticed lately (NOVAK, 2010, p.350).
The steps of game development resemble some of the design methods. In the analysis of seven different methods, Santos (2005, p.67) concludes that "it is a common factor the division into three specific moments: the activities that need to be developed before the creation of the product itself (1); the creation (2); and everything that has to be done after the product is created (3)”. Five of the seven analyzed methods did not address marketing issues in the stages of product development (SANTOS, 2005, p.69), which is considered fundamental to the realization of a concept game (Bethke, 2003; NOVAK, 2010; SCHUYTEMA, 2008). In the methods of Baxter (1998 apud SANTOS 2005) and Pugh (2002 apud SANTOS 2005) the demands definition of the products and services depart from the market, while in the area of games, the market operates mostly as a approval requirement production for a preconceived idea.
Unrelated to market needs are the stages of interactive infographics production proposed by Cairo (2008), which for requiring too much execution runtime considering the journalistic context in which they are inserted, follow less the market demands. In cases of printed infographics, produced in a more agile way, the demand usually arises in meetings between editorial and infographics staff.
For digital infographics, Cairo (2008) presents the following steps.
Purpose: to define the objectives of the presentation, the story one wants to tell and what tools will be used for this. Then the way which how each section of the infographic will be available must be defined, what resources will be used, and the size of the staff needed for production (CAIRO, 2008, p.88).
Information: to consult experts and bibliographies about the information presented. Sketches are made to help the team to imagine the appearance of the final presentation (CAIRO, 2008, p.90).
Planning: obtained the necessary data, the shape is began. In linear presentations, a storyboard with comics aspect is the most appropriate to organize the information sequentially. On graphics with multiple levels of navigation, it would be required a storyboard with a tree shape. It is recommended to perform a second version of the storyboard, more refined, using graphics softwares in which the infographics will be produced,to get an idea of the final result (CAIRO, 2008, p.90).
Execution: once the infographic is planned, a preliminary script with the list of contents inserted is conducted and a detailed storyboard presentation, begins the production process. This is the step that will take longer to finish, with the ready infographic as result (CAIRO, 2008, p.93).
Cairo calls attention to the fact that these steps are not watertight, and the boundaries between them are quite porous. Nothing prevents that a data discovered after the information stage is closed to be added to the infographic during the planning. (CAIRO, 2008, p.90)
This flexibility in the steps is the Santos proposal (2005) as he develops an open method for design, without "pre-‐established paths to be followed" (SANTOS, 2005, p.9). The author defines open method as "one whose structure encourages interference during the project, causing steps to be added, removed, and/or deployed according to specific objectives." (Idem)
Despite suggested by authors the possibilty of changing or rewinding the stages previously terminated, the sequential structure of the games methods and infographics can stiffen the creative and multidisciplinary process of these productions. "A design method that has a flexible structure without a beginning, middle and end preset, can be a catalyst for knowledge (Magalhaes, 1995 apud SANTOS, 2005, p.8) from different areas [...], enabling an integrated and interdisciplinary work".
In the steps suggested by Cairo, there is not a concern with the interactive infographic interface and its relationship with the user for which it is designed. The author discusses the characteristics of interaction, manipulation and the requirements for a good interface, but its creation process does not provide usability testing, similar to game development. If the future of interactive infographics is the one of an increasingly tooling product, it is necessary for the production process of them the insertion of testing and prototyping phases, validating before users of the target audience the "playability" of these exploratory infographics. However, inserting these steps as required in the infographics development would stiffen these methods, as already discussed in the study.
4.
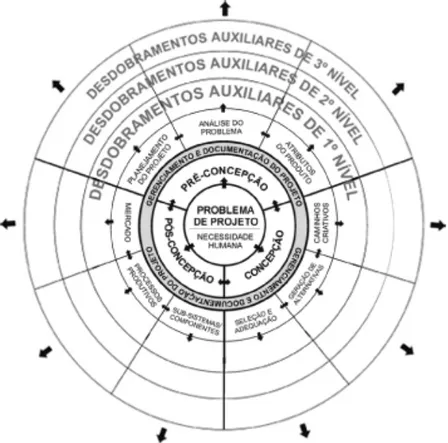
USE OF MD3E – UNFOLDING METHOD IN 3 STEPSPresented by Santos (2005) for use in teaching industrial design, MD3E (Figure 1) was designed to receive interference in its structure during the project, making richer the teaching-‐learning process. However, the author considers the possibility of applying it in the professional market.
Graphically represented by a radial structure, which can be expanded to the extent that the interferences are performed, the method has its starting point in the central base: definition of the problem to be solved (SANTOS, 2005). Defined the problem, begin the subsequent developments divided into three main stages: pre-‐design, design and post-‐design (SANTOS, 2005, p.77). There is no indication of a sequence to be followed, and it may be started from various work areas simultaneously. Management and documentation are two activities that should permeate all the work, and appear shortly after the basic steps.
The author establishes a minimal unfolding for each basic step. However, interferences in the method can already happen since the minimum unfolding, expanding or changing them according to the specific needs of each project (SANTOS, 2005, p.79).
The fact of MD3E unfolds according to the needs of each project, makes it an ideal method to meet the demands for a interactive infographics production process. This is because the development of an infographic that allows only the basic level of interaction, i.e., instruction, has different demands and requirements from a infographic project on the level of exploitation interaction. As suggestions of other unfoldings not anticipated in the infographics prodction method can be presented: questions about the requirements of the target audience and socio-‐anthropological characteristics; technological level concerns; ethical issues; and even marketing issues once it is still unclear the cover of digital and interactive infographics; as well as the testing phases previously mentioned.
5.
CONCLUSIONPor considerar a mecânica e interface dos games um destino provável dos infográficos interativos, o estudo For considering the game mechanics and interface a likely destination of interactive infographics, the study sought in the games development method, steps that could bring new features to the interactive infographics. It was observed mainly in the prototyping and testing stages, in which the games, their gameplay and the user perspective are evaluated, processes that can bring out new features to interactive infographics.
To integrate these and other steps in the infographics developments, the study presented the MD3E. The method, which naturally enables a continuous improvement process on the production techniques, seems to be ideal to bring new perspectives and multidisciplinarity to the infographics area.
As a proposal for future studies, the implementation and evaluation of the MD3E in an interactive infographic production process, comprising the testing and prototyping steps.
6.
REFERENCESBONSIEPE, G. Design: do material ao digital. FIESC/IEL: Florinaópolis, 1997
BETHKE, E. Game development and production. Plano: Wordware Publishing, Inc, 2003.
CAIRO, A. Infografía 2.0: visualización interactiva de información en prensa. Madrid: Alamut, 2008. CAIRO, A. El arte funcional: infografía y visualización de información. Madrid: Alamut, 2011. NOVAK, J. Desenvolvimento de games. São Paulo: Cengage Learning, 2010.
SANTOS, F. A. N. V. MD3E (Método de Desdobramento em 3 Etapas): Uma Proposta de Método Aberto de Projeto para Uso no Ensino de Design Industrial. Tese de doutorado – PPGEP-‐UFSC. Florianópolis, 2005.