TECHNOLOGY’S INFLUENCE IN HRM IN HOSPITALITY
Sebastian Pereira Clemente Müller
Dissertation submitted as partial requirement for the conferral of Master in Hospitality and Tourism Management
Supervisor:
Doutor Nelson Campos Ramalho, Assistant Professor, ISCTE Business School, Department of Human Resources and Organizational Behavior
Acknowledgements
I would first like to thank my thesis advisor Assistant Professor Campos Ramalho of the ISCTE Business School at Instituto Universitário de Lisboa. Not only for his patience but also for the fact that the virtual and physical door to Prof. Campos Ramalho’s office was always only a click or a knock away and for that I would like to thank him personally.
I would also like to thank the industry’s professionals who answered my survey, with passionate participation and input.
Finally, I must express my very profound gratitude to my parents for having provided all the necessary means and support throughout the thesis.
And, last but not least, I would like to thank my girlfriend and my wife for always pushing me forward and for never letting me give.
Abstract
The critical role technology plays in hospitality HRM is widely acknowledged but published quantitative empirical research is still modest. This study is set to contribute, albeit in an exploratory fashion, to extant knowledge in this domain by applying a revised version of the Technology Acceptance Model (TAM, Davis, 1989) crossed with Fishbein & Ajzen’s (1975) Theory of Reasoned Action. The full model includes two relevant HRM variables in hospitality: job satisfaction and intention to quit.
PLS-SEM analysis with a sample of 61 selected hospitality professionals showed a model with high Tenenhaus goodness of fit (.465) explaining on average 30% variance. Overall TAM variables acted as expected suggesting technology acceptance is critical in increasing job satisfaction and preventing intention to quit amongst these professionals. The model offers a theoretic contribution as a moderator effect of social norm was found calling for further TAM refinement.
Keywords: Hotel Management, Technology, Human Resources, Job satisfaction, TAM, employee turnover
Resumo
O papel crítico que a tecnologia desempenha na GRH em hotelaria é consensualmente reconhecido mas o volume de investigação desenvolvida em torno deste tema é ainda modesto. Este estudo procura contribuir, de forma exploratória, para o conhecimento neste domínio por via da aplicação do Modelo de Aceitação da Tecnologia (TAM) de Davis (1989) revisto com base no modelo da Ação Planeada de Fishbein & Ajzen (1975) num processo que integra a satisfação no trabalho e a intenção de saída em contexto hoteleiro.
Com uma amostra de 61 profissionais da hotelaria selecionados testámos um conjunto de hipóteses por via de PLS-SEM que evidenciaram um modelo com bons indicadores de validade, com elevado índice de ajustamento de Tenenhaus (.465) e explicando em média 30% da variância. O TAM funcionou como esperado e evidenciou que a aceitação da tecnologia é um elemento crítico para aumentar a satisfação no trabalho e para reduzir a intenção de saída voluntária destes profissionais. O modelo oferece um contributo teórico dado que foi encontrado um efeito moderador da norma social sugerindo a necessidade de desenvolvimento do TAM.
Palavras-chave: gestão de hotéis, tecnologia, recursos humanos, satisfação no trabalho, TAM, rotatividade externa
I
Index
Index ... I Graph index ... II Figure index ... III Acronym glossary ... IV
Introduction ... 1
Literature Review ... 3
Upgrading organizations: Technology ... 3
Technology and Hospitality ... 7
HRM and Hospitality ... 8
Technology and HRM ... 10
Technology, HRM and hospitality ... 10
TAM ... 11
Method ... 17
Data analysis strategy ... 17
Measures ... 18
Procedure ... 20
Sample ... 20
Results ... 23
Limitations and future studies ... 25
Discussion and conclusion ... 27
References ... 29
Annex ... 35
II
Graph index
III
Figure index
Figure 1 - Research Model ... 15 Figure 2 - Hypothesis: H1a to H7 ... 23
IV
Acronym glossary
ATU – Attitude toward use BI – Behavioral Intention GoF – Goodness of Fit H – Hypothesis
HRM – Human Resource Management IT – Information Technology
ITinfras – IT Infrastructure ITQ – Intention to quit
PEOU – Perceived ease of use PU – Perceived usefulness Satisf – Job Satisfaction
TAM – Technology acceptance model NORM_OTH – Social norm
1
Introduction
Every industry needs certain levels of technology and hospitality has been increasing its technological dependence due to higher efficiency seeking (reduce costs and increase productivity) and improving processes.
In service industries such technological interface is vital to ensure a parallel growth with the employee’s soft skills that make up for the way of living for kind of industry. There are however also risks associated with it, if the technology is not up to date or the staff is not prepared or willing to use it, bigger problems can arise, just as higher employee turnover that might create a snowball effect of inefficiency. This and other issues are one of the main challenges hospitality industry faces.
The purpose of this research proposal is thus to explore to what extent technology features can influence employee loyalty and intention to turnover in the hospitality industry on the basis of the Technology Acceptance Model (Davis, 1985). This led us to question: What role does technology play in employee turnover intention and motivation within hospitality industry?
In order to answer this research question, the study is designed to test empirically an adapted version of the Technology Acceptance Model (TAM) extending it to job satisfaction and turnover intention. The structure of the thesis will comprehend a literature review specifically focused on hospitality technology, to analyze trends and how technology might affect employee loyalty and turnover intention as well as a description of the methodological apparatus and main empirical findings on a selected sample, reaching out to the hotel industry in Portugal and abroad to cover diverse contexts.
3
Literature Review
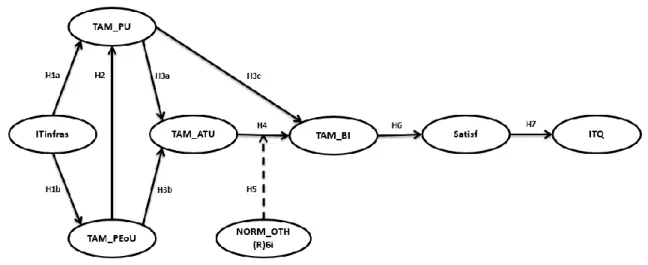
Literature review follows by approaching technological advancements and the role of Information Technology (IT) in organizations at large and in the hospitality industry in particular. Once the ubiquity of IT in hospitality is shown we further explore literature on HRM in hospitality as well as literature on technology and HRM sum up the implications for HRM (both benefits and shortcomings) in hospitality due to technological options. We specifically dedicate a section to the Technology Acceptance Model due to its widespread use in human-technology interface and its appropriateness to service industry. After conducting the literature review, we present the research model with the respective hypotheses that comprehends extant knowledge.
Upgrading organizations: Technology
The complexity of contemporary organizational structures and business puts pressure on managers to assure the integration of the many diversified elements that operate in order to offer an effective answer to market needs. The more diverse is the market, the more complex becomes the organizational structure. Therefore, in large transnational corporations, there is no other way to guarantee the integration of such complexity other than relying on information systems able to monitor, process and generate actionable information to the decision makers. Information technologies are thus a necessity, not an option. However, to realize its integrative potential, IT systems must be adequately designed, implemented and managed (Sajid, Muhammad, & Amjad, 2014).
Politicians in the modern western world blame a management strategy, to outsourcing: to move their labor to underdeveloped countries, for the job loss in their countries, regions, however it is not actually the reason why jobs are disappearing as outsourcing is not even responsible for 6% of the job loss in Europe (Rifkin, 2005). There are less and less jobs in the modern work because they are being replaced by technology. Rifkin mentions in his book that the biggest change on this topic recorded to date was the industrial revolution, in which slave-like labor ended and technology took its place. Additionally, Rifkin mentions that labor started with people working in farms, when technology came they became manufacture workers and post-industrial revolution they moved to the service industry (Rifkin, 2005). The pattern seems to be a higher presence of technology in daily work.
4 Some argue that although technology has been evolving and that it has been spreading, we might be falling apart as a community (Sherry, 2012). Others try to understand if the need to have face-to-face conversations will impact the way cities are built / structured (Gaspara & Glaeserb, 1998). The undisputed fact is that technology is changing the world, for example, in the tourism industry customers used to go to the travel agent to get information or to book holidays, who were one of the main links between the tourism industry and the end consumer. Because of technology, customers simply can go online, or just use an app on the cell phone and get all the information and bookings without having to physically go anywhere. On one hand this changed the way we communicate interpersonally and on the other hand this turns a traditional travel agent’s job almost obsolete (Cheyne, Downes, & Legg, 2006).
This being said, technology has come to stay. Its full potential is presented when individuals accept technology as being both useful and easy to use (Davis, 1989). There are many different forms of how a company can benefit from IT. Studies have been made in which five forms were distinguished from all the other ones, making a competitive advantage through innovation, cost, alliance advantage, differentiation, and growth (Wiseman & MacMillan, 1984). This added value depends on linking IT to the organization core competencies, with IT reinforcing those capabilities, rather than challenging them.
Its effectiveness is not granted, it must be built. To be able to improve a company’s core capabilities with IT, one has to understand how to integrate the human technological interfaces. The specific factors that make this performance shift however were not fully understood until Ravichandran and Lertwongsatien’s (2005) study. These authors stated at that time (more than a decade ago) the theories about motives and processes (how and why theories) have been changing and that they were already in need for revision. So, before investing in IT, the firm capabilities and resources have to be analyzed in order to identify how to create a competitive advantage using IT. After identifying it, it is important to have the ability to invest in IT, but even more important than that is the way the company implements and uses IT, which is in the end what is going to give the company its competitive advantage (Ravichandran & Lertwongsatien, 2005).
Another aspect that should be taken into consideration is the level of improvement technology is going to bring the company. In that sense, one has to consider not only how fast a technology is going to be economically feasible but also that a technology that can improve and adapt to its environment might be more expensive at first but on the other hand it would have a higher value in the long-term impact in the company (Funk, 2015).
5 IT innovations have potential to change strategic and industry factors and it will differently impact the balance sheet across time. When deciding to invest in a system one has to understand at what cost it will help improve the company. This is called “switching cost”. Not to have any switching costs implies not investing in IT at all which will offer short term cost stability but a long term competitive disadvantage. However switching costs are only investments as long as competitors do not benchmark it which means any return on investment in IT is time-bounded (Ravichandran & Lertwongsatien, 2005).
When it comes to IT investment decision, companies just have to analyze how IT can provide them a better value for money. In the HRM department more and more companies are considering the benefits of e-HRM (Parry, 2011). Researchers argue that in order to HRM benefit from IT one needs to understand the level of task interdependency, cost of coordination and uncertainty thus improving the effectiveness and efficiency of the overall organization. After that IT will be able to improve the HR department by generating viable tactical value to the business activity (Wirtky, Laumer, Eckhardt, & Weitzel, 2016).
Studies diverge as regards outcomes from IT investment in relation to organizational performance. Some studies argue that the company’s ability to use IT enhances processes, performance and customer management capability (Mithas, Ramasubbu, & Sambamurthy, 2011), just as other studies show that IT investments improved the value on the customer’s side but had no impact on financial performance (Ravichandran & Lertwongsatien, 2005).
Investing in IT does not equal enhancing a company’s performance, if IT is not considered and managed like an asset it can become a waste of money and time. To be able to use IT correctly it has to be integrated with the company’s production, to be able to have the business processes streamlined or even to help create structured and dynamic management decisions (Ravichandran & Lertwongsatien, 2005). Companies have been investing in information systems for years expecting that would improve their firm’s performance, but some firms have made a better job on it than others simply by being able to identify how and why IT links with firm’s competitiveness (Ravichandran & Lertwongsatien, 2005).
Technology in general is a very vast topic, trimming it to what is being studied here, one can say that while some researchers believe that technology has already been studied immensely in the hospitality industry, other argue that it is an endlessly evolving topic. For example, over 17 years ago it was argued that, in the US, most hotels did not have a streamlined IT system installed in their properties (Siguaw, Enz, & Namasivayam, 2000). This resulted in many theories, but one of them prevailed over the others, stating that one of the major reasons for so many hotels to not be streamlined came from the willingness level to strategically accept
6 technology differentiated in numerous segments of this industry (Siguaw, Enz, & Namasivayam, 2000).
In a book that demonstrates the study of the banking and hospitality industry in the USA, UK and Germany, McKenney (1994) enumerated the top five reasons for companies to implement technology: a) to resolve an issue or a problem, b) to increase its capabilities, either individually or companywide, c) to expand their wingspan as well as d) to transform itself (enhance services or lower costs). Last but not the least companies use IT as a way e) to increase their competitive advantage.
When trying to manage the reaction to a problem, companies often choose to implement technology that only updates their current technology, its suitable skillset and resources. However, according to McKenney (1994) they should be looking at it from another perspective. The bigger picture, meaning that, instead of only reacting to a problem, companies should look into preventing future ones from happening. Taking a preventive stand instead of only reacting requires not only know-how on the matter but also a substantial financial basis (McKenney, 1994).
Apart from these overall factors, there is also the question of what the goal of implementing a technology is (Siguaw, Enz, & Namasivayam, 2000). For example, while a high ranked hotel might choose to implement technology to improve the customer’s experience, a low budget hotel might choose to implement technology to operate more efficiently or at a lower cost. This low budget mindset prevailed in the hospitality industry throughout the years, as technology was mainly used for cost reduction or productivity enhancement. However, at different levels of the hotel, as for example, at the guest service level, IT used to be forgotten. As mentioned, hotels invest in technology to solve problems/issues. To be able to solve a problem one must understand from where it came from. The most common problem hotels address by investing in technology relates to productivity, as it is one of the most developed and crucial areas of the hotel. Consequently, there are more seasoned professionals who can sell it at a reasonable price. As it is one of the most common problems hotels face, the sellers already evolved to being able to adopt the new technology to existing software, the employee’s common skillset and hotel assets (Siguaw, Enz, & Namasivayam, 2000). However, not all researchers agree with the solution of using technology to reduce costs, instead, they believe that technology, should be used as a way to improve a company’s value (Luftman & Brier, 1999).
If strategically implemented, technology changes companies’ level of differentiation, time of response, efficiency and cost of operations. Technology alone positively challenges a
7 whole organization to streamline both horizontally and vertically (Siguaw, Enz, & Namasivayam, 2000). Technology also enables virtual companies that operate at higher levels of cost efficiency due to the inexistent physical structure. For example, a shop on Main Street in a metropolis that solely stands for its walk-in business could be successful, but compared to an online shop, even if they share the same amount of capital, it will never be able to have the same profitability, as the cost would, most likely be incomparable.
Information can be more easily and steadily accessed through hotel technology-based streamlining. This might be beneficial to companies but eventually impact negatively on how consumers have access to information. Having access to more information can start creating distrust between hotel companies and their guests. This phenomenon appears, for example, through the use of direct and indirect distribution channels to promote and sell room/nights, at different rates. Studies have shown that rooms are, indeed, being sold for the same period of time at different rates depending on its distribution channel, one via a direct channel and the other through an indirect channel. The hotel, and therefore the direct channel, might even go as far as to guarantee that they practice the lowest price. However a fast web-check disproves it quickly, as a study found out, which emphasizes the distrust that can come from technology improvements (Demirciftci, Cobanoglu, Beldona, & Cummings, 2010).
Technology and Hospitality
Nowadays one can find Technology and Information systems everywhere. Who does not use their mobile device when commuting to work? Technology is almost omnipresent, including in hospitality industry, to the point of one not think about it too often. However from the customers’ side the way reservations are made changed immensely. 10 years ago a study was made in Australia stating that the consumer preferred to book their travels through a travel agent rather than online (Bogdanovych, Berger, Simoff, & Sierra, 2006). Since then the online booking market has been growing, as it benefits the consumer by paying for the trip beforehand and from anywhere there is an internet connection, to later on experience the trip physically and geographically in person (Peng, Xu, & Chen, 2013).
Every year, or even every few months a new computer system or mobile phone comes out and most people either dream or actually buy it as soon as they come out, choosing to have a brand new, for example, iPhone, than investing that money into something else, just to be the first or simply go with the flow. Companies face the same dilemma, ever so often a new
8 accounting, processing or any other kind of technology comes out. As referred to above that is where the switching cost comes from (Ravichandran & Lertwongsatien, 2005).
These types of cost can be exponentially multiplied if one does not implement it correctly making one lose money as it was the wrong or the not appropriate technology for that specific hotel. The potential of an Information System can work miracles in one hotel and be a complete disaster in another hotel, all depending of the hotels strategy towards IT in general. Some hotels are more prone to IT than others, and even the later differ in the commitment they make to the acceptance of IT (Camisón, 2000).
Another benefit from technology is the amount of knowledge it lets corporations create or keep track of. Instead of having to make reservations in a booklet or a physical folder, data can be stored online, making it easier to access and to process it in a bulk form for years to come. Managing this enriched data, the hotel gains a competitive advantage (Olsen, 2012), which allows it to grasp the bigger picture of itself and easily conduct a SWOT analysis.
Technology improvements in hospitality can occur in housekeeping department in which the housekeeper does not have to push the cleaning cart anymore as it is battery charged and therefore they can clean more quickly by not using that much body strength, or even reducing the muscle pain making the employee happier (Hostar, 2016), all the way up to, for example, upper management that can read email one after the other and organize their email folders only a click away, instead of reading through multiple letters. That way technology has also impacted hotels and its employees’ needs and demands making the employer asking for more from its employees. With further advancements this industry’s biggest challenge is the successful employee retention management (Hinkin & Tracey, 2000).
Retention management or how it is often called turnover rates is the most common dispute in the hospitality industry. There are several reasons for high turnover rates, e.g. employee’s age, working conditions, and overall salary (Ghiselli, La Lopa, & Bai, 2001), but to understand them more clearly one has to learn about its origins.
HRM and Hospitality
Studies have shown that employment practices changed immensely in the past century. After World War II job security was at an all-time high, yet by the end of the 20th century layoffs and temporary workers became the reality as a snowballing competitive environment led to a huge workforce reform (Bishop, Goldsby, & Neck, 2002).
9 In the hospitality industry temporary workforce is ever so often almost the only way employers are willing to operate. Comparatively in the hospitality industry the education level and training procedures have been rising, yet low salaries, almost no union movements, high turnover and accumulative human capital rates remain constant. There are HR practices that allow companies to counter negative issues (Davidson, Guilding, & Timo, 2006). The main human resources issue in the hospitality industry is the high turnover rates, particularly concerning hospitality managers, whose turnover rates go up to 80% just as some studies reported (Ghiselli, La Lopa, & Bai, 2001). From the company’s point of view, the adjustable workforce and employee leaving the company might seem like a gain for one, but on the other hand there is a decrease in the business’s performance. From the employee’s point of view turnover is more often than not at its high because of the need to adjust their schedule to the needs of the hotel, the amount of hours they work and the consistent low compensation. Forecasting the hospitality industry’s job stability shows a promising future as educated, young and willing employees are continuously applying for jobs, which should also allow them to negotiate their salary more effectively, however one can clearly see that such stability simply does not occur in the modern hospitality industry (Davidson, Guilding, & Timo, 2006).
Salary is a major factor and makes up for most of the flaws an employee can see in a company, however bad supervisors and working conditions, just as old-fashioned human-resources strategies were the highest ranking answers in Hinkin & Tracey’s (2000) study for turnover in the hospitality industry.
According to Ghiselli, La Lopa, & Bai (2001) one of the biggest turnover factors is the employee age; the older one gets, the less one is eager to change jobs, just as much as the longer the employee tenure, the lower the turnover. The second top factor is the working conditions, which also determines the level of the turnover rate, as over half of the industry’s employees are under 30 years of age and the salary is relatively low, making employees look for another job/position, with better working conditions. To be able to understand what causes a high turnover rate, one has to check the level of job satisfaction. In this sense lower job satisfaction means higher turnover rate as individuals will look for better opportunity in the market.
HR practices would be able to amend this, however studies show that the most common HR hospitality practices undercut employees growth inside a single employer, in other words, employees have to change hotels to rise instead of being able to make a career inside of the hotel. To tackle this issue, studies have been conducted, but found that the situation doesn’t come from any single department, which challenges the effectiveness of any action plan
10 implementation, meaning that employment in the hospitality industry was and will remain, temporary (Davidson, Guilding, & Timo, 2006).
Technology and HRM
Technology success can be determined by the number of employees using an application and the depth the technology application is running in the company. HRM is steadily evolving to e-HRM to a point that an increasing number of companies are already using e-HRM instead of the traditional practices, to a point that the studies show that e-HRM is now the most common practice (Marler & Fisher, 2013). As a whole, e-HRM can be defined as the groundwork, the execution and the action of putting something related to IT into operation in a company system, in which at least two single or a joint operation work together to exercise human resources tasks.
According to Strohmeier (2007) technology in HRM can be used or better yet, made use of, in two major ways: a) technology to help users connect each other (e.g. two employees that sit next to each other or any other two employees working on opposite sides of the world), b) technology to absorb an activity that an employee does, or used to do, freeing employees from certain activities. Just by considering these two ideas demonstrates the power technology has, to change a company, given its ubiquity.
e-HRM englobes everything that is technology and HRM related. Cybernetic HRM is one part of it, and can be explained by the way a common human resources department ceases to exist as its activities are absorbed by technology to a point that said department, comes to be, as the name already says, virtual. The next technology term that defines e-HRM is web-based HRM, which is the link between human resources and the internet. Last but not the least the company-to-worker HRM, which absorbs the way the company communicates with its employees, thus reducing the need, once again, of the HR department and this time also of the employee’s direct supervision (Strohmeier, 2007).
Technology, HRM and hospitality
Studies show that to be the best hotel one needs to predict in order to guide managerial choices. Technology is a great tool to achieve it. However, technology also poses innumerous challenges to companies due to quick obsolescence. On the other hand, Connolly and Olsen
11 (2001) state that there is no other individual force that shows the same amount of effect in terms of change in this industry apart from technology.
Companies in the hospitality industry have the option to use technology, for example, as a HRM tool either as an instrument of motivation or to reduce labor and implement capital. Another use of technology is its strategic benefits as it can help to manage organizations by providing means to analyze the data more efficiently or to influence business strategy itself by increasing added value (Camisón, 2000).
On a more global perspective, there are certain issues in a hotel that when not dealt with can turn into a problem. Technology enables one to find a way to analyze said problems from different perspectives (Wang, Hsu, Lin, & Hung, 2014).
Technology is the must-have competitive tool a company should have in the hospitality industry, as its effects go from the way the company operates to its internal (employee-to-employee) and external (employee-to-customer) interactions (Connolly & Olsen, 2001).
Although IT is one of the most common ways to gain a competitive performance, there is still limited research papers published on it (Cohen & Olsen, 2013). The reason hotels tend to lean towards IT investment and implementation is because of the upturn in their business operation, helping them to make data-driven decisions and increasing their overall productivity, in other words IT has turned into a must-have strategic tool (Kim, Lee, & Law, 2008).
Technology is ever evolving and benefiting not only companies, but also individual users. It enables them to expand horizons and improve their knowledge and productivity. However, as pointed out in previous studies (Abad, Díaz, & Vigo, 2010; Meschtscherjakov, Wilfinger, Scherndl, & Tscheligi, 2009), most technologies were created to fulfill a purpose but are not being used to their fullest potential. This would mean, that even though a company might be strongly investing into a new strategic technology implementation, its productivity might not improve or can even worsen, which is commonly called the productivity paradox (Sichel, 1997). This implies technology impacts on organizational performance is not a simple issue requiring complex research models, which have already been developed such as TAM, which we shall explain next.
TAM
To study this and other controversies, researchers have developed the Technology Acceptance Model, or in short TAM (Davis, 1989) that has been shown to be a valid model in several empirical studies (Pijpers, Bemelmans , Heemstra, & Montfort, Senior executives’ use
12 of information technology, 2001). This model puts forward the idea that more than the technology system sophistication, the motivation to use that system will determine its effectiveness. Davis (1989) uses TAM to understand what motivates an employee to welcome or dismiss a new technology and by which means changing that technology system it can be overall beneficial for the company. The way users feel about a system will affect the level of usage they will have of said system. According to Siguaw et al. (2000) amongst the three factors that influence a hotel’s choice of game plan regarding technology lies the hotel’s ability and stimulus to its implementation (alongside with implementation cost, and response of the customer to the implementation).
The fundamental condition to actually accept and use technology is the existence of an available working IT infrastructure that offers updated current software, is user friendly, and with full operationally capacities while allowing a secure and integrated working space. The subjective judgments individuals do about this IT infrastructure may enact motivation to use it. According to Davis (1989) motivation comes from two theories. First, the level to which the system might be useful, which marks the degree to which users believe that making use of the system will enhance their job performance. So, expected utility is a key driver of technology acceptance. Second, the degree to which the systems appear to be easy to use, demonstrates how challenging or not, this system will be required extra cognitive effort by those who have to learn and adapt to its use. Considering both drivers, we hypothesize that:
IT Infrastructure quality is positively associated with perceived ease of use (H1a) IT Infrastructure quality is positively associated with perceived utility (H1b)
Studies (e.g. Genlin & Jie, 2015; Venkatesh & Davis, 2000) have shown that to implement a new technology strategy it is more important to demonstrate and make the user understand the system’s practicality than the system being itself easy to use. The strategic implementation of an information system is to improve the employee’s productivity. However, if the hotel employee does not, consciously or unconsciously, accept the new system, or even an update of a previous system, said strategic implementation will not actually help enhance the employee’s productivity. The level of difficulty the hotel employee has on using the system, affects not only the employee’s stand on using the system, but also, and on a much higher level, on their inclination towards its usefulness. Taking this into consideration, we hypothesize that:
13 Perceived Ease of use is positively associated with Perceived Usefulness (H2)
The factor that dominates the use of the system, not only in a direct manner but also indirectly through the motivational door, is the way users feel about its usefulness. There being a system itself is not what makes the employee use it. The system being seen as a useful or seen as not difficult to use, actually motivates the employee, as shown above, to use the new technology in place both fostering a positive attitude towards technology as well as increasing the chances that a receptive behavioral intention is displayed (Davis, 1993). Such intention to use has been found to directly link with actual use of technology, which plausibly increase chances of higher job performance as well as job satisfaction (Morris & Venkatesh, 2010). Considering this, we hypothesize that:
Perceived Usefulness is positively associated with Attitude towards use (H3a) Perceived Usefulness is positively associated with Behavioral intentions (H3b)
A complementary deduction that Davis (1993) himself established in the TAM is a direct influence between perceived ease of use and favorable attitudes towards use. Likewise, attitudes are taken in Social Psychology as predecessors of behavioral intentions adding to the theoretical explanation on how to build positive behaviors towards technology use. All this lead us to hypothesize that:
Perceived ease of use is positively associated with Attitude towards use (H3c) Attitude towards use is positively associated with Behavioral intentions (H4)
The more stakeholders (managers, colleagues, customers) feel that using a system is beneficial for job performance, the more likely it is that each employee endures in such feeling and belief (Fishbein & Ajzen, 1975). This could be described as simple pressure from above, however, instead of this pressure being materialized in financial goals or deadlines, it is more a way others feel about using a system, or also commonly described as social subjective norm, in which employees feel that it is expected of them to use the system, as others consider it positive to use the system. Perceived social pressure can be so great that even if employees do not agree with the system, they are more likely to be prone to accept it if the external pressure indicates it (Fishbein & Ajzen, 1975). This can be more accurately labeled as a universal social pressure. If an employee’s manager is able to make the employee understand and feel that the system is beneficial, there will be a much higher acceptance of the technology than if the manager does
14 not convey a positive image of the system. Specifically, to the hospitality industry, this pressure is in fact a universal one, as it goes through the supervisor, the employee’s colleagues, family, the hotel’s guest and the manager of that property or general management (Lam, Cho, & Qu, 2007). Some studies (Lucas & Spitler, 1999; Venkatesh & Davis, 2000; Yang & Yoo, 2004) even suggest that the company’s policy and social pressure (subjective norm) is more important for the employee to voluntarily accept the system, than an employee’s own perception about it. Considering this, we hypothesize that:
Subjective norm moderates the positive relationship between Attitude towards use and Behavioral intentions, such that the relationship is stronger for high levels of subjective norm (H5).
Making technology available is not a sufficient condition to its actual use. On one hand one has the need to innovate and update all the systems, on the other hand, a lack of training to optimize the use of said technology is sometimes missing (Teo, 2011). This author found such phenomenon e.g. in teachers from three countries who had access to technology but failed to use it properly (used it for games), or lacked the training, or lacked leadership in providing the necessary support (Teo, 2011). Ram and Jung (1991) argue that when users have to learn a new system there are two paths, voluntary and involuntary, voluntary being the users own interest to learn a new system and involuntary is the user being forced to learn a new system, as it often happens in a professional environment in which the company installs a new system and the employee has to adapt to it. These options have to take into consideration one of the central variables used to judge HRM: job satisfaction.
Although adaptation efforts can lower, in the short run, overall job satisfaction (Brown, Massey, Montoya-Weiss, & Burkman, 2002; Lee, Lee, & Kwon, 2005) they will translate in heightened job satisfaction once the change management process assures TAM variables are set to the level they should (the system being considered of utility and easy to use) which will avoid unnecessary adaptation efforts and thus should increase job satisfaction due to the positive outlook (Maiera, Laumera, & Eckhar, 2013). Job satisfaction is of interest in this context of hospitality as it is known to predict positive outcomes such as the employee being more customer oriented, which will enhance the customer satisfaction and thus rise the service quality that is perceived by the customer (Arnett, Laverie, & McLane, 2002) and to prevent negative ones such as negligence, disloyalty, absenteeism whatever and employee turnover (Iverson & Deery, 1997) which is a key issue in hospitality due to high rates and costs (Hinkin & Tracey, 2000). Davidson et al. (2010) quantified this cost, demonstrating that it would cost a
15 little under 10 000 AUD to substitute an operations employee, while it would take a little over 10 times of that value to replace a managerial staff member, in a study made to 4 and 5 star hotels in Australia. Considering this, we hypothesize that:
Behavioral intentions are positively associated with job satisfaction (H6) Job satisfaction is negatively associated with turnover intentions (H7)
Overall, the research model integrated all these propositions into the following graphical representation (Figure 1).
17
Method
Data analysis strategy
Data analysis follows a two-phase strategy where we start by checking the quality of the measures, namely their validity and reliability. For that purpose, we relied on some indicators available in PLS-SEM, namely Average Extracted Variance (AVE) that should achieve at least 0.500. Also, its square root should be higher than any correlation among variables related to it. Discriminant validity is judged on the basis of Fornell-Larcker criterion, where the squared root of each construct’s AVE must be higher that any bivariate intercorrelation (Fornell & Cha, 1994).
Likewise, Cronbach alpha and Composite Reliability (CR) are expected to achieve 0.700 if the measure is to be considered reliable.
To test the hypotheses, we have conducted PLS Structural Equation Modelling (PLS-SEM). This is a data analysis technique that tests the fit of a structural model against the data collected. The model comprehends latent variables (factors) and the hypothesized relations between them correspond to path (as in regression analysis) which are shown together with significant p values (Hair, Ringle, & Sarstedt, 2011).
According with Vinzi, Trichera & Amato (2009) this data analysis technique has the advantage of not imposing any assumption concerning distribution or measurement scale while allowing to work with small samples.
As in all organizational research, most studies apply linear techniques assuming the distribution follow linearly. However, as Bertenthal (2007) states, nonlinearity is probably the rule, not the exception. Therefore, taken as a rule of thumb that assumptions add to risk, we opted to conduct analyses discarding that assumption, and accepting nonlinear relations. For that purpose, we opted to conduct analyses with Warp-PLS program (Kock, 2015).
Technically, a PLS-SEM model is valid if the following conditions are cumulatively met (Kock, 2015; Pearl, 2009):
a) significant (p<.05) average Path Coefficient (APC) and Average r square (ARS), and the path coefficients magnitude are indicated by Cohen’s ƒ2 where 0.02=weak,
0.15=moderate, 0.35=high.
18 c) Simpsons’ paradox ratio (SPR) and Nonlinear bivariate causality direction ratio
(NLBCDR) above 0.7;
d) The goodness of fit (GoF) is considered small if it reaches only 0.1, moderate for values above .25 and large for values above .36 (Tenenhaus, Vinzi, Chatelin, & Lauro, 2005).
Measures
IT Infrastructure was measured by means of the global item concerning application integration (Cohen & Olsen, 2013) that subsumes Bhatt, Grover & Grover (2005) modularity, scalability, multiple application handling and standardization which would be accessible only for IT professionals. As a complement, four additional items were created concerning hardware and software quality, namely: comprehensiveness, contemporaneity (being up-to-date), responsiveness, security and operationality. The final measure comprises five items (i.e. “This IT system has a high degree in the integration of applications”, “I have all the software I need to do my job”, “The hardware and software in use is up to date and responsive”, “The software is secure”, and “The communication infrastructure works well 24/7”). This scale had acceptable convergent validity (AVE=.556), divergent validity (Root squared AVE =.746 above all correlations) and high reliability (Cronbach alpha=.798, CR=.861). The response scale ranged between 1 (Strongly Disagree) and 5 (Strongly Agree). The higher the values for each one of these items, the higher IT infrastructure quality is ranked.
TAM model includes four key-concepts that operate as components of the entire theoretical model, namely Perceived Ease of Use, Perceived Usefulness, Attitude towards use, and Behavioral intentions. These were measured with Davis (1985) scale adapted to the hospitality industry comprising 18 items. The response scale ranged between 1 (strongly disagree) and 5 (strongly agree).
Perceived ease of use comprises 4 items (e.g. “Learning to operate the technology is easy for me”, “I find it easy to get the technology to do what I want it to do”, “It is easy for me to become skillful at using technology” and “Overall, I find the technology easy to use”) and showed good convergent validity (AVE=.784), divergent validity (Root squared AVE =.889 above all correlations), as well as high reliability (Cronbach alpha=.944, CR=.956).
Perceived usefulness comprises 6 items (e.g. “Using the technology system ...”: “... in my job enables me to accomplish tasks more quickly”, “... improves my job performance”, “...
19 enables me to increase my productivity”, “... enhances my effectiveness on the job”, “... makes it easier to do my job” and “Overall, I find the technology system useful in my job.”) and showed good convergent validity (AVE=.790), divergent validity (Root squared AVE =.886 above all correlations), as well as high reliability (Cronbach alpha=.911, CR=.938).
Attitude towards use comprises 4 items (e.g. “All things considered, to do your job, to what extend do you agree/disagree that using technology…”: “... important”, “... relevant”, “... interesting” and “... attractive”) and showed good convergent validity (AVE=.536), divergent validity (Root squared AVE =.732 above all correlations), as well as high reliability (Cronbach alpha=.708, CR=.821). We had to discard one item because it lowered the psychometric quality of this variable.
Behavioral intentions comprises 3 items (e.g. “I intend to work with technology more increasingly in the future”, “I want to use technology for my work” and “It is likely that I will use technology for my future work”) and showed good convergent validity (AVE=.875), divergent validity (Root squared AVE =.936 above all correlations), as well as high reliability (Cronbach alpha=.929, CR=.955).
Subjective norm was measured with Lam et a. (2007) scale comprising four items (i.e. "My supervisor always encourages me to use information systems”, “My colleagues think that I should use information systems”, “My guests perceive using information systems to be useful in a hotel” and “My hotel manager believes that there are advantages of using information”). This scale has convergent validity (AVE=.537), divergent validity (Root squared AVE =.733 above all correlations), as well as high reliability (Cronbach alpha=.822, CR=.872). The response scale ranged between 1 (strongly disagree) and 5 (strongly agree).
Job satisfaction was measured with a single general item which has been found to correlate with several other job satisfaction measures and, according with Wanous, Reichers & Hudy (1997) is taken as a sufficient measure of the construct. The response scale was a sliding graphic rule (yellow smile) with five points from very sad (1) to very happy (5).
Intention to Quit was measured with three items adapted from Price (2001) scale (i.e. “I think a lot about leaving this company”, “I am actively searching for an acceptable alternative to this company”, and “When I can, I will leave the company”). This scale has convergent validity (AVE=.864), divergent validity (Root squared AVE =.930 above all correlations), as well as high reliability (Cronbach alpha=.921, CR=.950). The response scale ranged between 1 (strongly disagree) and 5 (strongly agree).
20 Procedure
The survey was deployed online with Qualtrics software and a link was sent to respondents via email with an invitation to participate in the study, stating its purposes, the identification of the researcher and the institutions (ISCTE-IUL and Rosen College). This email enabled the participant to verify the genuine source of the inquiry. Due to the international environment that characterizes hospitality we opted to make the survey available in four languages, namely English (as the basic language shown), Portuguese, Spanish, and German.
Eligibility criteria to participate in this study comprised individuals working in hospitality industry, with direct contact with technology as a working tool, with at least one full year working experience in this industry, working in a hotel with at least 3 stars, being of legal working age and having access to computers and/or employee email, as this survey was sent out by email after having collected the personal employee emails when visiting the various hotels that responded to this survey.
Sample
After removal of invalid cases (due to missing values) the sample comprises 61 individuals ranging from Los Angeles (USA) to Paris (France), Évora (Portugal), London (UK), Funchal (Madeira Islands, Portugal), Lakeland (USA), New York (USA), Leiria (Portugal) and Orlando (USA) with the majority of respondents being from Lisbon, Portugal. Over 80% of the participants consider themselves as being “Comfortable” when asked how they see themselves when it comes to their technology knowledge. Over 55% of the respondents were women, which matches the hospitality industry demographics. None of these individuals was 19 or younger (0%), and the second smallest age group of the participants was of “20-24” (5.5%). The smallest group was of over 65 years of age (1.8%) and the 3rd biggest group is a tie between the range of “45-54” (12.7%) and “55-64” (12.7%). The second biggest range was from 25 to 34 year olds (29%) while the majority with over 38% of individuals are between the ages of “35-44”, which can be explained by the fact that in the hospitality industry the common practice is of working one’s way up, meaning that entry level jobs are usually not in need to use a computer to work with, as they are usually more physically demanding ones.
The education level of this sample spreads out all over the spectrum, ranging from high school all the way up to college graduates. The only category that was available but wasn’t
21 chosen, is the “Less than high school” (0%) one. After removing missing values, only a small part of this sample has a high school diploma (9%), a slightly bigger group has had “some college” (11%), the second biggest group is college graduated (31%) and the biggest slice of this sample has an undergraduate diploma (49%). The total number of years working in hospitality industry covers all available options in the survey with the least experienced (1-3 years, 13%) and the most experienced group (over 26 years, 16%) closely matching the percentages in all the discrete options between them.
The last two categories that define this sample is the extent of managerial responsibilities respondents hold, as well as hotel star rating. Participants in this survey mostly have management positions (65%), of which 44% middle managers, while the remaining 56% were top managers. Slightly more than one third (35%) had no management position. The majority of responses came from 4-star hotels (57%), the second biggest slice came from the 5-star rating hotels (34%) and the remaining 9% came from 3-5-star hotels. 1- and 2-5-star hotels were ineligible to this study.
23
Results
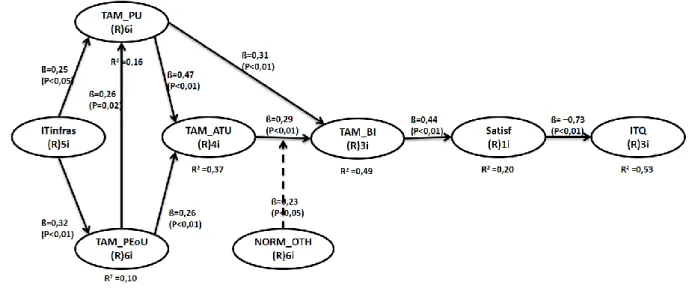
The full PLS-SEM indicators show the model if globally acceptable. The model shows a good APC (.357, p<.001) explaining an average variance of 30.7% (ARS, p<.001), adjusted 28.8% (AARS, p<.001). It has no multicollinearity issues, both horizontal and vertical (FVIF for all components below 3.333, AVIF=1.344; AFIVF=1.977). No Simpson paradox issues are identified (SPR=1.000 and NBCDR=0.9) and the overall Tenenhaus Goodness of fit is large (GoF=.465).
Figure 2 - Hypotheses: H1a to H7
The model is globally supported in all of its paths. The most noticeable path lies between Satisfaction and intention to quit (ITQ) which has a remarkable beta of 0.73 explaining 53% of variance in ITQ. Also, the sensitivity of satisfaction to behavioral intention gained support in a positive association (β=.44, p<.01) that has some, albeit modest, explanative power (20%). This renders support to the idea that in order to achieve satisfaction in hospitality employees are required, at least partially, to cope with the ubiquitous presence of technology.
One of the most interesting findings concern H5, as subjective norm does seem to moderate the relation between attitudes and behavioral intentions towards technology use.
24
Graph 1 - TAM_BI and TAM_ATU
A facial analysis of both curves (for high versus low subjective norm pressure) suggests an inconspicuous moderating effect (matching the p value of 0,03) but, more attentively, the gap between the lowest ATU in high subjective norm condition against the same value for low subjective norm condition is quite informative. In the absence of social pressure (subjective norm) the lowest values get as low as 1.23 in Attitude and 2.64 in behavioral intention. However, when the social environment is favorable to technology adoption the lowest value for attitudes is ca. 2.3 and 3.2 for behavioral intention. Also, the slope for the left part of the curves before they intersect is apparently steeper for the high condition when compared with the low one. Therefore, when social environment is favorable to technology adoption, attitudes towards technology seem to better predict behavioral intentions, thus supporting H5 as well as H4 because the direct relation shows a positive significant beta as hypothesized.
Overall, the first three hypotheses gained support in the empirical findings. This consolidates the core dimensions of TAM as a credited model in explaining technological acceptance. Namely, that building a favorable attitude towards technology use is dependent both on a perception of its usefulness and ease-of-use (H3a and H3b). Among these, usefulness outweighs perceived ease-of-use as it has a twofold influence both on the attitude and directly on the behavioral intention (Davis, 1985) which was corroborated by our findings namely in H3a and H3c. Likewise, the perceived ease of use contributed positively to increase the
25 perception of usefulness as theoretically expected and hypothesized (H2). Lastly, the IT infrastructure is indeed positively associated to both perceived usefulness and ease-of-use (H1a and H1b). All in all, the core variables in TAM received empirical support from this study.
To sum up, in an industry that has been increasingly relying on technology to foster service quality and efficiency, expanding TAM model scope by bridging it to intention to quit via job satisfaction proved to be a workable solution. This shows, firstly, that technology acceptance does play a major role on employees’ satisfaction and intention to quit within hospitality industry. Secondly, that social norm may be taken as a refining variable that adds explanative power to TAM. This means that the model, although widely tested, can further gain in sophistication by including group level dimensions in hospitality management.
Limitations and future studies
As in all cases, studies have limitations and findings may have in that way been conditioned. Sample size may be critical in quantitative studies both due to the representativeness of the sample as well as to the mathematical requirements to conduct specific data analyses. In this study, the small sample size might be a downside both for external validity purposes (generalizability) and to the use of mainstream data analysis techniques.
However, it is true that the sheer number of the sample is not a sufficient condition to ensure representativeness as all of the data collection can be biased due to methodological issues. In our case, we set criteria to reduce chances of collecting data from employees that would bias findings. This was achieved by limiting participation to employees able to directly receive emails and with access to internet at work (due to compliance requirements posed by the hotels that accepted to participate in the study) in a 3 or higher stared hotel. However, this option ruled out much of the workforce that was out of range. We accepted that it was better to take the risk of having to deal with a small but relevant sample rather than a wide, snow-balled or social networked sample that would just add up to figures. Another reason to explain the small sample was due to an initial intention of selecting respondents from across countries (USA and Europe) as the possibility of comparing international findings would add to the significance of the research. By not being able to continuously being present in both geographies it was not easy to establish the necessary relationships that would open doors at the corporate level to collect data.
The second issue, not being able to conduct mainstream data analysis, can be bypassed with adopting robust data analysis techniques that are suitable for nonparametric studies such
26 as PLS. In our case we even had the opportunity to use a more sophisticated technique PLS-SEM that offers more guarantees about model fit and true representation of non-linear relations, if any.
This research can further develop by dealing with a larger sample. If large enough, it would ideally allow for the comparison between corporations or even countries, as the social norm might differ.
The model itself can be a target for theoretical developments. In our findings, it is noticeable that not all variables in TAM have similar strong explanative mechanisms, as seen in the case of perceived usefulness and perceived ease-of-use. Although this might be taken as a disappointing result, it does offer a chance to further explore alternative or complementary variables that build a sense of technology usefulness and technology ease-of-use. An option that we believe could be retained as a new standard is the use of nonlinear data analysis techniques as our moderation test would probably passed unnoticed if we were to use linear data analysis techniques.
27
Discussion and conclusion
There is a long backlog of findings linking ITQ to low satisfaction (Coomber & Barriball, 2007; Grissom, Nicholson-Crotty, & Keiser, 2012) which lends this model some assurance about how seriously respondents replied to it. It also highlights how job satisfaction is not an option for HRM but indeed an asset as the strong association with ITQ reveals its potential to avoid turnover costs and implications. Likewise, the positive beta between behavioral intention and satisfaction renders support to Davis (1985) assumption that behavioral intention leads to actual behavior or at least some relevant output variable such as job satisfaction.
The positive relation between attitudes towards technology and behavioral intention reinforces the general theory on the centrality of attitudes in managing organizational change or in daily decisions (Yang & Yoo, 2004) behind TAM model.
Additionally Fishbein & Ajzen (1975) proposal that social norms play a key role in behavioral display echoed in the moderation effect found (H5). We trust this finding is generalizable to most if not all hospitality settings due to the universal nature of this pressure to adopt technology in this industry (Lam, Cho, & Qu, 2007). However, the relatively modest magnitude of the moderation effect found (as both lines follow a similar path) is not suggestive of the strong effect that Lucas & Spitler (1999) and Venkatesh & Davis (2000) proposed by stating that the social norm is of a greater influence than the individual perception itself.
The most central variables in TAM for applied purposes are those that are within the reach of organizational decision makers. Namely, at first, creating the systematic infrastructure that will support the organization as a whole in terms of technology. Second, demonstrate how to access this technological infrastructure and how one can reach (and achieve) higher goals with this technology implementation, which will, in the end, lead to the employee actual willingness towards making use of the technology set up by the company.
29
References
Abad, M., Díaz, I., & Vigo, M. (2010). Acceptance of mobile technology in hedonic scenarios. BCS '10 Proceedings of the 24th BCS Interaction Specialist Group Conference (pp. 250-258). Dundee, United Kingdom: BCS Learning & Development Ltd. Swindon, UK.
Arnett, D. B., Laverie, D. A., & McLane, C. (2002). Using job satisfaction and pride as internal-marketing tools. The Cornell Hotel and Restaurant Administration Quarterly, 42(2), 87-96.
Bertenthal, B. I. (2007). Dynamical Systems: It’s about Time! In S. Boker, & M. Wenger, Data Analytic Techniques for Dynamical Systems. Hillsdale, NJ: Erlbaum.
Bhatt, G. D., Grover, V., & Grover, V. (2005). Types of Information Technology Capabilities and Their Role in Competitive Advantage: An Empirical Study. Journal of Management Information Systems, 253-277.
Bishop, J. W., Goldsby, M. G., & Neck, C. P. (2002). Who goes? Who cares? Who stays? Who wants to?: The role of contingent workers and corporate layoff practices. Journal of Managerial Psychology, 17(4), 298-315.
Bogdanovych, A., Berger, H., Simoff, S., & Sierra, C. (2006). Travel Agents vs. Online Booking: Tackling the Shortcomings of Nowadays Online Tourism Portals. Information and Communication Technologies in Tourism, 418-428. Retrieved from http://link.springer.com/chapter/10.1007%2F3-211-32710-X_55?LI=true
Brown, S. A., Massey, A. P., Montoya-Weiss, M. M., & Burkman, J. R. (2002). Do I really have to? User acceptance of mandated technology. European Journal of Information Systems, 11(4), 283-295.
Camisón, C. (2000). Strategic attitudes and information technologies in the hospitality business: an empirical analysis. Hospitality Management, 19(2), 125-143.
Cheyne, J., Downes, M., & Legg, S. (2006). Travel agent vs internet: What influences travel consumer choices? Journal of Vacation Marketing, 12(1), 41-57.
Cohen, J. F., & Olsen, K. (2013). The impacts of complementary information technology resources on the service-profit chain and competitive performance of South African hospitality firms. International Journal of Hospitality Management, 34, 245-254. Connolly, D. J., & Olsen, M. D. (2001). An Environmental Assessment of How Technology is
30 Coomber, B., & Barriball, K. (2007). Impact of job satisfaction components on intent to leave and turnover for hospital-based nurses: A review of the research literature. International Journal of Nursing Studies, 44(2), 297–314.
Davidson, M., Guilding, C., & Timo, N. (2006). Employment, flexibility and labour market practices of domestic and MNC chain luxury hotels in Australia: Where has accountability gone? Hospitality Management, 25(2), 193-210.
Davidson, M., Timo, N., & Wang, Y. (2010). How much does labour turnover cost?: A case study of Australian four‐ and five‐star hotels. International Journal of Contemporary Hospitality Management, 22(4), 451 - 466.
Davis, F. (1989). Perceived Usefulness, Perceived Ease of Use, and User Acceptance of Information Technology. Management Information Systems Research, 319-340. Davis, F. (1993). User acceptance of information systems: the technology acceptance model
(TAM). International Journal of Man-Machine Studies, 38(3), 475-487.
Davis, F. D. (1985). A Technology Acceptance Model for Empirically Testing new end-user information systems: Theory and results. Massachusetts Institute of Technology, 1-291.
Demirciftci, T., Cobanoglu, C., Beldona, S., & Cummings, P. R. (2010). Room Rate Parity Analysis Across Different Hotel Distribution Channels in the U.S. Journal of Hospitality Marketing & Management, 295-308.
Fishbein, M., & Ajzen, I. (1975). Belief, Attitude, Intention, and Behavior: an Introduction to Theory and Research. Addison-Wesley, Reading, MA.
Fornell, C. G., & Cha, J. (1994). Partial least squares. In R. P. Bagozzi, Advanced methods of marketing research (pp. 52–78). Oxford: Blackwell.
Funk, J. L. (2015). Thinking about the future of technology: Rates of improvement and economic feasibility. Futures, 73, 163-175.
Gaspara, J., & Glaeserb, E. L. (1998). Information Technology and the Future of Cities. Journal of Urban Economics, 43(1), 136-156.
Genlin, Z., & Jie, X. (2015). Study of Customer Experience under the Circumstances of Mobile Internet. International Journal of Multimedia and Ubiquitous Engineering, 10(2), 153-158.
Ghiselli, R. F., La Lopa, J. M., & Bai, B. (2001). Job Satisfaction, Life Satisfaction, and Turnover Intent. Cornell - Hotel and Restaurant Administration Quarterly, 42(2), 28-37.
31 Good, L. K., Sisler, G. F., & Gentry, J. W. (1988). Antecedents of Turnover Intentions Among
Retail Management Personnel. Journal of Retailing, 64(3), 295-314.
Grissom, J., Nicholson-Crotty, J., & Keiser, L. (2012). Does My Boss’s Gender Matter? Explaining Job Satisfaction and Employee Turnover in the Public Sector. J Public Adm Res Theory, 22(4), 649-673.
Hair, J. F., Ringle, C. M., & Sarstedt, M. (2011). PLS-SEM: Indeed a Silver Bullet. Journal of Marketing Theory and Practice, 19(2), 139-152.
Hinkin, T. R., & Tracey, J. (2000). The Cost of Turnover - Putting on Price on the Learning Curve. Cornell Hotel and Restaurant Administration Quarterly, 41(3), 14-21.
Hostar. (2016, 08 31). ProHost® Mobiles allow for a Controlled Delivery of Minibar Items, Meeting Setups and Restaurant Linens. Retrieved from Hotel.Online: http://www.hotel-online.com/News/PR2008_1st/Jan08_ProHostMiddleEast.html Iverson, R. D., & Deery, M. (1997). Turnover culture in the hospitality industry. Human
Resource Management Journal, 7(4), 71–82.
Kim, T., Lee, J., & Law, R. (2008). An empirical examination of the acceptance behaviour of hotel front office systems: An extended technology acceptance model. Tourism Management,29(3), 500-513.
Kock, N. (2015). WarpPLS 5.0. Retrieved December 10, 2016, from ScriptWarp Systems: http://cits.tamiu.edu/WarpPLS/UserManual_v_5_0.pdf
Lam, T., Cho, V., & Qu, H. (2007). A study of hotel employee behavioral intentions towards adoption of information technology. Hospitality Management, 26(1), 49–65.
Lee, H., Lee, Y.-K., & Kwon, D. (2005). The intention to use computerized reservation systems: The moderating effects of organizational support and supplier incentive. Journal of Business Research, 58(11), 1552-1561.
Lucas, H., & Spitler, V. (1999). Technology use and performance: a field study of broker workstations. Decisions Sciences, 30(2), 291–311.
Luftman, J., & Brier, T. (1999). Achieving and Sustaining Business-IT Alignment. California Management Review, 42(1), 109-21.
Lum, L., Kervin, J., Clark, K., Reid, F., & Sirola, W. (1998). Explaining nursing turnover intent: job satisfaction, pay satisfaction, or organizational commitment? Journal of Organizational Behavior, 19(3), 305-320.
Maiera, C., Laumera, S., & Eckhar, A. (2013). Analyzing the impact of HRIS implementations on HR personnel’s job satisfaction and turnover intention. The Journal of Strategic Information Systems, 22(3), 193–207.
32 Marler, J. H., & Fisher, S. L. (2013). An evidence-based review of e-HRM and strategic human
resource management. Human Resource Management Review, 23(1), 18-36.
McKenney, J. L. (1994). Waves of Change: Business Evolution through Information Technology. Boston: Harvard Business School Press.
Meschtscherjakov, A., Wilfinger, D., Scherndl, T., & Tscheligi, M. (2009). Acceptance of future persuasive in-car interfaces towards a more economic driving behaviour. AutomotiveUI '09 - Proceedings of the 1st International Conference on Automotive User Interfaces and Interactive Vehicular Applications, 81-88.
Mithas, S., Ramasubbu, N., & Sambamurthy, V. (2011). How Information Management Capability Influences Firm Performance. Research Collection School Of Information Systems, 35(1), 237-256. Retrieved from http://ink.library.smu.edu.sg/sis_researc h/219/
Mobley, W. H. (1977). Intermediate linkages in the relationship between job satisfaction and employee turnover. Journal of Applied Psychology, 62(2), 237-240.
Morris, M. G., & Venkatesh, V. (2010). Job Characteristics and Job Satisfaction: Understanding the Role of Enterprise Resource Planning System Implementation. MIS Quarterly, 34(1), 143-161.
Olsen, K. (2012). Information technology, knowledge management and competitiveness: an empirical study in the South African hospitality context. (Doctoral Dissertation). Parry, E. (2011). An examination of e-HRM as a means to increase the value of the HR function.
The International Journal of Human Resource Management, 22(5), 1146-1162. Retrieved from http://dx.doi.org/10.1080/09585192.2011.556791
Pearl, J. (2009). Causality: Models, reasoning, and inference. Cambridge University Press. Peng, H., Xu, X., & Chen, W. (2013). Tourist Behaviors in Online Booking: A New Research
Agenda. Communications in Information Science and Management Engineering, 3(6), 280-285. Retrieved from http://search.proquest.com/openview/e7e792e65453c4794f cd7a7710b2c814/1?pq-origsite=gscholar
Pijpers, G., Bemelmans, T., Heemstra, F., & Montfort, K. (2001). Senior executives’ use of information technology. Information Software Technology, 43(15), 959– 71.
Price, J. (2001). Reflections on the determinants of voluntary turnover. International Journal of Manpower, 22(7), 600-624.
Ram, S., & Jung, H. S. (1991). 'Forced' adoption of innovations in organizations: consequences and implications. Journal of Production and Innovation Management, 8(2), 117-126.