R E S E A R C H A R T I C L E
Open Access
Characterization of the cork oak transcriptome
dynamics during acorn development
Andreia Miguel
1,2†, José de Vega-Bartol
1,2,3†, Liliana Marum
1,2,4, Inês Chaves
1,2, Tatiana Santo
5, José Leitão
5,
Maria Carolina Varela
6and Célia M. Miguel
1,2*Abstract
Background: Cork oak (Quercus suber L.) has a natural distribution across western Mediterranean regions and is a keystone forest tree species in these ecosystems. The fruiting phase is especially critical for its regeneration but the molecular mechanisms underlying the biochemical and physiological changes during cork oak acorn development are poorly understood. In this study, the transcriptome of the cork oak acorn, including the seed, was characterized in five stages of development, from early development to acorn maturation, to identify the dominant processes in each stage and reveal transcripts with important functions in gene expression regulation and response to water. Results: A total of 80,357 expressed sequence tags (ESTs) were de novo assembled from RNA-Seq libraries representative of the several acorn developmental stages. Approximately 7.6 % of the total number of transcripts present in Q. suber transcriptome was identified as acorn specific. The analysis of expression profiles during development returned 2,285 differentially expressed (DE) transcripts, which were clustered into six groups. The stage of development corresponding to the mature acorn exhibited an expression profile markedly different from other stages. Approximately 22 % of the DE transcripts putatively code for transcription factors (TF) or transcriptional regulators, and were found almost equally distributed among the several expression profile clusters, highlighting their major roles in controlling the whole developmental process. On the other hand, carbohydrate metabolism, the biological pathway most represented during acorn development, was especially prevalent in mid to late stages as evidenced by enrichment analysis. We further show that genes related to response to water, water deprivation and transport were mostly represented during the early (S2) and the last stage (S8) of acorn development, when tolerance to water desiccation is possibly critical for acorn viability.
Conclusions: To our knowledge this work represents the first report of acorn development transcriptomics in oaks. The obtained results provide novel insights into the developmental biology of cork oak acorns, highlighting transcripts putatively involved in the regulation of the gene expression program and in specific processes likely essential for adaptation. It is expected that this knowledge can be transferred to other oak species of great ecological value. Keywords: Quercus suber, Fruit, Seed, Transcriptomics, Transcription factor, Transcriptional regulators, Response to water, Carbohydrate metabolism
* Correspondence:cmiguel@itqb.unl.pt
†Equal contributors 1
Instituto de Biologia Experimental e Tecnológica, Apartado 12, 2781-901, Oeiras, Portugal
2
Instituto de Tecnologia Química e Biológica, Universidade Nova de Lisboa, Avenida da República, 2780-157, Oeiras, Portugal
Full list of author information is available at the end of the article
© 2015 Miguel et al. This is an Open Access article distributed under the terms of the Creative Commons Attribution License (http://creativecommons.org/licenses/by/4.0), which permits unrestricted use, distribution, and reproduction in any medium, provided the original work is properly credited. The Creative Commons Public Domain Dedication waiver (http://creativecommons.org/publicdomain/zero/1.0/) applies to the data made available in this article, unless otherwise stated.
Miguel et al. BMC Plant Biology (2015) 15:158 DOI 10.1186/s12870-015-0534-1
Background
Seed protection and dispersal are the main functions of the fruit. Fruit initiation and development play a crucial role in plant adaptation, and successful fruiting strat-egies are important drivers of colonization of new niches. Fruit and seed set are generally characterized by extensive cell division and coordinated development of maternal and filial tissues, while growth and maturation stages are characterized by cell expansion and accumu-lation of storage products, mainly proteins, starch and oils [1]. The transcriptomic and proteomic analyses of genetic networks operating during specific processes of fruit and seed development have revealed the involve-ment of a wide range of molecular players including enzymes, regulatory proteins as well as hormonal sig-nals. Molecular studies of fruit development have been mostly conducted in fleshy fruits such as tomato [2–7], grape [8–10], blueberry [11, 12], sweet orange [13] or melon [14], due to their importance for human con-sumption. Genes related to fruit ripening have been ex-tensively studied in tomato, grape and sweet orange [10, 13, 15, 16] and genes specifically expressed in fruits have been identified in apple [17] and date palm [18]. In addition, Arabidopsis has proven very informative because its silique is a dehiscent fruit characteristic of the legumes and thus represents another exceptionally important fruit type in terms of human and animal food.
Much less attention has been paid to other types of fruits that although not generally used for human consumption, have huge ecological importance. The Fagaceae family comprises more than one thousand species half of which belong to the Quercus genus, commonly known as oaks. The oaks produce an indehiscent fruit, usually termed acorn, and are characteristically adapted to extremely vari-able habitats being widely distributed throughout the northern hemisphere in an almost continuous pattern.
Cork oak (Quercus suber L.), native to the western Mediterranean and north Africa regions [19] character-ized by hot and dry summers, has been considered a keystone forest tree species in the ecosystems where it grows [20, 21]. The species is mostly recognized for producing cork, which is removed from adult trees at regular intervals of at least 9 years, sustaining highly profitable cork industries [22]. Cork oak has an unusual fruiting strategy as it is the only known oak species with annual and biennial acorns on the same tree [23–27]. Other features such as bigger acorn size have been related to drought tolerance [28–30] and higher seed germination ability [29–32] and thus may strongly impact the capacity for species natural regeneration, the most common way of cork oak propagation [33]. Seed development and germin-ation are critical for the successful maintenance of the cork oak growing regions [34–36].
During development, the acorn undergoes many bio-chemical and physiological changes which likely confer the ability to survive the severe drought periods and high temperatures. The few studies that have been con-ducted in oak acorns have focused on morphological, physiological and phenological aspects [24, 29, 37] and a few reports exist on aspects of the male and female flower development [33, 38–40] and flower/fruit anat-omy [41]. Although some transcriptomic and genomic studies have also been published in oak species [42–44], it was only recently that the transcriptome of cork oak has started to be analysed in multiple tissues, develop-mental stages and physiological conditions [45]. In this context, and to gain knowledge on the molecular mech-anisms underlying the development of cork oak acorn and to identify transcripts putatively related with adaptive traits, we have analysed the dynamics of the transcriptome of acorns along five stages of development, defined according to morphological characters, from early fruiting stages to fruit and seed maturation. Our approach identi-fied genes with potentially relevant roles during acorn development focusing specially on transcripts coding for putative transcription factors and transcription regulators or transcripts associated to water related processes includ-ing response, transport and deprivation.
Results
Categorization of cork oak acorns into different developmental stages
Although the fruits are often defined as seed-bearing structures formed from a mature ovary, many structures that might be defined as fruit are in fact composed of different tissue types [46]. Other definitions have been proposed, such as the one by Van der Pijl [47] that con-siders the fruit as the dispersal unit. In this work we use the term acorn for simplicity, referring in fact to all the tissues enclosed by the pericarp, including the seed. It should be pointed out that at maturity most of the acorn mass consists of seed tissues, mainly cotyledons. Cork oak acorns were collected from late June to November in order to cover all developmental stages, from early development to full maturation. A staging system was established based on several morphological aspects (Fig. 1 and Table 1). Since the dimensions of the acorns were variable in the same collection date among trees in different locations, additional features were used to es-tablish developmental classes. These included the pres-ence of a visible endosperm, multiple embryos or a dominant embryo within the developing seed, covering of the acorn by the cupule and colour of the pericarp (Table 1). Accordingly, eight stages of acorn develop-ment were established (S1–S8, Fig. 1a, b). In the first stage (S1), fertilization of the ovules may have occurred already but in most cases the endosperm was not yet
visible. In the S2 stage multiple fertilised ovules were visible, however only one continued to grow becoming dominant and causing abortion of the other ovules (S3). During S4 and S5, the embryo continues to develop and in the remaining stages (S6, S7) further enlargement of the cotyledons takes place, with full maturation being reached in S8.
Sequencing and assembly of the cork oak acorn transcriptome
The sequencing of the five non-normalized libraries corresponding to samples from stages S1, S2, S3 + S4, S5 and S8 aimed at gene expression analysis during acorn development. In addition, two normalized librar-ies prepared from RNA of cork oak acorns or from iso-lated embryos were sequenced to favour the detection of rare transcripts and thereby facilitate the assembly. After
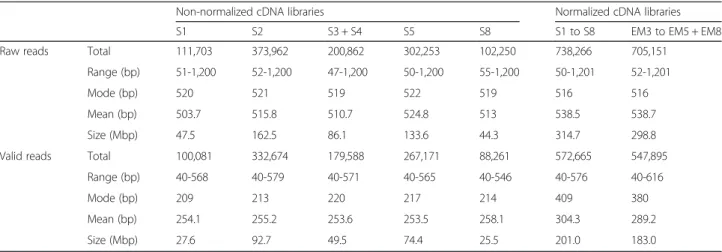
pre-processing, 2,088,335 high-quality sequences were retained and used in the assembly and mapping steps. The final average length of the reads was 215 and 400 bp for the normalized and non-normalized libraries, respect-ively (Table 2).
The seven libraries were assembled by MIRA and Newbler (Table 3). MIRA assembly contained 104,862 contigs, 52.2 % of which were longer than 500 bp. New-bler assembly contained 33,034 contigs, 79.6 % of which were longer than 500 bp. The merging of the MIRA and the Newbler assembly using CAP3 resulted in 80,357 contigs that were deposited in ENA (the ac-cession number of the de novo transcriptome is [ENA: HABZ01000000] and the accession numbers of the contigs are [ENA: HABZ01000001–HABZ01080357]). 62.5 % of these contigs were longer than 500 bp. The as-sembled transcripts were classified as complete, terminal, Fig. 1 Developmental stages established for the cork oak acorn. a Cork oak fruits collected at different developmental stages (S1-S8). The scale bar corresponds to 1 mm in S1 to S3 and to 5 mm in S4 to S8. b Cork oak fruits at stages S3-S5 after removal of the cupule (above), or cupule and pericarp (below) exposing the seed, and acorn measurement parameters (S7) used for acorn staging. D, maximum diameter of the acorn; Pi, portion of the
acorn outside the cupule; P, acorn portion covered by the cupule. The scale bar corresponds to 1 mm in S3 to S5 and to 5 mm in S7
internal or novel by comparison with the complete plant proteins in UniprotKB database (Table 3 and Additional file 1). 23,840 contigs did not have any homologous se-quence in the tested database (Complete plant Uniprot proteins). However, it was possible to predict a clear ORF for 4,658 of them, and they were classified as novel. Completeness of the Q. suber transcriptome by comparison with other Fagaceae
The proteins in the Q. suber assembly were compared to the proteins from other four Quercus spp., two Castanea spp. and a Fagus sp. For this purpose, we obtained the assembled transcriptomes from the Fagaceae project (www.fagaceae.org) or NCBI (for Q. robur and Q. petraea). The transcripts in each transcriptome were classified as complete, terminal, internal or novel by comparison with the complete plant proteins in UniprotKB database, as we had previously done for Q. suber (Additional file 2). Our Q. suber assembly had the higher number of complete proteins (19,146) and the second higher number of total proteins (56,517).
On average, 94.2 % of the proteins from any of the tested species could be found in our de novo assembled Q. suber transcriptome when it was used as the target database (Additional file 3). On the other hand, when the Q. suber proteins were used as query, we found that between 60 and 80 % of the queries aligned to each of the other transcriptomes, and the higher ratios corre-sponded to the more complete Castanea mollisina and Castanea dentatatranscriptomes. Of all the queries, only contig20020 was not found in any other transcriptome. Functional annotation of the Q. suber transcriptome All 80,357 transcripts were compared with the NCBI non-redundant (nr) protein database using Blastx with an E-value of 1e-10, which resulted in 53,670 (66.8 %) se-quences with a significant alignment (Additional file 4). Table 2 Read statistics from libraries of cork oak acorn and embryos before and after pre-processing. Embryo tissues isolated from acorns belonging to stages S3-S5 and S8 were termed EM3-EM5 and EM8, respectively
Non-normalized cDNA libraries Normalized cDNA libraries
S1 S2 S3 + S4 S5 S8 S1 to S8 EM3 to EM5 + EM8
Raw reads Total 111,703 373,962 200,862 302,253 102,250 738,266 705,151
Range (bp) 51-1,200 52-1,200 47-1,200 50-1,200 55-1,200 50-1,201 52-1,201
Mode (bp) 520 521 519 522 519 516 516
Mean (bp) 503.7 515.8 510.7 524.8 513 538.5 538.7
Size (Mbp) 47.5 162.5 86.1 133.6 44.3 314.7 298.8
Valid reads Total 100,081 332,674 179,588 267,171 88,261 572,665 547,895
Range (bp) 40-568 40-579 40-571 40-565 40-546 40-576 40-616
Mode (bp) 209 213 220 217 214 409 380
Mean (bp) 254.1 255.2 253.6 253.5 258.1 304.3 289.2
Size (Mbp) 27.6 92.7 49.5 74.4 25.5 201.0 183.0
Table 1 Criteria used for categorizing the cork oak acorn into different developmental stages. Representation of each stage in the normalized (N) and non-normalized (nN) cDNA libraries. Embryo tissues isolated from acorns belonging to stages S3-S5 and S8 were classified as EM3-EM5 and EM8
Developmental stage Max Ø with cupule (mm) Max Ø without cupule (mm) Isolation of embryos Other observations; library type S1 2 - 3 nd no no endosperm visible; N and nN S2 3 - 5 nd no multiple fertilized ovules, some aborted; N and nN
S3 5 - 8 nd yes (EM3) dominant
embryo; N and nN
S4 8 - 12 nd yes (EM4) acorn
completely covered by the cupule; N and nN
S5 12 - 17 7 - 11 yes (EM5) acorn already visible out of the cupule; N and nN
S6 17 - 20 11 - 16 no ~1/2 of the
acorn out of the cupule
S7 >20 >16 no Green acorn
mostly out of the cupule; N
S8 >20 >16 yes (EM8) Brown acorn;
N and nN
From the total number of transcripts, 19,757 (24.6 %) transcripts had the best match to Vitis vinifera se-quences, followed by 9,329 (11.6 %); 8,636 (10.7 %) and 5,324 (6.6 %) transcripts that matched to Ricinus com-munis, Populus trichocarpa and Glycine max sequences, respectively. Similar results have been obtained in the transcriptome annotation for other plant species and linked to conserved biochemical, morphological and de-velopmental characteristics [12]. The number of align-ments obtained among the Fagaceae family was very low: 122, 101, 97 and 75 sequences matched with se-quences of Castanea sativa, Fagus sylvatica, Quercus suber and Castanea mollissima, respectively (Additional file 4A). This is mainly due to the limited amount of data available at the GenBank database for non-sequenced spe-cies. Most of the alignments showed a similitude between 75 and 90 % (Additional file 4B). Only about 7.6 % of the total number of transcripts present in Q. suber transcrip-tome was found to be fruit or seed specific but, according to our analysis of the conserved motifs and structures in the sequences, the majority of these transcripts are un-known (Additional file 1).
50,228 (62.5 %) transcripts were annotated with at least one Gene Ontology (GO) term (Additional file 5). There was a direct relation between the sequence length and percentage of annotated sequences and over 75 % of the sequences longer than 1 Kb could be annotated (Additional file 4C).
49,945 (52.15 %) Q. suber transcripts had a homolo-gous in the A. thaliana genome (Blastx E-value < 1e-10). Each transcript was annotated with the GO terms of its
Arabidopsis homologous gene. Additionally, each A.
thaliana gene was annotated with its NCBI COGs, if
any exists, and this annotation was also associated back-wards to the original Q. suber transcript (Additional file 6). In order to compare our de novo transcriptome and identify COGs specific to Q. suber, a similar approach was followed for Q. petraea, Q. robur and the cork oak ESTs database (CODB). 44,300 (55.1 %); 59,572 (74.1 %) and 51,916 (64.6 %) transcripts from Q. petraea, Q. robur and CODB were homologous to genes from the A. thali-anagenome, respectively. The distribution of protein clus-ters is summarized in a Venn diagram (Additional file 7). 2,254 (72.5 %) of a total of 3,110 COGs were present in Table 3 De novo transcriptome assemblies and classification of the assembled cork oak transcripts
MIRA Newbler 2.6 Final (Merged)
Contigs 104,862 33,034 80,357
Contigs > 500 bp 54,764 (52.2 %) 26,313 (79.6 %) 50,197 (62.5 %)
Contigs < 200 bp 6,306 (6 %) 481 (1.5 %) 4,510a
Contigs with homologous in Uniprot 73,103 (69.7 %) 26,951 (81.6 %) 56,517 (70.3 %)
Unique Uniprot IDs 28,154 (38.5 %) 16,047 (48.6 %) 24,474 (43.3 %)
Complete contigs 16,149 (15.4 %) 12,953 (39.2 %) 19,146 (23.8 %)
C-terminus contigs 15,818 (15.1 %) 5,342 (16.2 %) 11,410 (14.2 %)
N-terminus contigs 15,368 (14.7 %) 4,064 (12.3 %) 10,108 (12.6 %)
Internal contigs 25,432 (24.2 %) 4,575 (13.8 %) 15,509 (19.3 %)
Misassembled contigs 336 (0.32 %) 17 (0.05 %) 344 (0.43 %)
Contigs without UNIPROT homologous 31,759 (30.3 %) 6,083 (18.40 %) 23,840 (29.6 %)
Novel genes 5,388 (5.14 %) 1,320 (4 %) 4,658 (5.8 %) Complete ORF 2,758 (2.6 %) 664 (2.01 %) 2,318 (2.9 %) Partial ORF 2,630 (2.5 %) 656 (1.99 %) 2,340 (2.9 %) Unknown contigs 26,346 (25.1 %) 4,757 (14.4 %) 19,163 (23.8 %) Unknown contigs < 200 bp 5,471 (5.2 %) 407 (1.2 %) 0a Putative ncRNAs 25 (0.02 %) 6 (0.02 %) 19 (0.02 %) Reads mappedb 2,020,921 (96.8 %) 1,909,842 (91.5 %) 2,009,759 (96.2 %)
Unique mapped reads 1,703,996 (84.3 %) 1,549,803 (74,2 %) 1,491,131 (71.4 %)
Duplicated mapped reads 273,619 (13.1 %) 270,027 (14.1 %) 367,486 (17.6 %)
Mapping more than two times 43,306 (2.1 %) 90,012 (4.7 %) 151,142 (7.2 %)
Average coverage 7.8 14.2 8
a
Contigs shorter than 200 bp were filtered out before analyzing
b
The percentage of reads that mapped over a possible total of 2,088,230 reads
all the species and 222 COGs were specific to Q. suber. Of these 222 COGs, 12.2 % were involved in replication, recombination and repair, 6.3 % in RNA processing and modification, 5.9 % in translation, ribosomal structure and biogenesis, 5.4 % in cell cycle control, cell division and chromosome partition, 5 % in post-translational modifications, protein turnover and chaperonesand 5 % in transcription. Finally, 20.8 % of the 222 COGs were unknownor poorly characterized (Additional file 6: File S3 and Additional file 8).
Pathway analysis during cork oak acorn development 15,612 (19.4 %) sequences were annotated according to their homology with known enzymes that belonged to 140 pathways (KEGG level-3 pathways) and all 14 KEGG groups of related pathways (KEGG level-2 pathways) (Additional file 9). The carbohydrate metabolism was the group most represented, which also includes several of the more repre-sented pathways, such as starch and sucrose, glycolysis and gluconeogenesis, amino sugar and nucleotide sugar, pyru-vate, and galactose metabolic pathways. The second most represented group was amino acid metabolism, which includes phenylalanine metabolism. When the number of different enzymes is considered, the more relevant pathways were glycine, serine and threonine; arginine and proline and cysteine and methionine pathways. The third most repre-sented group was lipid metabolism followed by energy me-tabolism. Among the most represented pathways were also purine and pyrimidine metabolism, methane metabolism, and phenylpropanoid biosynthesis (Additional file 9).
The reads from the five non-normalized libraries were mapped to the transcripts in the final assembly to quantify the expression in each stage. The number of mapped reads of the transcripts belonging to the same pathway was summed up to determine the expression of each pathway on time (Additional file 9). The normalized expression values for the level 2 pathways were represented in a heat-map (Fig. 2). While the immune system was the most up-regulated pathway in the first acorn developmental stage (S1), followed by metabolism of other aminoacids and sec-ondary metabolites, in middle stages of development (S2 to S5) up-regulation of carbohydrate, nucleotide, glycan biosynthesis and energy metabolism was observed. Signal transductionpathways were up-regulated only in S2, while amino acid metabolism and translation were specifically up-regulated in S3S4. S8 exhibited an expression profile markedly different from other developmental stages where lipid metabolism and metabolism of cofactors and vita-minswere specifically up-regulated.
Differentially expressed genes (DEGs) during cork oak acorn development
From the mapping of the reads of the five non-normalized libraries to the assembled transcriptome, 58,839 genes
were identified as expressed during any of the develop-mental stages, 7,824 transcripts (13.3 %) were expressed in all the stages and 22,802 (38.8 %) were specific to one stage. The total number of transcripts present in each stage was 23,104 (39.3 %); 37,501 (63.7 %); 30,035 (51 %); 33,367 (56.7 %) and 17,310 (29.4 %), respectively from S1 to S8 (Additional file 10).
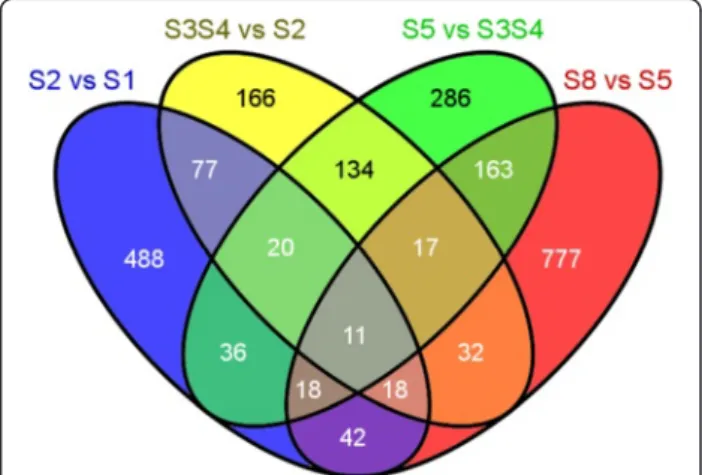
Of the 58,839 transcripts expressed during acorn devel-opment, 2,285 (3.9 %) were considered DE (Additional file 11). From those 710 (31.1 %), 475 (20.8 %), 685 (30 %) and 1,078 (47.2 %) transcripts were DE between stages S2 and S1, S3S4 and S2, S5 and S3S4, and S8 and S5, respectively. 568 transcripts (24.9 %) were DE in more than one stage transition (Fig. 3). From the DEGs only 30 (~1.3 %) were found as acorn specific, with 5 transcripts in stage S1, 14 in stage S3S4, 7 in stage S5 and 4 in the last stage of the acorn development (S8). However, the majority of these transcripts are of unknown function (Additional file 11).
Fig. 2 Heatmap of the expression levels of the KEGG level 2 pathways. The expression levels were normalized in Z scores, with signals from red (higher expression) to green (lower expression)
Fig. 3 Venn diagram illustrating the number of transcripts differentially expressed between two consecutive stages of development
An enrichment analysis by F-fisher test (FDR < 0.05) comparing the set of 2,285 DEGs versus the complete transcriptome evidenced 466 over-represented GO terms (Additional file 12). One third of the DEGs were involved in responses to abiotic stimulus, one fifth in carbohydrate catabolism, and other fifth in the catabol-ism and generation of energetic compounds. GO terms related with transport process, such as water and auxin polar transport, or development and growth were also significantly represented (Additional file 13).
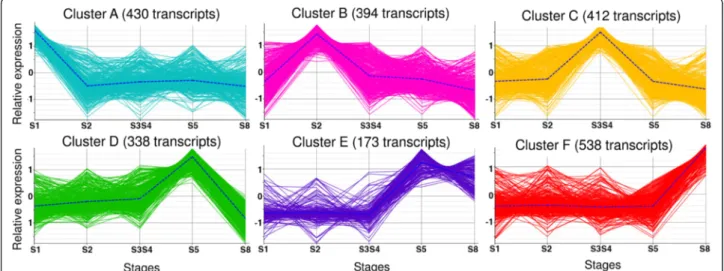
DEGs were clustered in six groups according to their expression profile on time (Fig. 4 and Additional file 11). Since each cluster contains genes with a peak of expression in specific stage(s) of development, an en-richment analysis (FDR < 0.01) of the genes in each cluster versus the complete transcriptome evidenced the dominant processes in those stages (Additional file 12). Eight GO terms were over-represented at S1 (cluster A) including response to stimulus, response to
osmotic and salt stress, and hexose transmembrane
transport. Forty-one GO terms were over-represented at S2 (cluster B), including response to stress, to water, to water deprivation, to osmotic and to salt stresses, as well as water transport, and transmembrane transport. At S3S4 stages (cluster C) 73 GO terms were over-represented, including the previous terms related with response, and also regulation of meristem growth and of meristem development, among others. Thirty-one GO terms were over-represented at S5 (cluster D), and 68 GO terms at S5 and S8 (cluster E), including glycogen
synthesis and metabolism, carbohydrates (glucose,
hexose, glucan) metabolism, as well as starch synthesis and xylem development. Fifty GO terms were over-expressed at S8 (cluster F), including chitin binding and metabolismand aminoglycan, amino sugar, glucosamine and polysaccharide catabolism.
Genes related to response to water, water deprivation or water transport
From the total DEG, 211 (9.23 %) were related to water response, deprivation and transport, and distributed across all the developmental stages but over-represented in S2, followed by the last developmental stage (S8) (Additional file 14). A shortlist of these transcripts is presented in Table 4, including those that have a known Arabidopsis homolog, are specific of a single cluster and have a level of expression at a given stage higher than 85 % compared with its expression in all stages. Fulfilling these criteria and mostly expressed in the first stage of acorn development (S1-cluster A) we found an homo-log of the ABC transporter family, MULTIDRUG
RE-SISTANCE P-GLYCOPROTEINS(MDR4/PGP4/ABCB4)
as well as an homolog of the UBIQUITIN-CONJUGAT-ING ENZYME 32(UBC32). In cluster B, with a peak of expression in stage S2, an homolog of the Arabidopsis β-AMYLASE 1 (BAM1) was identified. In the subse-quent stages of acorn development (S3S4, cluster C) we found a transcript with homology to the RESPONSIVE TO DESICCATION 22(RD22). Specific to cluster D we found homologs of the ALPHA-GLUCAN PHOSPHORYLASE 1 (PHS1), EARLY RESPONSIVE TO DEHYDRATION 5 (ERD5) and the ABA INSENSITIVE 3 (ABI3). With an ex-pression profile that fits in cluster E, was a member of the EARLY RESPONSIVE TO DEHYDRATION, an homolog of the ERD15. Transcripts putatively encoding for mem-bers of Late Embryogenesis Abundant protein family, such as LATE EMBRYOGENESIS ABUNDANT 4–5 (LEA4–5),
DEHYDRIN XERO 1(XERO1) and DROUGHT-INDUCED
21(DI21), for LIPID TRANSFER PROTEIN 3 (LTP3), for
URIDINE DIPHOSPHATE GLYCOSYLTRANSFERASE
74E2(UGT74E2) and for METALLOTHIONEIN 3 (MT3)
were almost uniquely expressed in the last stage of the acorn development (Table 4 and Additional file 14).
Fig. 4 Clustering analysis of differentially expressed genes (DEGs) according to their expression profiles
Transcriptional regulators differentially expressed during acorn development
Transcription factors have important roles in gene expres-sion due to their ability to bind specific DNA sequences and control transcription by acting as transcriptional activators or repressors. Out of 2,285 DEGs during acorn development a total of 498 (21.8 %) were annotated as TFs or transcrip-tional regulators (Additranscrip-tional file 15). These transcripts were almost equally distributed among the different clusters, but slightly up-regulated in early development, representing approximately 22.5 and 20.7 % of the transcripts in clusters A and B, respectively, and less expressed in the late stages of acorn development representing 7.4 and 15.9 % of the total DE TFs in clusters E and F, respectively.
A list of selected transcripts that have a known Ara-bidopsis homolog and are annotated as transcription factors or transcriptional regulators is presented in Table 5, including those that are specific of a single cluster and are also stage-specific or belong to TF fam-ilies with well characterized roles in plant development.
We found homologs of MYB DOMAIN PROTEIN 36 (MYB36) and AUXIN RESPONSE FACTOR 4 (ARF4) specifically expressed in stage S1 (cluster A) and a member of the MYB-related family, homolog of the PEROXIDASE 72 (PRX72) specifically present in stage S3S4 (cluster C). Also other transcripts were identified which expression was restricted to the late stages of de-velopment, such as a homolog of the FAR1-RELATED SEQUENCE 4(FRS4) in stage S8 (cluster F). Interesting genes from well-known families of TFs or transcriptional regulators such as NAC, bHLH, class II KNOTTED1-like homeobox and OLEOSIN are also represented during the cork oak acorn development. Up-regulation in the early stages of development (S1 and S2) was observed for class II KNOTTED1-like homeobox genes. During the late stages of the acorn development transcripts putatively coding for OLEOSIN (OLEO) were up-regulated. Tran-scripts coding for NAC and bHLH transcription factor families were found DE across all the studied developmen-tal stages (Table 5 and Additional file 15).
Table 4 Shortlist of differentially expressed transcripts annotated as involved in response to water. Transcripts with a known Arabidopsis homolog were selected from a total of 211 DEGs in this category, based on their specificity to a single cluster and higher expression level in a given stage as determined by a stage expression factor (SEFa) higher than 0.85. To have transcripts specific of cluster D in the short list, the stage expression factor considered in this case was 0.57. Expression in each stage is represented as normalized counts
Cluster Transcript name At Locus At homologous Annotation counts SEFa
S1 S2 S3S4 S5 S8 A Contig16112 AT2G47000 MDR4, PGP4, ABCB4 Multidrug resistance 4,
P-glycoprotein 4, ATP binding cassette subfamily B4
19.8 0 0.6 0.4 0 0.95
A Qs-dev_rep_c84235 AT3G17000 UBC32 Ubiquitin-conjugating enzyme 32 25 0 1.2 0 1.2 0.91
B Contig18768 AT3G23920 BAM1 β-Amylase 1 1.2 29.6 0.6 1.2 2.2 0.85
Qs-dev_rep_c76744 0.4 54.2 0.2 8.4 0.8 0.85
C Qs-dev_rep_c77033 AT5G25610 RD22 Responsive to desiccation 22 0.4 0 34.4 0 3.6 0.90
D Contig17288 AT3G30775 ERD5, PRODH, ATPOX, ATPDH, PRO1, PDH1
Methylenetetrahydrofolate reductase family protein
0 0 0 22 15 0.59
D Qs-dev_rep_c76415 AT3G29320 PHS1 Glycosyl transferase 0.4 0.6 0.2 25.4 16.6 0.59
D Contig19318 AT3G24650 ABI3 AP2/B3-like transcriptional factor family protein
0 0 7.2 66.8 42.2 0.57
E Contig19981 AT2G41430 ERD15, LSR1, CID1 Dehydration-induced protein (ERD15) 0 2.2 0.6 25.8 37.2 0.96
F Contig18471 AT5G59320 LTP3 Lipid transfer protein 3 0 0.2 0 5.6 38.6 0.87
F Contig16935 AT4G15910 DI21 Late embryogenesis abundant
protein Lea5; drought-induced 21
1.2 0 3.6 18.8 179.2 0.88
Qs-dev_c42419 0 0 0 0 16.4 1
F Contig18808 AT5G06760 LEA4-5 Late embryogenesis abundant 4-5 1.2 2.2 0.6 0.4 53 0.92
F Contig17917 AT3G50980 XERO1 Dehydrin xero1 3 0.8 0.6 3.4 50.8 0.87
F Contig19993 AT1G05680 UGT74E2 Uridine diphosphate glycosyltransferase 74E2 0 0.8 0 4.2 33.8 0.87
F Qs-dev_rep_c73281 AT3G15353 MT3 Metallothionein 3 0.4 3 0.2 4.6 75 0.90
Qs-dev_rep_c79475 0.4 0 0.2 0.8 18.8 0.93
a
Stage Expression Factor¼XnormalizedcountsstageX
Table 5 Shortlist of differentially expressed transcripts putatively coding for transcription factors and transcriptional regulators. Transcripts with a known Arabidopsis homolog were selected according the following criteria: transcript is either specific of a single cluster and is stage-specific or belongs to TF families with well characterized roles in plant development
Cluster Transcript name Transcription factor Domain /Family At Locus At homologous Annotation counts SEFa
S1 S2 S3S4 S5 S8
A Contig20395 Vitis_vinifera_ GSVIVP00000629001 MYB_DNA binding/MYB
AT5G57620 MYB36 MYB domain
protein 36
24.2 0 0 0 0 1
A Contig14583 Vitis_vinifera_ GSVIVP00024505001 B3/ARF AT5G60450 ARF4 Auxin response
factor 4 21.6 0 0 0 0 1 C Contig20996 Oryza_sativa_subsp._Indica_ OsIBCD010288 MYB_DNA binding/ MYB-related AT5G66390 PRX72 Peroxidase superfamily protein 0 0 16.2 0 0 1 F Contig14504 Oryza_sativa_subsp._japonica_ LOC_Os11g45530.1
FAR1/FAR1 AT1G76320 FRS4, CPD25 FAR1-related sequence 4
0 0 0 0 23.2 1
A Contig23988 Carica_papaya_emv.TU.supercontig_ 187.28
KNOX1/HB AT5G25220 KNAT3 KNOTTED1-like
homeobox gene 3
35.6 0.8 3.8 11.6 13.8 0.54
B Contig17627 Vitis_vinifera_ GSVIVP00005632001 AT5G11060 KNAT4 KNOTTED1-like
homeobox gene 4 1.2 34 27.4 5.6 2 0.48 E Contig24728 Carica_papaya_emv.TU.supercontig_ 996.1 AP2/AP2-AREBP DUF260/LOB
AT4G25140 OLEO1 Oleosin 1 0 0 3 69.2 58.5 0.98
E Contig20473 Vitis_vinifera_ GSVIVP00016010001 0 0 8.2 428.2 192.4 0.99
E Contig23293 Vitis_vinifera_ GSVIVP00016010001 DUF260/LOB AT3G27660 OLEO4 Oleosin 4 0 0 0 71 25.8 1
F Qs-dev_rep_c103605 Vitis_vinifera_ GSVIVP00016010001 0.4 0 0 9.2 39.6 0.80
F Qs-dev_c70574 Vitis_vinifera_ GSVIVP00016010001 AT5G40420 OLEO2 Oleosin 2 0.2 0 0 2.2 49.8 0.95
B Contig1681 Carica_papaya_evm.TU.supercontig_ 3.229
HLH/bHLH AT5G08130 BIM1 0 22.8 0 1.2 8.8 0.70
D Contig25637 Vitis_vinifera_GSVIVP00008627001 AT1G01260 JAM2 Jasmonate associated
MYC2 like 2
5.2 16.6 7.4 21.6 0 0.43
E Contig18945 Populus_trichocarpa_180347 AT5G41315 GL3, MYC6.2 Glabra 3, Glabrous 3, MYC6.2 0 4.6 0.6 24.6 23.8 0.90
A Contig4505 Populus_trichocarpa_218417 NAM/NAC AT1G56010 NAC1 NAC domain
containing protein 1
34.2 2.2 0.6 0 0 0.92
A Contig23086 Populus_trichocarpa_714847 AT1G34190 NAC017, ANAC017 NAC domain
containing protein 17
20.2 0 0 11 4.6 0.56
B Contig23085 0 27.8 22.8 18.4 7 0.37
A Contig16452 Vitis_vinifera_ GSVIVP00027622001 AT4G27410 RD26, ANAC072 Responsive to
desiccation 26
608.8 184.2 138.6 32 11 0.62
B Contig25368 Vitis_vinifera_ GSVIVP00000471001 AT4G35580 NTL9 NAC transcription
factor-like 9
18.2 42 8.2 14.8 0 0.50
D Contig26025 Vitis_vinifera_ GSVIVP00027621001 AT3G15510 NAC2 NAC domain
containing protein 2
1.2 1.6 12 19.8 0 0.57
a
Stage Expression Factor¼XnormalizedcountsstageX
normalizedcountsallstages Miguel et al. BMC Plant Biology (2015) 15:158 Page 9 of 22
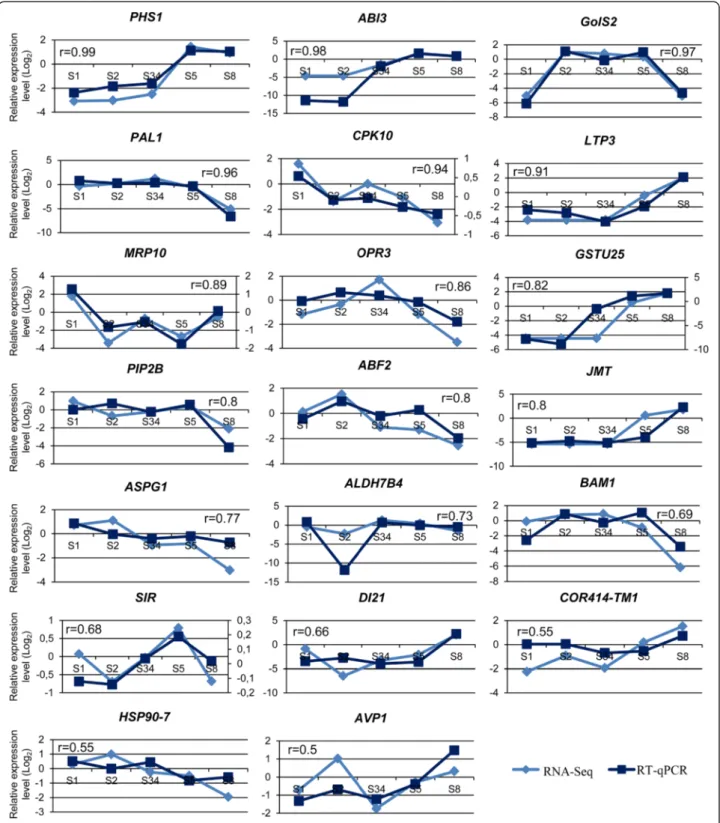
Validation of the differential expression profiles by RT-qPCR Several genes were selected to validate the data obtained by sequencing with 454 Technology (Table 6). Twenty DEGs related to water responses, seven of which also annotated as TFs, were chosen for the validation of expression profiles by reverse transcription quantitative real-time PCR (RT-qPCR). Two transcripts belong to clus-ter A, six to clusclus-ter B, three to C, four transcripts belong
to D and five to F. Correlation between the gene expres-sion levels and the profiles obtained by 454 technology was demonstrated by Pearson correlation (Fig. 5) with most of the genes showing strong or moderately strong correlation [48]. In addition, these results also validate that the transcript assemblies are correct for the sequences tested and support the robustness of the transcriptome assembly performed in this work.
Table 6 Primers used in RT-qPCR for validation of the expression profile obtained by 454 sequencing. Clustera Gene
abbreviationb Gene description Transcript name At Locus Primer sequences (forward / reverse) A MRP10, ABCC14 ABC transporter C family member 14 Contig3296 AT3G62700 GCTGCCTTTGCCCCACACT/
TGGAAGAGCCTTGAACGCTGCC A CPK10, CDPK1 Calcium-dependent protein kinase Contig4133 AT1G18890 GCTCACCTCCCTCGCACAACT/
AGGCGCGAGGTGGCGATAAT B ASPG1 Protein aspartic protease in guard cell Contig19387 AT3G18490 ATGCAGCTCGCTCGACGTGT/ TGTCGTGTCCGCAACCCAGA B ABF2 Abscisic acid responsive elements-binding
factor 2
Contig22999 AT1G45249 CGGCCTGCTTTTTCCGCAACT/ AGTCAGCTGCAAGGTCACGAGC B AVP1 Pyrophosphate-energized vacuolar
membrane proton pump
Contig 8793 AT1G15690 CGCACTTGAGAACGACGCT/ TGCGCGGTCGTCGGAATCAT B HSP90-7 Chaperone protein htpG family protein
Qs-dev_rep_c72408
AT4G24190 CAGCATCAGCTTCAGCCTCGGT/ AGCGGCTTCACGCCTTCTGA B BAM1, BMY7,
TR-BAMY
β-amylase 1 Contig 25491 AT3G23920 AACGCGAGTTTGCAGGCGCT/
CGACGTTTCCGCCGCATTGA
B GolS2 Galactinol synthase 2 Contig 17943 AT1G56600 TGACGCCATAACATGGCCAGCA/
TTGCCAGCAGTGCCCTGACA C ALDH7B4 Aldehyde dehydrogenase 7B4 Contig 9124 AT1G54100 AGGGTGCTCCAACGACTCCA/
ACGCACAGCTAGGCCGATG C OPR3 Oxophytodienoate-reductase 3 Contig 16616 AT2G06050 TTGGTCTCTAACACAGCCGCCG/
CACGGCCGACATGCCATA C PAL1 Phenylalanine ammonia-lyase 1 Contig 9321 AT2G37040 TGCTAACTGGCCGCCCCAAT/
GCCAGAACCAACAGCTGTGCCA D ABI3, SIS10 Abscisic acid insensitive 3 Contig 19318 AT3G24650 GCAGTGGCCGTGGTGCAAT/
ATGGCGAGGCAAAGGCGGTT D PHS1 Glycosyl transferase, family 35 Contig 10143 AT3G29320 TGGCTTGAGATGGGCAACCCT/
TTTGGTGTGCTCCCCGGCAT
D SIR Sulfite reductase Contig 19883 AT5G04590 TGCAATGGCATGCCCAGCCT/
ACTGGGGTTTCCACCAAGCCA
D PIP2B Aquaporin PIP2-4 Contig 24062 AT2G37170 GCTTGGGCCTTTGGTGGCA/
TGGCTCCACCACCGTACTTGCT F COR414-TM1 Cold-regulated 314 inner membrane 1 Contig 19349 AT1G29395 TGGTGAGCTTGAGCTGCCGT/
TGCAAGCTGCCTGCTCGTGA F DI21 Late embryogenesis abundant protein Contig 16865 AT4G15910 AGCGTGCTCTCACCTTGTGGT/
TGCGGCTGCATCACATGCCT F JMT Jasmonic acid carboxyl methyltransf. Contig 17776 AT1G19640 TGGCTATCTTCGCCGCCCTT/
TGCCGTGGTTTGCACCTACTTCG F GSTU25 Glutathione S-transferase TAU 25 Contig 17981 AT1G17180 ACCACCTCGTCCGCCATTGT/
AGCCTGACCGACTCCATGGCAA
F LTP3 Lipid transfer protein 3 Contig 19993 AT5G59320 TGCCCAGGCCACCATAACATGC/
TGTGGTCTTGGCCATGCCGTT a
According to their expression profiles each transcript belongs to a different cluster
b
Discussion
Based on available genomic resources and NGS tech-nologies we provide here the first overview of the dy-namics of the transcriptome along different stages of the acorn development in a Fagaceae species. The analysis of our data highlighted specific genes and processes rele-vant to better understand the molecular mechanisms involved in cork oak acorn development, and it is ex-pected that this knowledge can be transferable to other oak species of great ecological value. The studied stages of development were established according to morpho-logical criteria and to previously described reports on cork oak reproductive features [33] in order to cover the whole fruit and seed developmental process.
A set of 2,285 differentially expressed genes were iden-tified with roles in a range of biological processes. We then focused our analysis on groups of transcripts with putative functions in transcriptional regulation and traits likely relevant to seed survival and dispersal, including mechanisms related to water response, water transport and water deprivation.
A de novo transcriptome of cork oak acorn
A de novo transcriptome assembly with the data here gen-erated allowed us to identify the transcripts expressed during the acorn developmental process, some of which classified as novel. This de novo assembly facilitated the mapping of reads in unique positions since it was not necessary to allow mismatches between reads and refer-ence. In fact, we discarded the marginal number of reads mapping in several positions. Assemblers of 454 tran-scriptome data have been systematically compared using real and simulated datasets. In such reviews, Newbler [49] and MIRA [50] outperformed other as-semblers [51–54]. Newbler usually assembles longer contigs that often cover more than the 80 % of the reference sequences. MIRA joins reads in a more con-servative way than Newbler, which prevents chimeric contigs and generates bigger assemblies using more bases and containing higher number of contigs, but some of them are redundant. Kumar et al. [52] pro-posed an assembly strategy that was used for the de
novo assembly of pyrosequencing data from chickpea
[53], by merging individual assemblies using a trad-itional Overlap-Layout-Consensus assembler, such as CAP3 [55]. Merged datasets aligned better to reference datasets and were more consistent in the total span and number and size of contigs than individual assemblies. In our case, the number of complete contigs (19,146) was higher in the merged assembly than in the individ-ual ones, while the percentage of C-terminal and N-terminal contigs was smaller in the merged assembly than in any of the original assemblies (Table 3). This supports that several contigs from the same transcript
were merged. When compared with other Fagaceae transcriptomes (Additional file 2), we report the highest number of complete proteins and different unique Uniprot IDs, which evidenced the advantages of this strategy.
Pathway analysis revealed that carbohydrate metabol-ism was the group (KEGG level-2 pathway) most repre-sented in the transcriptome of developing cork oak acorns, especially in the middle stages of development. The enrichment analysis performed in the different clus-ters evidenced also the timing when a specific metabolic process appears prevalent. Using this approach, carbohy-drates metabolism and starch synthesis, were found over-represented in the transcriptome of acorns at late stages of development, both S5 and S8. However, spe-cific processes like hexose transmembrane transport were found over-represented in early stages of acorn development, where actively dividing cells contribute to a rapid growth of the fruit. In general, hexoses favour cell division and expansion, whereas sucrose favours dif-ferentiation and maturation [56]. This is also supported by the analysis of DEGs. For instance during the middle stages of acorn development, several up-regulated DEGs homologous to SUCROSE SYNTHASES were identified which are putatively involved in the synthesis of UDP-glucose and ADP-UDP-glucose linked to cellulose and starch biosynthesis [57]. These include SUCROSE SYNTHASE
3 (SUS3), and SUCROSE SYNTHASE 4 (SUS4). This is
consistent with an active synthesis of cellulose and starch during these developmental stages, possibly related to the mobilization of sucrose into pathways involved in struc-tural and storage functions. One fifth of the identified DEGs are related to carbohydrate metabolism and some of these transcripts, involved in water response or tran-scriptional regulation, are discussed below.
Response to water across acorn development
At complete maturity cork oak acorns contain a large and fleshy embryo with high water content. The natural shedding of cork oak acorns coincides with complete maturity and acorns left on the ground after shedding will either germinate or lose their viability as a result of desiccation [24]. Increased tolerance to desiccation may thus represent an important factor in cork oak regener-ation success and the identificregener-ation of transcripts related to response to water, water deprivation or water transport may prove relevant for highlighting genes with adaptive roles. In agreement with previous reports in Arabidopsis [58, 59], the DEGs annotated as being related to water re-sponses during acorn development are not fruit specific. A high number of DEGs in this category were identified in the cluster of transcripts with a higher expression at the last stage of acorn development corresponding to matur-ity, probably reflecting some reduction in water content at
this stage, but also during the early stages. The early stage of fruit and seed development is one of the most sensitive periods of the plant life cycle to abiotic stresses such as
drought [60]. Therefore, it is not surprising that tran-scripts involved in response to water stress are up regu-lated at these stages as to ensure the protection of Fig. 5 Validation of the RNA-Seq transcript profiles. Comparison of transcripts expression patterns from RNA-Seq data and from reverse transcription quantitative real-time PCR (RT-qPCR). In the y-axis it is represented the Log2of the relative expression level in each developmental stage and the five
acorn developmental stages are represented in the x-axis. The numbers above the graphics correspond to the values obtained with the Pearson correlation
offspring against conditions of low water availability com-mon during the summer.
Among the transcripts strongly related to drought stress that were identified in early development are sev-eral homologs of the RD family, including RD22 and other members not listed in Table 4 such as RD19,
RD21, RD26 and RD29B. RD22 and RD26, were
previ-ously described to respond to dehydration [61–64] and used as drought-induced marker genes in different plant species [65–69]. RD22 is expressed in the early and mid-dle stages of Arabidopsis seed development [62] and in our transcriptome analysis it is also highly expressed in the middle stages of the acorn development (S3S4, clus-ter C). During the early stage of the acorn development (cluster A), a putative homolog of MDR4 annotated as being involved in response to water deprivation was also highly expressed. MDR4 belongs to the large family of the ABC (ATP binding cassete) transporter superfamily and has been mainly characterized for its role in the basip-etal redirection of auxin from the root tip [70, 71]. With the same expression profile (cluster A) was a putative homolog of UBC32, highly induced under drought stress [72]. Recently, functional studies in tomato revealed that UBC32 is involved in the regulation of fruit ripening [73] and, it is possible that it plays a similar function in cork oak acorn development. Carbohydrate metabolism-related transcripts with homologies toβ-AMYLASE genes, which are described as contributing to osmoprotection during desiccation [74], were also found differentially expressed during acorn development. While some of the amylase transcripts, e.g. homologous to the A. thaliana chloroplast β-AMYLASEs BAM1/BAMY7, were up-regulated from the early to middle stages, other transcripts with homology to β-AMYLASEs BAM5 or BAM6 were up-regulated in later stages up to S8, being almost absent in earlier stages. The significance of these divergent expression patterns is not currently clear. It is possible that different roles related for instance to hormone signalling and/or acquisition of des-iccation tolerance involving the accumulation of soluble sugars through starch degradation [75] are played by these enzymes during seed development.
Specific to cluster D are two transcripts putatively re-lated to abscisic acid (ABA) signalling/responses, homo-logs of PHS1 and ABI3. PHS1 is a negative regulator of ABA signalling involved in the regulation of stomatal aperture [76]. Its expression pattern under different stresses vary significantly among species but it has been associated to drought responses [77]. Like in barley, we detected low expression of this transcript in early acorn development and its putative involvement in the regula-tion of starch synthesis during endosperm development [77, 78] may explain its up-regulation in later stages of seed development (S5). With the same expression profile is a homolog of a well characterized gene related to
acquisition of tolerance to seed desiccation, ABI3, puta-tively encoding a TF expressed in seeds that mediates ABA responses. In Arabidopsis, ABI3 is required during seed maturation for the accumulation of seed storage pro-teins, dormancy onset and maintenance and for the acqui-sition of seed desiccation tolerance [79, 80]. Our results seem in agreement with a tight regulation of the mecha-nisms controlled by ABI3 during cork oak seed develop-ment towards maturation, such as ABA responsiveness and synthesis and accumulation of proline in order to in-crease stress tolerance in the embryo [81]. The expression profile of ABI3 seems consistent with alterations in ABA content as described for the recalcitrant seeds (desicca-tion-sensitive) of Quercus robur [82, 83] and correspond-ing ABA-induced processes along development. Like
PHS1and ABI3, an homolog of the EARLY RESPONSIVE
TO DEHYDRATION 15 (ERD15) is up-regulated in stage S5 (cluster E). ERD genes are rapidly activated by dehydra-tion and the encoded proteins constitute the first line of defense against drought stress [84, 85]. In Arabidopsis ERD15 is a common regulator of the ABA response and salicylic acid (SA)-dependent pathway [86] encoding a protein with functions in stress responses, including drought [87].
During the last stage of acorn development (S8, clus-ter F) several transcripts protrude from the list of DEGs annotated as related to water responses. A homolog of LTP3, known in Arabidopsis to be highly expressed in mature siliques and induced by drought [88, 89], was specific to the late stages of acorn development. The Arabidopsis LTP3positively regulates the plant response to drought stress through the transcriptional activation of the cuticular wax biosynthesis to avoid dehydration [88, 89]. Also well represented in cluster F are the LATE EMBRYO-GENESIS ABUNDANT(LEA), the protein family to which DI21belongs, as well as XERO1 and LEA4–5. This protein family plays major roles in desiccation tolerance [90] and is characteristically accumulated in the last stages of seed development [91] as also observed in our data. The Arabi-dopsis XERO1 was only detected in seeds whereas DI21 was detected ubiquitously [92]. LEA4-5 highly accumulates during late Arabidopsis embryogenesis and in dry seeds, and upon constitutive expression it confers tolerance to severe drought [91]. In oil palm LEA4 is solely expressed in the mesocarp, and similarly to what we have obtained in the cork oak acorns, it is expressed in the late stages of fruit development, being probably involved in plant adapta-tion and stress (drought) responsive pathway [93]. Also DI21 is known to be up-regulated under abiotic stresses and XERO1 is thought to protect cellular components from dehydration stress [92]. Accumulation of LEA pro-teins during seed maturation and in response to altered water status was previously observed in oak species [82, 94, 95]. However, their effect in increasing drought
tolerance in oaks is not as extensive as in non-recalcitrant seeds [83]. Another worth mentioning transcript putatively related to desiccation tolerance and up-regulated in the last stage of the acorn development is a homolog of the UGT74E2, encoding a hydrogen peroxide–responsive UDP-glucosyltransferase. Ectopic expression of UGT74E2 was associated to changes in plant architecture and to an increased tolerance to drought and salt stresses [96]. In-creased tolerance to abiotic stresses, such as drought, was also verified in transgenic tobacco plants overexpressing the cotton type 3 metallothionein (GhMT3a) [97], a homo-log of which was also identified up-regulated in late acorn development. Interestingly, many members of this group are associated with fruit ripening [98–101]. Like in the cork oak acorns, also in apple and kiwifruit MT3 was barely tected in young fruits but accumulated later with fruit de-velopment and fruit ripening [98, 100] suggesting a role in the ripening process, as well as in setting drought tolerance in this phase of development.
Transcriptional regulators during acorn development Transcriptional regulators are crucial for plant develop-mental processes through their function in the regula-tion of gene expression, and fruit and seed development is no exception. In Arabidopsis which, like cork oak, has dry fruits, it has been revealed that the core and ex-tended genetic network controlling fruit development consists entirely of interactions among transcription fac-tors [46]. In fact, we found a significant number of dif-ferentially expressed transcripts coding for putative transcription factors and other transcriptional regulators along the acorn developmental stages covered by our analysis. However, our results support a slightly more prominent role of these transcripts in early development (S1 and S2) becoming less represented towards acorn maturity. In fact, it is during this stage that the tran-scription machinery seems more active as evidenced by the higher number of expressed transcripts.
Genes of the auxin response factor family (ARFs) are key regulators of auxin-modulated gene expression and can ei-ther activate or repress transcription of auxin-responsive genes [102]. A putative ortholog of ARF4 was found spe-cifically expressed in cluster A, suggesting an important role in the initial phase of the acorn development. In to-mato, ARF4 was described to repress the expression of auxin-responsive genes, playing a key role in the control of sugar metabolism during fruit development, through the regulation of photosynthetic activity as well as chloro-phyll and starch accumulation [103]. Moreover, it was found highly expressed in the pericarp tissues of immature fruit and then undergoing a marked decline at the onset of ripening associated with the increase in sugar content ac-cumulation [103]. It is possible that the transcript identi-fied in our data has similar functions in the cork oak
acorn development. Interestingly, ARF4 is a putative target gene of siRNAs produced from cleavage of the ta-siRNA locus 3 (TAS3) directed by miR390 which was re-ported as differentially expressed in cork oak tissues [104].
Two putative class II KNOTTED1-like homeobox (KNOX2) genes were also up-regulated in the early stages of acorn development, one in S1 (KNAT3) and the other one in S2 (KNAT4). KNAT3 was previously re-ported to have a role in seed development, specifically in embryo sac development and during megagametogenesis [105]. More recently, KNOX2 TFs were shown to have a critical role in establishing an alternation of generations in land plants by preventing the haploid-specific body plan from developing in the diploid plant body [106], which appears consistent with the up-regulated expres-sion of cork oak putative KNOX2 genes in early acorn developmental stages.
One putative MYB and one putative MYB-related transcripts, homologs of the Arabidopsis MYB36 and PRX72, respectively, were specifically detected in the early and mid-stages of acorn development (cluster A and C, respectively). MYB transcription factors have di-verse functions in plants including development, second-ary metabolism, hormone signal transduction, disease resistance and abiotic stress tolerance [107, 108]. MYB36 belongs to the R2R3-MYB gene family [109], which members have been described as the primary regulators of fruit flavonoid biosynthesis [110], among other func-tions [111]. Within the major flavonoid compounds present in flowers and fruits, the proanthocyanidins are astringent compounds that can offer protection during the early stages of fruit development against herbivory and pathogen attack [112, 113]. The specific presence of this transcript in the first stage of fruit development here analysed would be consistent with such a function in cork oak acorns, however, other roles should not be ex-cluded. Our study also showed that the cork oak puta-tive homolog to AtPRX72 was expressed in a specific stage of acorn developmental, S3S4 (cluster C). This may be related to the significant increase in the size of the acorn from this point onwards, and therefore in-creased cell wall expansion processes, but it can be also due to an increase in hardiness of the fruit, suggesting that this gene may function in the lignification process in cork oak acorn, consistent with previously described roles [114–117].
Transcripts identified as specifically expressed in the last stages of development, included a putative transcription factor gene of the FAR1 family, similar to the FRS4, which is a homolog of FHY3. Several studies report that FHY3 and FAR1 are required for regulating various aspects of plant processes, such as far-red-mediated seedling de-etiolation, the circadian clock, chloroplast division, and chlorophyll biosynthesis [118–124]. Tang et al. [125] have
recently reported that knock-out mutants of FHY3 and/or FAR1 have reduced sensitivity to ABA-mediated inhibition of seed germination and seedling growth, lose water faster, and are less tolerant to drought stress than are wild type plants. Given the significance of drought tolerance traits for the successful cork oak natural regeneration process, it is tempting to consider that the putative homolog of FRS4 in the cork oak mature acorn may be involved in confer-ring tolerance to water stress conditions. However, other roles are also possible [126].
Another family of proteins described as transcriptional regulators (http://plntfdb.bio.uni-potsdam.de/), the OLEO-SINS (OLEO1 and OLEO4) were also found specifically up-regulated in the last stages of the acorn development (S5 and S8). This is in accordance with the reported func-tion of these plant specific genes in the control of oil body structure and accumulation of seed reserves, affecting seed germination and embryo phenotypes [127, 128]. Recent work in different species showed an increase in their accu-mulation during seed development [129–131].
Several members of two major families of TFs were present in all stages of the acorn development, bHLH and NAC. As an example of a putative bHLH TF gene, a homolog of the Arabidopsis bHLH GLABRA3 (GL3), was up-regulated during the late stages of the acorn development (S5 and S8- cluster E) when the acorn peri-carp starts to become visible out of the cupule and turn-ing brown. If the function of this transcript is conserved, then it is tempting to speculate that its up-regulation during late acorn development is related to the regula-tion of anthocyanin biosynthesis [132, 133] that occurs during this phase, and that it may play an important function in seed dispersal by attracting herbivores. Putative NAC family members were also found along different stages of the acorn development. This family of TFs plays important roles in responses to plant biotic and abiotic stress [134, 135] but also in developmental processes such as seed and embryo development [135, 136]. Our data revealed three different up-regulated transcripts coding for the NAC protein family at the S1 developmental stage, two at S2 and S5 and one in both S5 and S8. One of these transcripts up-regulated in S1, RD26, has been mentioned above in relation to response to water [61, 63].
Conclusions
In summary, our analysis allowed to cluster transcripts dif-ferentially expressed along acorn development in different profiles showing up-regulation in specific stages of devel-opment. While the DE transcripts putatively coding for transcriptional regulators associated to several biological processes were found up-regulated in given developmental stages throughout the whole acorn developmental process, other transcripts involved in specific processes such as
response to water or carbohydrate metabolism were over-represented in particular stages. Future functional analysis of genes of interest identified in this work will be import-ant to devise successful strategies for regeneration and breeding of this important species. This is especially im-portant when considering the climate changes predicted for the Mediterranean region in the near future [137, 138] and the fact that drought is the main selection agent in Mediterranean ecosystems [21, 28]. Additionally, this data-set significantly contributes to increase the still scarce information on cork oak genomics providing tools for fur-ther molecular dissection of cork oak biology.
Methods
Plant material
Acorns were collected between mid June and late November 2009 from cork oak trees growing in private properties at six different locations in the South and Centre of Portugal: Quinta da Serra (Vila Nogueira de Azeitão), Alter do Chão, São Brás de Alportel, Monchi-que, Calhariz (Santarém) and Abrantes, after obtaining the required permissions. Samples were collected in ac-cordance with the Portuguese legislation (Decree-laws n.° 169/2001 and n.° 155/2004) for cork oak. The term acorn is here used to refer the whole structure consisting of the pericarp and all the tissues enclosed by the peri-carp including the seed. Acorns in the early stages of de-velopment (S1 to S4, Fig. 1a), were collected from 1 to 8 trees in each location and were immediately frozen in li-quid nitrogen. To obtain the samples at S5 developmen-tal stage and subsequent stages, branches bearing the acorns were kept at 4 ° C for up to 24 h before collecting the acorns and freezing in liquid nitrogen. In S8 stage samples, approximately 1/3 of the acorn part opposite to the embryo radicle was removed to minimize the pres-ence of polysaccharides that could compromise the pur-ity of isolated RNA. Additionally, some acorns from stage S3, S4, S5 and S8 were opened for embryo isola-tion (Fig. 1b); embryos from S8 stage were isolated by excising the embryo axis but excluding most cotyledonal tissue. In each collection, acorns and isolated embryos were carefully observed for evaluation and documenta-tion of the developmental stage.
RNA extraction
Frozen samples were first ground in a mill (M 20 Univer-sal mill, Ika) previously cooled with liquid nitrogen and then transferred to a cooled mortar and reduced to a fine powder. Total RNA was isolated following a protocol de-scribed by Reid et al. with some minor modifications [139]. RNA isolation was performed separately by devel-opmental stage, date of collection and mother tree.
Total RNA was purified using the RNeasy MinElute Cleanup kit (Qiagen) with on-column DNase I treatment (Qiagen RNase-Free DNase Set) and only samples with A260/280> 1.8 were used for further steps. RNA integrity was assessed in 1 % (w/v) agarose gels after ethidium bromide staining and for a rigorous assessment of RNA quality, the RNA samples were run on a RNA Pico6000 chip in Agilent 2100 Bioanalyzer RNA (Agilent). Addition-ally, each sample was quantified by fluorescence with the Quant-iT Ribogreen RNA Assay kit (Invitrogen).
Preparation of cDNA libraries and RNA-Seq
Two normalized and 5 non-normalized cDNA libraries were prepared. Normalized libraries were prepared with RNA isolated from acorn tissues or from isolated em-bryos, collected from a total of 5 and 3 trees,
respect-ively. In each library, a pool of 2 μg total RNA
containing equal amounts of RNA extracted from the several acorn (from S1 to S5, S7 and S8) or embryo de-velopmental stages (from S3 to S5 and S8) was prepared. Double stranded cDNA was obtained using SMART technology [140] and the normalization was performed with the Duplex-Specific Nuclease (DSN) technology [141].
The 5 non-normalized cDNA libraries corresponded to different acorn developmental stages (S1, S2, S3 + S4, S5 and S8) collected from 7 different trees. For each li-brary, a pool of total RNA was prepared containing 50 μg of total RNA. MicroPoly(A)Purist kit (Ambion) was used to isolate mRNA from each total RNA pool and 200 ng of mRNA were fragmented and used as tem-plate for double stranded cDNA production using cDNA Synthesis System Kit (Roche) followed by adaptor ligation.
Pyrosequencing of the normalized and non-normalized libraries was performed in the Titanium GS-FLX (454-Roche) at Biocant (Cantanhede, Portugal).
The data were deposited in the European Nucleotide Archive (ENA) under the accession number PRJEB6178/ ERP005652. For each non-normalized library the acces-sion numbers are the following: [ENA: ERX455655 for S1, ENA: ERX455656 for S2, ENA: ERX455657 for S3S4, ENA: ERX455658 for S5 and ENA: ERX455659 for S8]. For the normalized libraries [ENA: ERX455660 and ENA: ERX455661] are the accession numbers of the acorn and isolated embryo libraries, respectively.
Reads pre-processing, de novo assembly and transcriptome annotation
The full workflow is schematized in the Additional file 16. First, the raw reads were filtered by SeqTrimNext [142] to remove adapter sequences and low quality/ complexity sequences, which included fragments (win-dow of 15 nts) with a quality value lower than 20, more
than an 80 % of indeterminations, or 75 % of polyA or polyT sequences. Fragments with an E-value < 1e-10and 85 % identity to contaminants such as plastids, mito-chondria, ribosome and virus/bacteria sequences, were trimmed. Final sequences shorter than 40 nts were also excluded. RNA-Seq data was de novo assembled using MIRA version 3.4.0 [50] and Newbler version 2.6 [49]. MIRA was executed with the default 454 settings and without clipping steps. Newbler was executed with the default parameters. The individual assemblies were merged with CAP3 with default options and an identity threshold of 95 %.
Transcripts were compared with the Uniprot and Trembl databases using NCBI Blastx with an E-value of 1e-6. Only full-length plant proteins were included in the target database. “Full Lengther Next” scripts (https:// rubygems.org/gems/full_lengther_next) were used to compare the aligned regions in query and target, in order to determine the right translation frame and clas-sify the transcripts as complete, internal or terminal. These translated proteins constitute the Q. suber prote-ome used in subsequent comparisons. For those tran-scripts without any alignment, the program runs an Open Reading Frame (ORF) prediction step. Novel ORFs with a result higher than 0.7 (default threshold) were an-notated as novel transcripts. The conserved motifs and structures in the sequences of these novel transcripts were identified by comparison against the motifs data-bases in EBI Interpro (http://www.ebi.ac.uk/interpro/ interproscan.html). Transcripts were compared with the NCBI non-redundant (nr) and Arabidopsis TAIR protein databases using NCBI Blastx with an E-value of 1e-10. Results were imported in Blast2GO [143] to annotate the gene ontology terms, enzymatic protein codes and KEGG pathways. The reads of each transcript belonging to the same pathway were summed up. For each path-way, the number of reads in each stage was transformed in Z-scores, clustered, and plotted in a heatmap using Mayday [144]. Gene ontology terms and NCBI COGs (Clusters of Orthologous Groups of proteins) associated to each Arabidopsis gene were downloaded from TAIR (www.arabidopsis.org) and NCBI (ftp://ftp.ncbi.nih.gov/ pub/COG/KOG/), and associated back to the original Q. subertranscript.
The transcriptomes of other Fagaceae species were downloaded from NCBI and Fagaceae Genomics Project (www.fagaceae.org). The proteome for each of them was built in a similar way as for Q. suber by comparison with the Uniprot and Trembl full plant proteins using the Full Lengther Next scripts. Proteomes were compared by pairs using NCBI Blastp. Proteins in a query species were considered as having an orthologous in a target species if they shared both a minimal identity and cover-age of 70 %.
An alignment of the reads obtained from 19 normalized cork oak cDNA libraries prepared from different tissues and made available by [45], against the reads obtained from the normalized libraries described in this work, was performed to identify the transcripts specifically expressed in fruit and seed tissues. The de novo transcripts without aligned reads were considered as fruit and seed specific. Expression analysis and differentially expressed gene (DEG) clustering
The CLC Genomics Workbench (http://www.clcbio.-com), version 6.7.2, was used to quantify the expression of the RNA-Seq data in four steps. Firstly, the reads from each of the five non-normalized libraries were aligned to the 80,357 contigs in the Q. suber assembly using the default scoring values and ignoring reads not uniquely mapping. Secondly, the number of aligned reads in each library was normalized by quartile normalization to take into account the different total number of reads per library. Third, a statistical analysis that compares the expected versus observed propor-tions of mapped reads by Kal’s z-test [145] imple-mented in CLC software between consecutive acorn developmental stages was used to identify the differen-tially expressed genes (DEGs). Finally, p-values were False Discovery Rate (FDR) corrected. Transcripts with a FDR value lower than 0.01 were considered as differ-entially expressed (DE).
DEGs were divided in 6 clusters according to the nor-malized number of aligned reads in each stage by Neural Gas clustering implemented in Mayday [144] based on Euclidian correlation between expression values. Neural Gas is an alternative to K-means clustering that resulted in clusters with a better balance of members. The list of transcripts in each cluster was used in Blast2GO to iden-tify the enriched GO terms. Blast2GO enrichment ana-lysis was based on a F-fisher test (FDR < 0.05). The relation among GO terms was assigned using REVIGO with the Resvik algorithm option [146] and R treemap li-brary. DEGs annotated as related to response to water, including water transport and water deprivation were identified. We used the Plant Transcription Factor data-base (PLNTFDB, http://plntfdb.bio.uni-potsdam.de/) as reference to identify the TFs and other transcriptional regulators in our transcriptome. The database contains close to 30 K protein sequences of experimentally-identified elements from diverse plant species, and their classification in families according to their protein do-mains by HMM methods. The transcript sequences of the DEGs were aligned to the PLNTFDB using Blastx and a minimum E-value of 1e-10. We considered any transcript with a result under that threshold as a TF/ transcriptional regulator, and annotated it within the family of the homologous with a lower E-value.
Quantitative RT-PCR analysis
Reverse transcription quantitative real-time PCR (RT-qPCR) of a set of 20 DEGs was carried out to validate the expression profile obtained by 454 sequencing (Table 6). RNA samples were first treated with TURBO DNase (Ambion) and afterwards all cDNAs were synthe-sized from 1.5 μg of total RNA using the Transcriptor High Fidelity cDNA Synthesis Kit (Roche) with the anchored-oligo(dT)18 primers. Specific primers were designed using Geneious software [147]. Quantitative real-time PCR experiments were then performed in LightCycler 480 (Roche) using SYBR Green I Master (Roche) and 96-well plates. For the genes tested, 3 bio-logical replicates were used and the reaction mixtures were performed in a final volume of 16 μl containing 8μl of 2× SYBR Green I Master, 400 nM of each primer and 1.5μl of cDNA as template. The amplification pro-gram was the same for all genes tested: 95 ° C for 10 min, 45 cycles of 10 s at 95 ° C, 20 s at 60 ° C and
10 s at 72 ° C, except for β-AMYLASE 1 (BAM1),
GALACTINOL SYNTHASE 2 (GolS2) and CALCIUM
DEPENDENT PROTEIN KINASE 10 (CPK10) for which
the annealing temperature was 62 ° C. A calibrator sam-ple was used in each plate to normalize the values ob-tained and the potential differences among plates. Normalization was carried out with two reference genes
ACTIN(ACT) and CLATHRIN ADAPTOR COMPLEXES
(CAC) [139]. Normalized relative quantities were ob-tained through the formula NRQ¼ EgoiΛCt;goi
f ffiffiffiffiffiffiffiffiffiffiffiffiffiffiffiffiffiffiffiffiffiffiffiffi Yf oE ΔCt;refo refo q ,
where E is the efficiency of the amplification for each primer pair in each tissue, f the number of reference genes used to normalize the data, goi and ref are the gene of interest and the reference gene, respectively, and ΔCt is the Ct of the calibrator minus the Ct value of the sample in test [148–150]. The data obtained from the RNA-Seq experiment and the RT-qPCR were compared. From the RNA-Seq a logarithmic ratio of base 2 between the counts of a gene in each developmental stage and the mean counts of the same gene in all developmental stages were made. A similar approach was followed for the data obtained by RT-qPCR by doing a logarithmic ratio of base 2 between the normalized quantities of the gene of interest in each developmental stage and the mean normalized quantities of the same gene in all de-velopmental stages in analysis. For genes where the RNA-Seq values were zero in some of the developmental stages, a value of 1 was added to all the RNA-Seq results of those genes to avoid dividing by zero [151].
Availability of supporting data
The data sets supporting the results of this article are avail-able in the European Nucleotide Archive (ENA) under the