Vol.3, No.2, pp. 105-111 ISSN 1864-3361
http://www.surveymethods.org European Survey Research Associationc
The Mobile-only Population in Portugal and Its Impact in a Dual Frame
Telephone Survey
Paula Vicente
ISCTE-Lisbon University Institute
Elizabeth Reis
ISCTE-Lisbon University Institute
In 2007 the percentage of mobile-only households in Portugal reached 36%; this is one of the highest levels in EU27 countries according to the EU E-Communications Households Survey. To assess the extent and nature of the potential bias in fixed phone surveys created by the absence of mobile-only households, a dual frame survey was conducted in which both fixed phones and mobile phones were used to collect data. There are significant differences be-tween fixed phone respondents and mobile-only respondents in several demographic variables; however, we find that merging the fixed phone and the mobile-only sample produces general population estimates on substantive variables that are not significantly different from those obtained with the fixed phone sample alone.
Keywords: telephone survey methodology, mobile phone surveys, mobile-phone only house-holds, noncoverage rate
Introduction
Phone surveys are widely used in Portuguese market and public opinion surveys. Telephone interviewing has a num-ber of advantages over the traditional face-to-face interviews, namely, it allows important time and cost savings, fully-dispersed national samples can be selected, sampling can in-clude places that are difficult for interviewers to access and it is easier to make call-backs. Moreover, better control of the interviews can be achieved since they are usually conducted by means of CATI facilities.
Phone surveys are based on the assumption that their sampling frame can provide good coverage of the target pop-ulation. On one hand, this requires that only a small percent-age of the target population is missing from the sampling frame, and on the other hand, the units not in the frame can-not be very different from those included.
The percentage of households with a fixed phone in Por-tugal has never reached 100% and thus full sampling cov-erage of Portuguese households in phone surveys has never been possible. Households not covered by the phone sam-pling frame can either be considered outside the target pop-ulation – usually the target poppop-ulation is re-defined to match the sampling frame “households with fixed phone” – or they can be accounted for by some weighting procedure.
The rapid increase in mobile phone ownership in recent years has changed the market for fixed phones: many peo-ple choose not to install a fixed phone when moving to a new home or give up their fixed phone contracts to become mobile-only users. Moreover, access to Internet has been possible via wireless connections since 2000 thus freeing people from the need to have a fixed line contract for the
Contact information: Paula Vicente, ISCTE, Department of Quantitative Methods, e-mail: paula.vicente@iscte.pt
sake of Internet. As a result of these combined factors, the percentage of households with a fixed phone has been in de-cline since 2002 (Statistics Portugal 2008).
Presently, 84% of Portuguese households own a mobile phone in sharp contrast with the 59% of households with fixed phone access.1For the EU27 countries the average
per-centage of households with a fixed phone is 73% whereas 82% of households have at least one mobile phone. Portu-gal also has one of the highest percentages of mobile-only households – 36% – while the average in the EU27 coun-tries is 22% (ANACOM 2007, EU Statistics 2007). The type of phone access varies greatly from country to country in the EU27. Countries like Belgium, Italy, Spain and Ireland are above the EU27 average in terms of the percentage of mobile-only households, while others like Sweden, UK and Germany do not reach 15%; the highest percentages (over 50%) are found in Finland and Czech Republic (EU Statistics 2007). In the U.S. there is an upward trend in mobile-only households and it is estimated the percentage of mobile-only household exceeds 25% by the end of 2008 (AAPOR 2007). The already significant (and growing) number of indi-viduals who own a mobile telephone exclusively in Portu-gal poses a serious problem of non-coverage to telephone surveys that rely on fixed phone samples: the absence of mobile-only adults may create a significant bias in national survey estimates which is potentially greater if they are very different from fixed phone respondents.
This paper addresses the problem of excluding mobile-only users from telephone surveys in the Portuguese envi-ronment. Given the above mentioned figures for phone cov-erage, Portugal is positioned as a typical EU country and 1There is a discrepancy between EU Statistics and Portuguese
Statistics regarding this figure. According to Portuguese Statistics, 71% of Portuguese households have fixed phone access (Statistics Portugal 2006). We have decided to retain the EU Statistics figure to allow a better comparison of Portugal with Europe.
can serve as a case study for issues related to mobile phone interview surveys. The paper will describe the basic dif-ferences between mobile-only and fixed phone respondents across variables including demographics, Internet usage, at-titudes towards Internet and cultural practices. It will also de-scribe the consequences of blending fixed phone and mobile-only samples and the practical implications involved.
The article is organized as follows. The next section dis-cusses some of the issues posed by surveying mobile phones. We then go on to introduce the study design and refer to data collection procedures. This is followed by a comparative analysis of fixed phone and mobile-only respondents. We conclude by discussing the outcomes along with their impli-cations for survey research activity.
Mobile Phone Survey Issues
The growing number of mobile phone users and the de-crease in fixed phone penetration makes mobile phone sur-veys a potential alternative to the traditional fixed phone surveys. The key advantage of introducing mobile phone surveys is the improved coverage over fixed phone sur-veys because the segment of mobile-only households can be reached. But at the same time, mobile phone surveys pose
some methodological, technological and mode effect
prob-lems to survey practice.
The first concern regards sampling frames. The Portugal Telecom Directory (the socalled White Pages) is a sampling frame for fixed phone surveys that offers important advan-tages: it covers the entire Portuguese territory and is updated regularly. No such sampling frame exists for mobile phone surveys. Mobile phone numbers samples have to be created by a generator of random numbers but there is a high risk of generating numbers not attributed to people; this problem is exacerbated because mobile operators treat their numbering system as confidential and provide no information regarding the attribution of numbers.
A second issue relates to the fact that when dialling a mobile number it is impossible to know the location of the respondent in advance. With fixed phones, the geographic location of the person being called is indicated by the prefix to the number; this knowledge also provides further infor-mation e.g. the population density of the area and the kind of neighbourhood. A mobile phone number contains no in-formation of this kind. The lack of personal inin-formation is an additional problem, especially for prepaid mobile phones subscribers, which places some limitations regarding criteria to control in the sampling plan.
A third issue relates to non-response rates. Mobile sur-veys conducted in the U.S. revealed lower response rates for the mobile surveys due to higher refusal rate (Yuan et al. 2005, Brick et al. 2007); the fact that the receiver has to pay for the call is a likely explanation for this. In Europe, however, mobile surveys have not proved to have higher non-response rates than fixed phone surveys – the non-contact rate tends to be higher but it seems to be compensated by lower refusal rates (Roy and Vanheuverzwyn 2002, Kuusela and Simpanen 2002, Vehovar et al. 2004). In Portugal there
is still no evidence that mobile phone surveys are worse than fixed phone surveys in terms of response rates, but it is im-portant to note that some people only use mobile phones for incoming calls and set it on voicemail the rest of the time which reduces the likelihood of a successful call. Cardoso et al. (2007) estimate that 25% to 30% of people do not have their mobile phones permanently switched on.
Other problems associated to mobile phone surveys in-clude the quality of mobile communications as poor cover-age of the mobile network or battery failure which can com-promise the quality of the conversation. In addition, mode-effects can arise since the noise and passers-by can cause confusion and a lack of privacy when a call is received on the mobile phone in a public place so that responses may be inhibited due to a loss of concentration.
Finally, there are cost considerations. As in most coun-tries, mobile phone calls in Portugal are more expensive than fixed phone calls and therefore using mobile phones to con-duct interviews increases the calling expenses of a survey.
Data collection
A national survey on the general population of Por-tuguese adults (age ≥ 15 years) was conducted by the Mark-test survey company. Responses were obtained through mo-bile phone interviews and fixed phone interviews conducted at the company’s CATI centre.
For the Fixed Sample the Portugal Telecom Directory was used as sampling frame. An interval, K, was formed by dividing the population count of telephone numbers in the frame, N, by the desired sample size, n. The frame of phone numbers was divided into n intervals of size K tele-phone numbers. From each interval, one teletele-phone number was drawn at random.
The Mobile Sample was not list-assisted as there is no database of mobile phone numbers. Mobile phone numbers were created by a generator of 9-digit random numbers. The selection method was much like a simple random sample from a set of numbers, not all of which have necessarily been attributed to people by operators.
In the Fixed Sample, interviews were conducted with the last birthday adult (age ≥ 15) at home at the time of the call, or if this adult was absent, with any other adult available at the time of contact. In the Mobile Sample, interviews were conducted with the person who answered the phone; inter-viewers verified that the person was aged 15 or older and in a safe place to talk before administering the survey. The same team of interviewers conducted both surveys.
By design the sample sizes were identical. Both for the fixed sample and the mobile sample 1000 interviews were conducted. In the mobile sample, 53% of the respondents were dual users i.e. have a mobile phone and fixed phone access, and 47% were mobile-only users. Among the fixed phone sample, 26% of the respondents were fixed-only and 74% were dual users.
Of the 11617 numbers dialled for the mobile sample 4745 (41%) were coded as attributed numbers. In the fixed phone sample calls were placed to a total of 4144
num-Table 1:Results of the Calls by Survey Mode
Results of calls Mobile survey Fixed survey Interviews conducted 1000 1000
Refusals 496 344
No answer 3188 1711
Out-of-the-scope (age<15) 61 0 Total numbers dialed 11617 4144 Non-attributed numbers 6872 1089
bers, 3055 of which (74%) were coded as connected/working
numbers (Table 1). Response rates for the two samples were computed using American Association of Public Opinion Research (AAPOR 2006) definitions. The RR4 was 21.3% for the mobile phone sample and 32.7% for the fixed phone sample. The cooperation rate (COOP4) was also lower in the mobile phone sample – 66.8% (versus 74.4% in the fixed phone sample).
The same questionnaire was used for the mobile and fixed phone surveys; it included questions about Internet us-age, attitudes towards the Internet, cultural practices and de-mographics. The fixed sample questionnaire included an
ad-ditional question about having/not having a mobile phone,
while the mobile sample questionnaire included a question about having/not having a fixed phone access at home.
Comparisons between fixed and
mobile-only samples:
Demographics
A logistic regression analysis was conducted in order to identify the most influential drivers of mobile-only sta-tus among the demographic factors collected by the survey. The aim was to study to what extent the absence of mobile-only users from telephone surveys can create a bias. The logistic model was constructed by testing the main effects of the independent variables: gender, age, educational level, professional status, family life-cycle and region of residence,
and by taking the Telephone Access, coded as 1 = mobile
phone-only and 0= fixed phone, as the dependent variable.
The fixed plus mobile-only sample size is n=1470, 32% of
whom are mobile-only and the rest fixed phone.
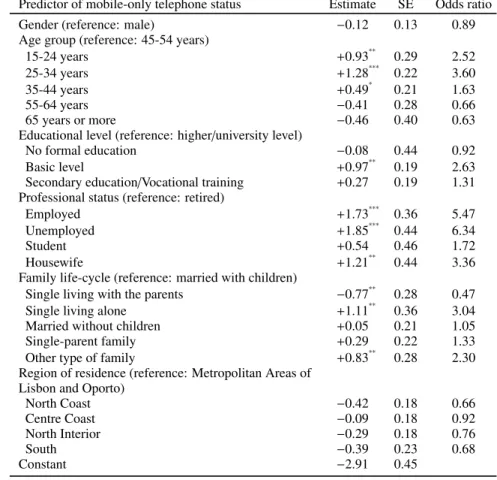
Estimates from the Binary Logistic Model on the proba-bility of having a mobile phone and no fixed phone connec-tion are presented in Table 2. The model suggests that the probability of being a mobile-only user varies by age (sig-nificant effect at p < 0.000), educational level (p < 0.000), professional status (p < 0.000) and family life-cycle status (p < 0.000). Gender (p > 0.377) and geographic region of residence (p > 0.136) are not significant predictors of having only a mobile phone.
The likelihood of relying solely on a mobile phone is higher among the youngest age groups. In odds metric, hold-ing all other variables constant, for every mobile-only user aged 45 to 54 years we estimate nearly four individuals aged
25 to 34 years (odds ratio = 3.60 : 1) and more than two
and a half (2.52 : 1) individuals aged 15 to 24 years in the
same condition. Even if the pattern is not entirely linear, the odds of relying solely on a mobile phone decrease as age increases.
The educational level of the individual has a signifi-cant effect on mobile-only telephone status although a clear pattern of influence cannot be identified. The odds of be-ing a mobile-only user are two and a half times higher for those with a basic educational level than those with a higher/university level (the reference category).
Professional status is also a significant predictor of the mobile-only status: belonging to the active population (either employed or unemployed) has a significant and positive asso-ciation with only status. The odds of being a mobile-only user in the employed group are five times higher (odds ratio = 5.47 : 1) and in the unemployed group are six times higher (odds ratio= 6.34 : 1) than in the retired group (our baseline category). Finding a mobile-only user is also more likely in the housewives group than in the retired group.
Finally, family life-cycle is also relevant as the odds of single people living alone being mobile-only users are more than three times the same odds for married people with chil-dren. Single people living with their parents are also sig-nificantly associated with the mobile-only status although in a negative way; this is explained by the fact that they are not living in their own house but in that of their parents who belong to the older age group that tends to own a fixed tele-phone. A significant effect is also found for the other type of family category which includes divorced and widowed peo-ple living alone. The baseline category can be linked to a more complex family structure that requires better connec-tion than other types of families. As a result, it is not totally unexpected that “simple” families, e.g. people living alone, rely solely on the mobile phone.
On balance, the logistic regression results indicate that the most significant correlates of mobile-only status comes from personal characteristics – being young –, from profes-sional characteristics – belonging to the active population –, and from family life cycle – either living alone or having no children.
These results replicate to some extent the findings re-garding the mobile-only phenomena in other countries. In France, those who own a mobile phone exclusively tend to be younger, are more often from lower socio-professional categories and are increasingly a part of households con-taining only one person (Roy and Vanheuverzwyn 2002). In Finland, mobile-only users are more likely to be found among people living alone, aged ≤ 25 years and with lower monthly income levels (Kuusela and Simpanen 2002). Re-garding Italy, being single, aged 31 to 35 years, with lower secondary education, belonging to middle class and living in rented houses is more strongly associated with mobile-only status than with other types of phone arrangement (Callegaro and Poggio 2004). In the U.S., mobile-only status is heavily influenced by age (more appealing for younger people) and marital status (more frequent among single people without children) (Keeter 2006, Keeter et al. 2007).
Table 2:Logistic Regression Model for Predicting Mobile-Only Telephone Status
Predictor of mobile-only telephone status Estimate SE Odds ratio Gender (reference: male) −0.12 0.13 0.89 Age group (reference: 45-54 years)
15-24 years +0.93∗∗ 0.29 2.52 25-34 years +1.28∗∗∗ 0.22 3.60 35-44 years +0.49∗ 0.21 1.63 55-64 years −0.41 0.28 0.66 65 years or more −0.46 0.40 0.63 Educational level (reference: higher/university level)
No formal education −0.08 0.44 0.92 Basic level +0.97∗∗ 0.19 2.63 Secondary education/Vocational training +0.27 0.19 1.31 Professional status (reference: retired)
Employed +1.73∗∗∗ 0.36 5.47 Unemployed +1.85∗∗∗ 0.44 6.34
Student +0.54 0.46 1.72
Housewife +1.21∗∗ 0.44 3.36 Family life-cycle (reference: married with children)
Single living with the parents −0.77∗∗ 0.28 0.47 Single living alone +1.11∗∗ 0.36 3.04 Married without children +0.05 0.21 1.05 Single-parent family +0.29 0.22 1.33 Other type of family +0.83∗∗ 0.28 2.30 Region of residence (reference: Metropolitan Areas of
Lisbon and Oporto)
North Coast −0.42 0.18 0.66 Centre Coast −0.09 0.18 0.92 North Interior −0.29 0.18 0.76 South −0.39 0.23 0.68 Constant −2.91 0.45 n=1470 ∗ p < 0.05 ∗∗ p < 0.01 ∗∗∗ p < 0.001
Comparisons between fixed and
mobile-only samples: survey
estimates
We selected 23 items from the questionnaire regarding Internet usage, attitudes towards the Internet and cultural practices. For most indicators, the category chosen for anal-ysis was the one most central to the original purpose of the study; for example, for most measures of Internet use, we chose the percentage of regularly using a given functionality. Where the choice of a category was not obvious, we selected the substantive category with the greatest difference between the fixed phone and the mobile-only users.
We begin by a descriptive analysis of the differences be-tween adults from the fixed phone and the mobile-only group on the 23 selected items of the questionnaire. The estimates for the fixed phone sample were weighted to align the sample obtained with the Statistics Portugal estimates for the cross-classifications of sex and age, sex and educational level and age and professional status as well as for marginals of re-gion of residence. The results of the mobile-only sample are
unweighted because the objective of this analysis is merely descriptive – how do the opinions and behaviors of the two groups compare? The column “fixed minus mobile-only” in Table 3 contains the results of this comparison.
Across the 23 indicators, the mean difference between
point estimates for the fixed phone sample and the mobile-only sample was 4.6 percentage points. Differences of 6 per-centage points or larger are statistically significant. The dif-ferences between fixed and mobile-only samples are largest on measures that tend to vary by age and/or by professional status.
Usage of the Internet at home is much higher among fixed phone sample (66%) than among the mobile-only sam-ple (51%). Similarly, mobile-only users are less likely to have attended courses to learn how to work with the Inter-net (25% for the fixed phone, 14% for the mobile-only), to spend more than seven hours a week on the Internet (48% for the fixed phone, 39% for the mobile-only) or to check their e-mail account regularly (78% for the fixed phone, 71% for the mobile-only). The exception is found in the search for job-related information on the Internet which is more
T able 3: Di ff erences between estimates by sample design Fix ed phone Mobile-only Mer ged samples Di ff erence Di ff erence sample sample (fix ed plus (fix ed minus (fix ed minus % % mobile-only) mobile-only) mer ged samples) (n = 1000) (n = 470) (n = 1470) Uses the Internet at home 66 51 64 + 15 ∗∗ + 2 Frequently discusses political matters 55 44 51 + 11 ∗∗ + 4 Has attended courses to learn ho w to w ork with the Internet 25 14 21 + 11 ∗∗ + 4 Spends more than 7 hours a week at the Internet 48 39 45 + 9 ∗ + 3 Re gularly checks the e-mail account 78 71 75 + 7 ∗ + 3 Re gularly uses the Internet to search for job-related information 27 34 27 − 7 ∗ 0 Agrees Internet allo ws to access information that cannot be reached 79 85 81 − 6 ∗ − 2 by other means T ries to con vince others about her /his opinion 54 60 56 − 6 ∗ − 2 Re gularly read mag azines and ne wspapers on-line 53 48 52 + 5 + 1 Re gularly do wnloads videos /g ames /music from the Internet 25 20 22 + 5 + 3 Reads the ne ws in ne wspapers daily 40 45 43 − 5 − 3 W atches the ne ws on TV daily 82 78 81 + 4 + 1 Already bought something via Internet 36 33 35 + 3 + 1 Agrees the information av ailable on the Internet is credible 63 61 60 + 2 + 3 Agrees that Internet mak es the contact with other cultures and 93 95 94 − 2 − 1 lifestyles easier Agrees that Internet mak es communicating with people and 94 96 95 − 2 − 1 institutions easier Listens to the ne ws on the radio daily 46 48 46 − 2 0 Read more than 10 books last year 32 33 33 − 1 − 1 Has de v eloped friendships via Internet 26 27 25 − 1 + 1 Re gularly participates in chat rooms 18 19 19 − 1 − 1 Re gularly uses the Messenger to communicate with friends 57 58 57 − 1 0 Agrees that Internet is user -friendly 91 91 92 0 − 1 Member of a virtual community 13 13 13 0 0 ∗ p < 0.05 ∗∗ p < 0.01
likely to be done by mobile-only users (27% for the fixed
phone, 34% for the mobile-only). We find modest di
ffer-ences between the fixed and mobile-only sample for the on-line reading of magazines and newspapers, the
download-ing of videos/games/music and news on TV watching; once
again the mobile-only users are less likely to conduct these activities than fixed phone respondents.
The discussion of political issues is more frequent among fixed phone respondents (55%) than mobile-only re-spondents (44%); given that mobile-only rere-spondents tend to be younger, this outcome is to a great extent in keeping with the “lack of interest in politics among Portuguese youths” proved by the research conducted by the Youth Observatory (2005).
As a number of differences (demographic, attitudinal and behavioural) were found between respondents contacted on the fixed phone and those that could only be reached by mo-bile phone, we then seek to investigate the potential bias in survey estimates resulting from non-coverage of mobile-only adults. In particular we try to assess to what extent tradi-tional telephone survey estimates would be affected by the inclusion of mobile-only respondents. We compare the sur-vey estimates based only on the fixed phone sample with the weighted estimates based on the merged samples (fixed phone plus mobile-only respondents). The set of weights used for the merged sample estimates was created to align the sample with the EU Statistics estimates of telephone sta-tus in Portugal i.e., 38% of mobile-only phone versus 62% of fixed phone (excluding the 5% that have no kind of tele-phone). In addition, poststratification was performed to align the merged sample with the Statistics Portugal estimates on the five demographic variables used in the fixed phone sam-ple. The column “fixed minus merged sample” in Table 3 contains the results of this comparison.
If respondents from the mobile-only sample were in-cluded with fixed phone respondents, survey estimates would change by no more than 4 percentage points and the aver-age change would be 1.7 percentaver-age points. If we restrict the analysis to the items where statistically significant dif-ferences have been previously found, the mean of the differ-ences between the fixed and the merged samples is 2.5 per-centage points versus the 9 perper-centage points obtained when comparing the fixed with the mobile-only sample.
Discussion
The results of our study suggest that while mobile-only respondents differ considerably from fixed phone respon-dents, when blended with the fixed phone sample they do not produce a significant change in the general population esti-mates on substantive variables. This is explained by the fact that mobile-only respondents are the smaller part of the pop-ulation; moreover, the difference between these two kinds of respondents is not sufficiently big for most measures.
Nevertheless, it is important to note that it may be im-possible to ignore the consequences of small percentage dif-ferences depending on the purpose of the study in question and the decisions to be based on it. While the bias
intro-duced by the absence of mobile-only users is likely to be relatively unimportant for many public opinion surveys and market surveys, the decision to ignore the population that can only be reached by mobile phone may be a cause of signifi-cant non coverage bias in studies requiring greater accuracy, such as pre-election polls, or where important sub-groups are likely to be under-represented among fixed phone respon-dents. Consequently, the impact of excluding the mobile-only population from telephone surveys depends ultimately on how accurate the results of a survey need to be, which in turn depends on the nature and purpose of the study and on how the results will be used.
Opting for dual frame designs, i.e. contacting those who have fixed phone access via fixed phone and contacting via mobile phone those who exclusively use mobile phones, as a means of compensating for coverage error has a number of practical implications. Above all, mobile phone calls are more expensive than fixed phone calls which imply that any strategy based on mobile communications will increase the cost of conducting surveys.
Another issue is the eligibility rates; the problem results from the fact that there are no existing sampling frames of mobile phones, either for dual users or for mobile-only users. This means that samples have to be randomly generated and significant amounts of screening are necessary to identify ac-tive numbers and then mobile-only users. In our survey, 6872 of the 11617 mobile numbers dialled were non-attributed numbers i.e. 59.2% of the numbers were of no use. Given that the task of “dialling and waiting to hear that the number is not connected” lasts on average 15 seconds, it took nearly 28 hours to screen those 6872 numbers. No such time was wasted in the fixed phone survey.
Given the methodological and cost implications associ-ated with mobile phone based designs, the benefit of dual frame designs that combine mobile-only respondents with fixed phone samples appears to be marginal, at least at present. Nevertheless, the continuous growth in the size of the mobile-only population and its continued concentration among specific groups of the population mean that its poten-tial impact warrants continued study.
Acknowledgements
This work has been supported by Marktest, Lda and by the Survey Methodology and Statistics Research Centre (GI-ESTA) of the ISCTE-Lisbon University Institute. We also wish to thank the referees for their helpful comments.
References
American Association for Public Opinion Research (AAPOR). (2006). Standard Definitions: Final Dispositions of Case Codes and Outcome Rates for Surveys. Lenexa, KS: AAPOR. American Association for Public Opinion Research (AAPOR).
(2007). Special Journal Issue Analyzes Challenges of Cell-Only Americans to Survey Research. Available at: http://www.aapor.org/specialjournalissueonchallengesofcellonly americans.
Autoridade Nacional das Comunicac¸˜oes (ANACOM). (2007). Sala de Imprensa: N´umero de assinantes do servi¸co
telef´onico m´ovel aumenta 10% em 2007. Available at: http://www.anacom.pt/template9.jsp?categoryId=1643. Brick, J. M., Brick, P., Dipko, S., Presser, S., Tucker, C., & Yuan, Y.
(2007). Cell Phone Feasibility in the U.S.: Sampling and Call-ing Cell Numbers Versus Landline Numbers. Public Opinion Quarterly, 71, 23-29.
Callegaro, M., & Poggio, T. (2004). Where Can I Call You?: The Mobile Phone Revolution and Its Impact on Survey Research and Coverage Error - A Discussion of the Italian Case. Pa-per presented at the 6thInternational Conference on Logic and
Methodology, Amsterdam, Netherlands.
Cardoso, G., Espanha, R., Ara´ujo, V., & Gomes, M. C. (2007). O mercado nacional das comunica¸c˜oes m´oveis. OberCom Work-ing Report.
EU Statistics. (2007). Special Eurobarometer 274: E-Communications Households Survey. Available at: http://ec.europa.eu/public opinion/archives/ebs/ebs 274 sum en.pdf.
Keeter, S. (2006). The Impact of Cell Phone Noncoverage Bias on Polling in the 2004 Presidential Election. Public Opinion Quarterly, 70, 88-98.
Keeter, S., Kennedy, C., Clark, A., Tompson, T., & Mokrzycki, M. (2007). What’s Missing from National Landline RDD Surveys?
The Impact of the Growing Cell-Only Population. Public Opin-ion Quarterly, 71, 772-792.
Kuusela, V., & Simpanen, M. (2002). Effects of Mobile Phones on Telephone Survey Practices and Results. Paper presented at the International Conference on Intelligent Computing, Copen-hagen, Denmark.
Roy, G., & Vanheuverzwyn, A. (2002). Mobile Phone in Sam-ple Surveys.Paper presented at the International Conference on Intelligent Computing, Copenhagen, Denmark.
Statistics Portugal. (2008). Estat´ısticas das comunica¸c˜oes 2006. Instituto Nacional de Estat´ıstica.
Vehovar, V., Belak, E., Batagelj, Z., & Cikic, S. (2004). Mobile Phone Surveys: The Slovenian case Study. Metodoloski zvezki, 1, 1-19.
Youth Observatory. (2005). Estudo sobre os Jovens Por-tugueses. Available at: http://recursos.juventude.gov.pt/IPJ
observatorio.pdf.
Yuan, A., Allen, B., Brick, J. M., Dipko, S., Presser, S., Tucker, C., et al. (2005). Surveying Households on Cell Phones - Re-sults and Lessons.Proceedings of the Survey Research Methods Section, American Statistical Association.