Preventive practices of cancer
screening in women: comparison
of estimates from ISA – Capital
survey and the
telephone-based Surveillance of Risk and
Protective Factors for Chronic
Diseases (VIGITEL – São Paulo)
Práticas preventivas de detecção de
câncer em mulheres: comparação
das estimativas dos inquéritos de
saúde (ISA – Capital) e vigilância
de fatores de risco e proteção para
doenças crônicas por inquérito
telefônico (VIGITEL – São Paulo)
Neuber José SegriI
Priscila Maria S. Bergamo FranciscoII
Maria Cecília Goi Porto AlvesIII
Marilisa Berti de Azevedo BarrosII
Chester Luiz Galvão CesarI
Moisés GoldbaumIV
Deborah Carvalho MaltaV,VI
IDepartment of Epidemiology of the School of Public Health at Universidade de
São Paulo (USP) – São Paulo (SP), Brazil
IIDepartament of Social and Preventive Medicine of Faculdade de Ciências Médicas
at Universidade Estadual de Campinas (UNICAMP) – Campinas (SP), Brazil
IIIInstitute of Health – Secretariat of Health –São Paulo (SP), Brazil
IVDepartament of Preventive Medicine of the School of Medicine at
Universidade de São Paulo (USP) – São Paulo (SP), Brazil
VCoordination of Non-Communicable Diseases and Conditions – Secretariat of
Health Surveillance – Ministry of Health – Brasília (DF), Brazil
VIDepartament of Maternity Nursing and Public Health of the Nursing School at
Universidade Federal de Minas Gerais (UFMG) – Belo Horizonte (MG), Brazil
Financial Support: Health Secretariat of São Paulo, by means of an accord with the Center of Support to the School of Public Health (FSP/USP) and support by Research and Projects Financing (FINEP).
Correspondence to: Department of Epidemiology of the School of Public Health at Universidade de São Paulo (USP) – Av. Dr. Arnaldo, 715. Bairro: Cerqueira Cesar,– CEP: 01246-904 – São Paulo (SP) – Brazil – Email: [email protected].
Conflict of interest: nothing to declare.
Abstract
Objective: he aim of this study was to compare estimates of Pap smear and mammogram screening obtained from household and telephone surveys in women living in São Paulo in 2008, according to sociodemographic characteristics, and to measure the diferences observed from those estimates. Methods: he study compared data from ISA – Capital 2008, a household survey conducted in São Paulo by Univer-sidade de São Paulo (USP), Universidade Estadual de Campinas (UNICAMP) and the State Health Department with support from the Municipal Health Department, and VIGITEL – São Paulo, a telephone-based Surveillance of Risk and Protective Factors for Chronic Diseases. Estimates of Pap smear and mammography, as well as their realization in the year prior to the interview, were compared according to type of survey (household/telephone) by Poisson regres-sion adjusted for age and education. Results:
here were no statistically signiicant difer-ences between the estimates obtained by VIGITEL and ISA – Capital as to the preva-lence of mammography in the year prior to the interview. However, global estimates of the Pap smear at least once in life and in the past year, as well as mammograghy at least once in life, shown statistically signii-cant diferences, with higher prevalence rates of coverage among those interviewed by telephone. Conclusion: he results indicate a tendency to overestimate cover-age of mammography and Pap smear in the telephone survey data, which indicates the need for new studies that also contribute to a better understanding of the diferences observed by diferent types of surveys.
Introduction
Breast cancer and uterine cervical neoplasm present high rates of incidence and mortality. Depending on the stage, both are prone to early detection and cure1-3. Among the preventive practices recommended for breast cancer screening, mammography enables the identiication of subclinical lesions1,2. As to uterine cervical neoplasm, the Pap smear is considered eicient for the early detection3,4.
According to Viacava, Souza-Junior and Moreira5, estimates on the coverage of mammography obtained by household surveys have been used to monitor actions related to early detection of breast cancer in many countries, to assess the efect of the increased coverage in the reduction of mortality and the increase of survival rates. In Brazil, data from diferent population surveys have been used to estimate the coverage of mammography and Pap smear5-9.
Population-based surveys are commonly used in epidemiological research and represent one of the most traditional study designs to obtain information on diferent dimensions related to the health-disease process. hey are also essential to monitor the prevalence of health problems and the magnitude of social inequalities in health as to the study of access and use of medical care10,11.
In countries with wide telephone coverage, telephone surveys are common12-15. In Brazil, a pilot system of telephone survey was successfully estab-lished in São Paulo to analyze risk factors for chronic non-communicable diseases in 200316. In 2006, the Ministry of Health adopted the system, which was distributed to all Brazilian capitals and the Federal District17.
Due to the recent use of this type of survey in the health ield, it is necessary to compare its estimates with those obtained by household surveys, which are more traditional14,18, in order to study its validity
Resumo
Objetivo: O objetivo deste estudo foi compa-rar estimativas obtidas em inquéritos domici-liar e telefônico, da realização dos exames de Papanicolaou e mamograia em mulheres residentes no município de São Paulo em 2008, segundo características sociodemográ-icas, bem como dimensionar as diferenças observadas. Métodos: Foram utilizados os dados do ISA – Capital 2008, inquérito domici-liar realizado no município de São Paulo pela Universidade de São Paulo (USP), Universi-dade Estadual de Campinas (UNICAMP) e Secretaria de Estado da Saúde com apoio da Secretaria Municipal de Saúde de São Paulo, e do VIGITEL – São Paulo, inquérito telefôni-co realizado pelo Ministério da Saúde para Vigilância de Fatores de Risco e Proteção para Doenças Crônicas. Estimativas da realização do exame de Papanicolaou e mamograia na vida, bem como a realização no último ano foram comparadas segundo o tipo de inquérito (domiciliar/telefone) por meio de regressão de Poisson ajustada por idade e escolaridade. Resultados: Não foram encon-tradas diferenças estatisticamente signiican-tes entre as estimativas obtidas pelo VIGITEL e ISA – Capital para as prevalências de reali-zação de mamograia no último ano. No entanto, para as estimativas globais de reali-zação do exame de Papanicolaou alguma vez na vida e no último ano e da mamograia na vida, foi possível veriicar diferenças estatisti-camente signiicantes, com prevalências de cobertura superiores entre as entrevistadas pelo inquérito telefônico. Conclusão: Os resultados sinalizam a tendência de superes-timação de alguns indicadores de cobertura de mamograia e de exame de Papanicolaou nos dados de pesquisa via telefone, apontan-do a necessidade de novos estuapontan-dos que também contribuam para o melhor entendi-mento das diferenças observadas com o uso de diferentes modalidades de inquéritos.
and information bias. he importance of comparison is reinforced by the advantages presented by telephone surveys, which are low cost and speed16,19, enabling the periodic collection of information to monitor risk factors in the population.
he objective of this study was to compare estimates of Pap smear and mammogram screening obtained from household survey (ISA-Capital) and telephone survey (VIGITEL) in women living in São Paulo in 2008, according to sociodemographic characteristics, and to measure the difer-ences observed from those estimates.
Methods
In order to compare prevalence estimates of preventive tests, data from two types of health surveys were used: a household (ISA – Capital 2008) and a telephone survey (VIGITEL – São Paulo 2008).
ISA – Capital 2008
he health survey in the city of São Paulo (ISA – Capital 2008) is a cross-sectional population-based study that was conducted in 2008 with the objective of analyzing life and health conditions, including the access to medical care, by means of household interviews.
Since 2002, the same group of researchers that are responsible for ISA – Capital 2008 has been performing household health surveys in areas of the State of São Paulo, including its capital. he irst one, ISA-SP20, consisted of 6,819 interviews with people in two cities of the state (Botucatu and Campinas) and in two areas of the metropolitan region of São Paulo (the irst one comprises the cities of Taboão da Serra, Embu and Itapecerica da Serra, and the second one is compounded by the districts Vila Sônia, Morumbi, Rio Pequeno, Raposo Tavares, Jaguaré e Butantã). In the following year, for ISA – Capital 2003, 3,357 people were interviewed to compose the probability sample of the city of São Paulo.
After 5 years, ISA – Capital 2008 inter-viewed 3,271 people of all ages, living in the urban area of the city, with the objective to analyze life and health conditions of the population, as well as possible changes that might have happened in the period.
Considering a two-stage cluster sampling, which the irst one comprised of census tracts (70) and the second one of households (2,249), the residents were drawn to compound the sample of 8 demographic domains (individuals aged less than one year; 1 to 11 years; 12 to 19 years, males and females; 20 to 59 years, males and females; 60 years or older, males and females). he sample of the smaller group (younger than 1 year old) consisted of 300 children, based on an estimated proportion of 50% (p=0.50), 95% conidence level (z=196), sampling error of 7% and design efect of 1.5 (def=1.5)21,22.
Data from the participants were obtained by a questionnaire structured into themes, according to life conditions, lifestyles, health status, as well as access and use of health services. hese questionnaires were given by the interviewers, and directly answered by the residents. After data-collection, questionnaires were double-typed in the Epidata software; afterwards data went through a validation and consistence process for the establishment of the inal databank, performed with the software Stata 10.0.
VIGITEL – São Paulo 2008
he telephone-based Surveillance of Risk and Protective Factors for Chronic Diseases (VIGITEL) is a monitoring system established by the Ministry of Health and, since 2006, it has interviewed more than 54,000 people a year in the 26 Brazilian capitals and the Federal District by means of telephone landline interviews.
A probability sample of the population aged 18 years or older was performed in two stages: drawing of telephone lines and afterward selection of one resident in the household to be interviewed. In 2008, a total of 2,013 individuals were interviewed in the city of São Paulo, which enables to estimate the prevalence of risk factors for chronic non-communicable diseases with a 95% conidence coeicient and a maximum error of 2 percentage points17.
To obtain information by telephone, a computer was used to immediately read and register the responses of the partici-pants. his questionnaire was comprised of questions regarding demographic and socioeconomic characteristics of the individuals, as well as information on health status, preventive practices, eating habits and physical activity associated with chronic non-communicable diseases17.
Sampling weights are attributed to each individual interviewed by VIGITEL in order to compensate for the diferent selection probabilities and to decrease bias resulting from non-response and the lack of universal telephone line coverage. he weight is a result of the multiplication of three factors. he irst one considers the number of telephone lines in the selected household; the other is related to the number of adults in the household; and the last is a post-stratiication factor calculated based on data from Census 2000, considering 36 sociodemographic strata resulting from the combination of two categories of gender, six categories of age (18-24, 25-34, 35-44, 45-54, 55-64 and 65 years or older) and three levels of schooling (0-8, 9-11, 12 years of schooling or more)17,23.
Comparison of survey estimates
In this study, 2,443 non-institution-alized women aged 20 years or more, living in the urban area of the city of São Paulo in 2008 were considered; 1,238 were interviewed by ISA – Capital and 1,205 by VIGITEL – São Paulo.
At irst, the population was charac-terized as to age (in years), marital status (single, married or with a partner, widower, separated or divorced), schooling, consid-ering full years of study (0 to 8, 9 to 11, 12 years or more) and skin color/ethnicity (white and non-white); indigenous women were included in the non-white category.
Afterwards, prevalence estimates of Pap smear and mammogram screening, as well as the time in relation to the last doctor appointment, were obtained and compared as to the type of survey (household/ telephone).
It is important to emphasize that infor-mation from both surveys were gathered in one databank, according to Lee et al18, who recommends this combination must be performed in a way that all variables have the same name and the same response categories, and that a new variable must be created to identify from which bank (survey) the observation comes from (Chart 1).
Estimates related to sociodemo-graphic characteristics of both surveys were compared by the Student’s t-test for independent samples. Prevalence rates of preventive tests were compared by Poisson regression so that the dependent variable would be the characteristic of interest (prevalence of examinations and time in relation to the last appointment), and the independent variable would be the one to identify the type of survey (household/ telephone). hus, if this independent variable were statistically signiicant, there would be enough evidence to assume the existence of diferences between the two types of surveys, considering a p-value of 0.05 for the Wald test.
diferent years, which led to diferent sampling distributions by age and schooling, these variables were included as adjustment in order to obtain prevalence ratio estimates.
he software Stata 10.0 was used to analyze these data because it allows the inclusion of diferent features of the sampling complex design, present in both types of surveys (sampling weights and primary sampling units)21,24.
he project to establish VIGITEL was approved by the Human Research Ethics Committee of the Ministry of Health, and the research project ISA – São Paulo
was approved by the Research Ethics Committee of the School of Public Health at Universidade de São Paulo, protocol n. 381 (protocol 13/01).
Results
he estimated mean age of women living in the city of São Paulo according to ISA – Capital was 43.9 years (95%CI; 42.5 – 45.2), and 41.9 years (95%CI; 40.7 – 43.0) according to VIGITEL – São Paulo, which is signiicantly lower (p=0.0026).
he percentage distribution of women as to marital status, skin color/ethnicity and
ISA – Capital 2008 n=1,238
VIGITEL – SP 2008 n=1,205
Unique databank n=2,443
Age (years)
__ years old
How old are you (years)
__ years old
Age (years)
- Quantitative variable
What is your marital status?
Married Stable union Single Separated Divorced Widow
What is your current marital status?
Single
Married/with a partner Widow
Separated/divorced
Marital status (4 categories)
-Single
-Married+With a partner -Separated+Divorced -Widow
Until which grade did you go to school?
Never/cannot read and write Never/can read and write Primary school
Secondary school
Technical secondary school Incomplete superior education Complete superior education Do not know
Did not answer
Until which grade did you study?
Primary school Admission Primary school
Secondary school or technical or normal or scientific secondary school Superior education
post-graduation (specialization, masters, doctorate)
Never studied Do not know
Schooling (3 categories)
-0 to 8 years -9 to 11 years -12 years or more
What is your color or ethnicity?
White Black Brown Yellow Indigenous
Do not know/Did not answer
Your skin color is:
White Black Brown or dark
Yellow (east descendency) Red (indigenous descendency) Do not know
Did not want to inform
Race (2 categories)
-White -Non-white
Chart 1. Variables of ISA – Capital 2008 survey, VIGITEL 2008 survey used in combined data bank. São Paulo, 2010
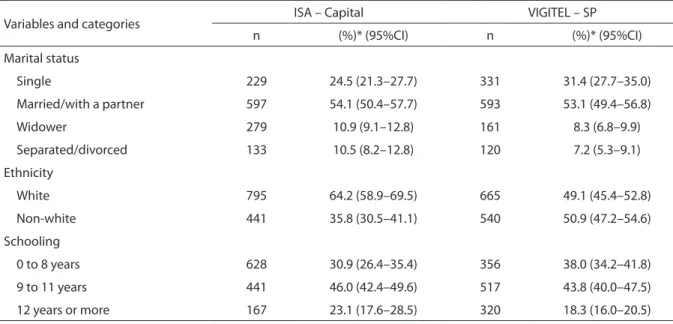
schooling according to both types of survey are demonstrated in table 1. In relation to marital status, most women are married/ with a partner in both surveys, and only this category did not present a statistically signiicant diference (p=0.725). According to VIGITEL, there is a higher percentage of single women in relation to ISA – Capital (p=0.006), and a lower percentage of separated/divorced women (p=0.036) and widowers (p=0.029).
In relation to skin color/ethnicity, 64.2% reported being White, according to the household survey; this percentage was lower in the telephone survey (p<0.001).
As to schooling, the only statistically signif-icant diference between surveys was in the category 0 to 8 years of schooling (p=0.019). he prevalence of Pap smear for women aged 20 years or more, according to ISA – Capital, was 90.3%; meanwhile, for VIGITEL this prevalence was about 4% higher (which is expressed by the prevalence ratio of 1.04, adjusted by age and schooling), reaching 93.5%. Likewise, according to VIGITEL, a higher percentage of women had this exami-nation in the year prior to the interview (p=0.016), regardless of diferences concerning age and schooling observed in the surveys (Table 2).
Chart 1. continuation
Quadro 1. continuação
The Pap smear is used in programs to prevent against uterine cervical neoplasm. Have you ever had this examination?
No Yes
Do not know/Did now answer
When was the last time?
Less than one year ago From 1 to 2 incomplete years From 2 to 3 incomplete years More than 3 years ago Do not know/Did not answer
Have you ever had a Pap smear? (only for females)
Yes No
Do not know
How long has it been since you had a Pap smear?
Less than one year From 1 to 2 years From 2 to 3 years From 3 to 5 years 5 years or more Do not remember
Pap smear (2 categories)
-Yes -No
Last Pap smear
(2 categories) -Less than one year -One year or more
Mammography is a breast x-ray used in programs to prevent against breast cancer. When was the last time you had this examination?
Never
Less than one year ago 1 or 2 incomplete years ago 2 or 3 incomplete years ago 3 years ago
Do not know/Did not answer
Have you ever had a mammo-graphy, breast x-ray?
(only for females) Yes
No
Do not know
How long has it been since you had a mammography?
Less than 1 year From 1 to 2 years From 2 to 3 years From 3 to 5 years 5 years or more Do not remember
Mammography (2 categories)
-Yes -No
Last mammography (2 categories)
By analyzing the coverage of mammog-raphy for women aged 40 years or more, the prevalence found by VIGITEL was about 7% higher (87.4% versus 82.0%). However, in relation to those who had this exami-nation in the year prior to the interview, no statistically signiicant diference
was found between estimates from both surveys (p=0.231).
Tables 3 and 4 demonstrate the preva-lence of these examinations according to sociodemographic characteristics of both analyzed surveys. VIGITEL found a higher prevalence of Pap smear (Table 3) for 20 to
*weighted percentage
*Porcentagem da amostra ponderada
Table 1. Frequency distribution of female adult population (aged 20 years and older), according to sociodemographic characteristics. ISA – Capital 2008 and VIGITEL – SP 2008
Tabela 1. Distribuição percentual da população adulta feminina (20 anos ou mais), segundo características sociodemográ-ficas. ISA – Capital 2008 e VIGITEL – SP 2008
Variables and categories ISA – Capital VIGITEL – SP
n (%)* (95%CI) n (%)* (95%CI)
Marital status
Single 229 24.5 (21.3–27.7) 331 31.4 (27.7–35.0)
Married/with a partner 597 54.1 (50.4–57.7) 593 53.1 (49.4–56.8)
Widower 279 10.9 (9.1–12.8) 161 8.3 (6.8–9.9)
Separated/divorced 133 10.5 (8.2–12.8) 120 7.2 (5.3–9.1)
Ethnicity
White 795 64.2 (58.9–69.5) 665 49.1 (45.4–52.8)
Non-white 441 35.8 (30.5–41.1) 540 50.9 (47.2–54.6)
Schooling
0 to 8 years 628 30.9 (26.4–35.4) 356 38.0 (34.2–41.8)
9 to 11 years 441 46.0 (42.4–49.6) 517 43.8 (40.0–47.5)
12 years or more 167 23.1 (17.6–28.5) 320 18.3 (16.0–20.5)
Table 2. Prevalence of preventive practices of female adult population. ISA – Capital 2008 and VIGITEL – SP, 2008
Tabela 2. Prevalência de práticas preventivas das mulheres adultas e tempo da realização. ISA – Capital 2008 e VIGITEL – SP 2008
1Women aged 20 years and older; 2women aged 40 years and older; *Adjusted by age and schooling; **Wald test (Baseline – ISA – Capital)
1Mulheres com 20 anos ou mais; 2mulheres com 40 anos ou mais; *ajustada por idade e escolaridade; **teste de Wald (categoria de referência – ISA – Capital)
Variables and Categories
ISA – Capital VIGITEL – SP Adjusted
Prevalence ratio *
p-value**
n Prevalence
(95%CI) n
Prevalence
(95%CI) (95%CI)
Pap smear1 1,237 - 1,205 - - -
-Ever had 1,121 90.3 (88.3–92.4) 1,131 93.5 (91.8–95.2) 1.04 (1.01–1.07) 0.016
Had in past year 540 54.1 (49.0–59.2) 707 62.1 (58.4–65.9) 1.14 (1.03–1.28) 0.016
Mammogram2 864 - 753 - - -
-Ever had 701 82.0 (78.8–85.3) 669 87.4 (84.4–90.4) 1.07 (1.02–1.13) 0.005
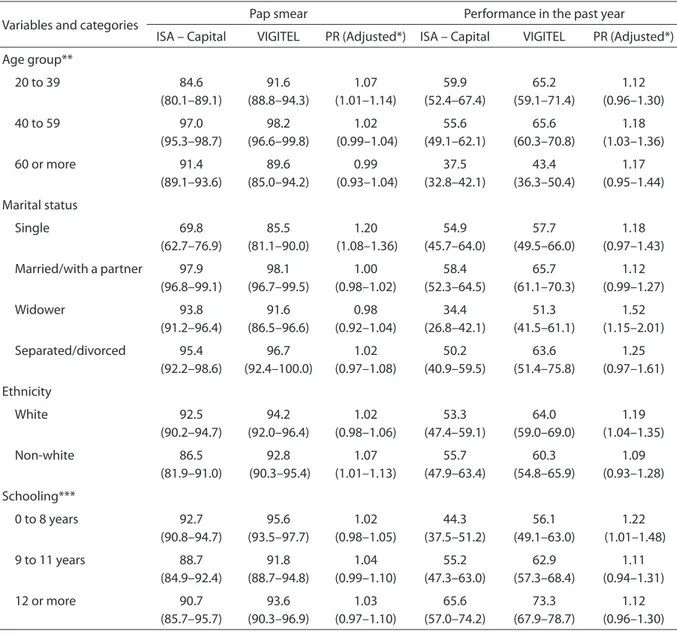
39 year-old (p=0.030), single (p=0.001), and non-white (p=0.022) women in relation to ISA – Capital. As to having the examination in the past year, VIGITEL estimates are higher for the 40 to 59 year-old (p=0.021), widower (p=0.003), white women (p=0.010) with fewer years of schooling (p=0.043).
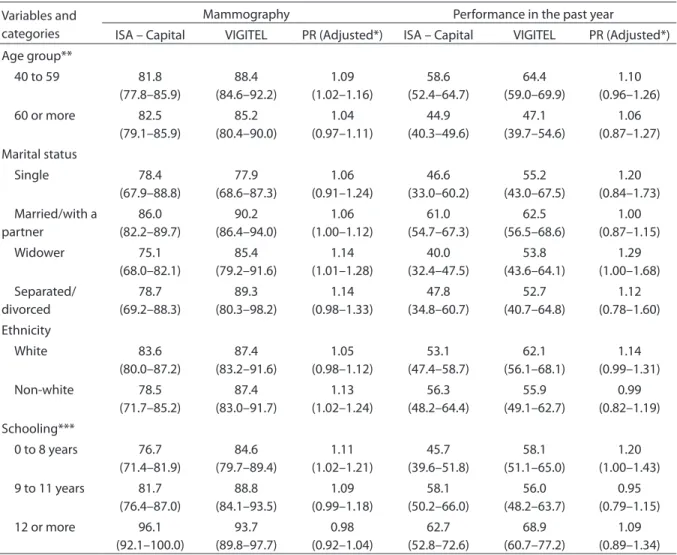
he prevalence estimates as to mammography are higher according to
VIGITEL than to ISA – Capital for the 40 to 59 year-old (p=0.008), widower (p=0.034), white women (p=0.016) with fewer years of schooling (p=0.019). In relation to having a mammography in the past year, VIGITEL estimates were 20% higher only for women with 0 to 8 years of schooling (p=0.045). However, there were no statistically signif-icant diferences for the other variables in
Variables and categories Pap smear Performance in the past year
ISA – Capital VIGITEL PR (Adjusted*) ISA – Capital VIGITEL PR (Adjusted*)
Age group**
20 to 39 84.6
(80.1–89.1) 91.6 (88.8–94.3) 1.07 (1.01–1.14) 59.9 (52.4–67.4) 65.2 (59.1–71.4) 1.12 (0.96–1.30)
40 to 59 97.0
(95.3–98.7) 98.2 (96.6–99.8) 1.02 (0.99–1.04) 55.6 (49.1–62.1) 65.6 (60.3–70.8) 1.18 (1.03–1.36)
60 or more 91.4
(89.1–93.6) 89.6 (85.0–94.2) 0.99 (0.93–1.04) 37.5 (32.8–42.1) 43.4 (36.3–50.4) 1.17 (0.95–1.44) Marital status Single 69.8 (62.7–76.9) 85.5 (81.1–90.0) 1.20 (1.08–1.36) 54.9 (45.7–64.0) 57.7 (49.5–66.0) 1.18 (0.97–1.43)
Married/with a partner 97.9 (96.8–99.1) 98.1 (96.7–99.5) 1.00 (0.98–1.02) 58.4 (52.3–64.5) 65.7 (61.1–70.3) 1.12 (0.99–1.27) Widower 93.8 (91.2–96.4) 91.6 (86.5–96.6) 0.98 (0.92–1.04) 34.4 (26.8–42.1) 51.3 (41.5–61.1) 1.52 (1.15–2.01) Separated/divorced 95.4 (92.2–98.6) 96.7 (92.4–100.0) 1.02 (0.97–1.08) 50.2 (40.9–59.5) 63.6 (51.4–75.8) 1.25 (0.97–1.61) Ethnicity White 92.5 (90.2–94.7) 94.2 (92.0–96.4) 1.02 (0.98–1.06) 53.3 (47.4–59.1) 64.0 (59.0–69.0) 1.19 (1.04–1.35) Non-white 86.5 (81.9–91.0) 92.8 (90.3–95.4) 1.07 (1.01–1.13) 55.7 (47.9–63.4) 60.3 (54.8–65.9) 1.09 (0.93–1.28) Schooling***
0 to 8 years 92.7
(90.8–94.7) 95.6 (93.5–97.7) 1.02 (0.98–1.05) 44.3 (37.5–51.2) 56.1 (49.1–63.0) 1.22 (1.01–1.48)
9 to 11 years 88.7
(84.9–92.4) 91.8 (88.7–94.8) 1.04 (0.99–1.10) 55.2 (47.3–63.0) 62.9 (57.3–68.4) 1.11 (0.94–1.31)
12 or more 90.7
(85.7–95.7) 93.6 (90.3–96.9) 1.03 (0.97–1.10) 65.6 (57.0–74.2) 73.3 (67.9–78.7) 1.12 (0.96–1.30)
Table 3. Prevalence of Pap smear and last visit, according to age, marital status, ethnicity and schooling. ISA – Capital 2008 and VIGITEL – SP 2008
Tabela 3. Prevalência da realização do exame de Papanicolaou e tempo da última consulta, segundo faixa etária, situação conjugal, raça e escolaridade. ISA – Capital, 2008 e VIGITEL-SP, 2008
PR – Prevalence ratio; *adjusted by age and schooling; **adjusted by schooling; ***adjusted by age
both surveys (Table 4). It is important to emphasize that data were adjusted by age and schooling.
Discussion
his study compared estimates related to the coverage of Pap smear and mammog-raphy obtained by the self-report of the interviewee in household and telephone surveys. No statistically signiicant difer-ences were found between estimates from VIGITEL and ISA – Capital for the preva-lence of mammography in the past year.
However, global estimates related to having had a Pap smear or a mammography at least once or in the past year enabled the verii-cation of statistically signiicant diferences, with higher prevalence rates of coverage among those interviewed by the telephone survey.
Population-based surveys are important to produce information about health10, and the conduction of more studies on strat-egies adopted to collect data, such as by telephone, household, online and mail surveys, among other possibilities12,are essential.
PR – Prevalence Ratio; *adjusted by age and schooling; **adjusted by schooling; ***adjusted by age
PR – Razão de Prevalência; *ajustada por idade e escolaridade; **ajustada apenas por escolaridade; ***ajustada apenas por idade Variables and
categories
Mammography Performance in the past year
ISA – Capital VIGITEL PR (Adjusted*) ISA – Capital VIGITEL PR (Adjusted*)
Age group**
40 to 59 81.8
(77.8–85.9) 88.4 (84.6–92.2) 1.09 (1.02–1.16) 58.6 (52.4–64.7) 64.4 (59.0–69.9) 1.10 (0.96–1.26)
60 or more 82.5
(79.1–85.9) 85.2 (80.4–90.0) 1.04 (0.97–1.11) 44.9 (40.3–49.6) 47.1 (39.7–54.6) 1.06 (0.87–1.27) Marital status Single 78.4 (67.9–88.8) 77.9 (68.6–87.3) 1.06 (0.91–1.24) 46.6 (33.0–60.2) 55.2 (43.0–67.5) 1.20 (0.84–1.73) Married/with a partner 86.0 (82.2–89.7) 90.2 (86.4–94.0) 1.06 (1.00–1.12) 61.0 (54.7–67.3) 62.5 (56.5–68.6) 1.00 (0.87–1.15) Widower 75.1 (68.0–82.1) 85.4 (79.2–91.6) 1.14 (1.01–1.28) 40.0 (32.4–47.5) 53.8 (43.6–64.1) 1.29 (1.00–1.68) Separated/ divorced 78.7 (69.2–88.3) 89.3 (80.3–98.2) 1.14 (0.98–1.33) 47.8 (34.8–60.7) 52.7 (40.7–64.8) 1.12 (0.78–1.60) Ethnicity White 83.6 (80.0–87.2) 87.4 (83.2–91.6) 1.05 (0.98–1.12) 53.1 (47.4–58.7) 62.1 (56.1–68.1) 1.14 (0.99–1.31) Non-white 78.5 (71.7–85.2) 87.4 (83.0–91.7) 1.13 (1.02–1.24) 56.3 (48.2–64.4) 55.9 (49.1–62.7) 0.99 (0.82–1.19) Schooling***
0 to 8 years 76.7
(71.4–81.9) 84.6 (79.7–89.4) 1.11 (1.02–1.21) 45.7 (39.6–51.8) 58.1 (51.1–65.0) 1.20 (1.00–1.43)
9 to 11 years 81.7
(76.4–87.0) 88.8 (84.1–93.5) 1.09 (0.99–1.18) 58.1 (50.2–66.0) 56.0 (48.2–63.7) 0.95 (0.79–1.15)
12 or more 96.1
(92.1–100.0) 93.7 (89.8–97.7) 0.98 (0.92–1.04) 62.7 (52.8–72.6) 68.9 (60.7–77.2) 1.09 (0.89–1.34)
Table 4. Prevalence of mammography and last visit, according to age, marital status, ethnicity and schooling. ISA – Capital 2008 and VIGITEL – SP 2008
The international experience in the comparison of different methodologies is more documented12,13,25 than in Brazil5. A study conducted in Madrid comparing telephone and face to face (household) surveys found similarity in 25 out of the 29 analyzed variables13. A study carried out in the United States comparing estimates obtained by telephone (Behavioral Risk Factor Surveillance System) and household (National Health Interview Survey) surveys showed similar data as to smoking, body weight, diabetes, arterial hypertension, immunization, health insurance coverage and cost as being limiting factors to health care12.
Davis et al.25 compared the prevalence of mammography considering telephone (BRFSS) and household (NHIS) North-American telephone surveys in the periods of 1997-1999 and 2000-2003 and, as in the present study, they observed that estimates originated by telephone were statistically higher than those originated by household surveys. The authors also pointed to the importance and suggested a model that could combine information and generate estimates coming from both types of surveys.
By comparing mammography estimates obtained by VIGITEL 2007 and those coming from the National Household Survey (PNAD – 2003) Viacava, Souza-Junior and Moreira5 observed that VIGITEL estimates were higher in all the analyzed capitals, with up to 9 percentage points of diferences. Such diferences were attributed to the fact that the population analyzed by the telephone survey has access to telephone lines and belongs to higher socioeconomic levels. By analyzing the post-stratiication efect on the correction of data obtained by a subpopu-lation that had a residential telephone line in 2003 for the total population, Segri et al.23 observed that, in relation to mammog-raphy, the adjustment by gender, age and schooling was insuicient to properly adjust estimate bias.
he access to the Pap smear in the life of women aged 20 years or more in this study, despite the statistically signiicant diference between surveys, was higher than 90%, and as to having had the exam in the year prior to the interview, higher than 50%. Data from 2003 in the city of São Paulo showed similar values for the access throughout life (87.1%) and in the previous year (57.5%) for women in the same age groups23,26.
Another household study conducted in São Paulo in 2000 showed lower prevalence rates (86.1%) of being examined at least once for women aged between 15 and 49 years; however, the coverage in the previous year was higher (65.5%) for the same age group27. A household survey conducted in the city of Campinas in 2003 showed that the access to Pap smear was 83.3% for women aged 40 years or more9, and data from PNAD 2008 showed that in Brazil, the access to women aged 25 to 59 years reached 84.5%, increasing to 90.0% in the Southeast region28.
In relation to the prevalence of mammography, the results in this study (regarding household and telephone surveys) were higher than 80%, despite showing statistical diferences. Results from a household survey conducted in the city of São Paulo in 2003 showed that the access to mammography for women aged 40 years or more was lower than 75%; however, it was higher for women who owned a residential telephone line23.
A study conducted in Campinas with women aged 40 years or more showed lower prevalence rates as to the non-realization of mammography between those aged 70 years or more, who self-reported as being white or brown and who belonged to the lower per capita income stratum7. Likewise, data from PNAD 2008 showed that the access for women aged 50 to 69 years is higher than 70% in Brazil, reaching 81.9% in the Southeast region; however, fewer years of schooling and income are associated with the decreased access28. In relation to the Pap smear9, it was observed that factors that are independently associated with the non-realization of the exam were: being 40 to 59 years old, self-reporting color/ethnicity as brown or black, and having years of schooling equal or inferior to 4 years.
Results from a North-American study performed in 2006 by telephone (BRFSS) showed that the prevalence of mammog-raphy among women aged 40 years or more (60.8%), as well as Pap smear (83.3%) was lower to that described in this study, however, they also ranged according to ethnicity and socioeconomic level31.
he diferences found in this study in relation to the mean age of women and schooling may result from the diferent structure of post-stratiication adjustments used for the analyzed surveys. he fact that ISA – Capital uses data from 2008, while VIGITEL uses data from 2000 – when the population was younger and with fewer years of schooling – emphasizes the difer-ences between these variables. In relation to the diferences found as to marital status and especially color/ethnicity, the same observation may be considered. However, it is important to care for the diferences among questions regarding these charac-teristics and some response categories of VIGITEL and ISA – Capital. As an example, there is the category “dark skin” in the former, but not in the latter.
Among the limitations in this study, the existence of diferences in data collection
instruments must be considered, as well as the response rates found in both survey types, which may interfere in the results11,12,14. As to the questionnaire, it is important to note that the question on the performance of examinations was not created the same way. For example, ISA – Capital included information about the objective of the examinations in the title of the question. Besides, the size of the questionnaire and the order in which the questions were included are also diferent. Although it is not known if such aspects inluence the estimated prevalence, it is not possible to rule out the hypothesis that they are partly responsible for the observed diferences.
It is important to emphasize the impor-tance of using statistical analysis techniques, especially Poisson regression models18, in data from both surveys gathered in one databank. his combination enabled the use of computational analysis modules which consider the diferent aspects of the complex sample plans, which difer in both surveys.
It is important to mention that the comparison between prevalence estimates was conducted by the prevalence ratio adjusted by age and schooling, once the surveys refer to populations with diferent percentage distributions as to these variables, because post-stratiication adjust-ments at VIGITEL were made based on Census 2000, and ISA – Capital was based on PNAD 2008.
References
1. Robles SC, Galanis E. Breast cancer in Latin America and the Caribbean. Rev Panam Salud Publica. 2002;11:178-85.
2. Instituto Nacional de Câncer. Inquérito domiciliar sobre comportamento de risco e morbidade referida de doenças e agravos não transmissíveis. Brasil, 15 capitais e Distrito Federal, 2002-2003. Rio de Janeiro: Instituto Nacional do Câncer, 2004.
3. Gardner E. Cervical câncer: disparities in screening, treatment, and survival. Cancer Epidemiol Biomarkers Prev. 2003;12:242s-7s.
4. Fonseca LAM, Ramacciotti AS, Eluf Neto J. Tendência da mortalidade por câncer de útero no município de São Paulo entre 1980 e 1999. Cad Saúde Pública. 2004;20(1):136-42.
5. Viacava F, Souza-Junior PRB, Moreira RS. Estimativas da cobertura de mamograia segundo inquéritos de saúde no Brasil. Rev Saúde Pública. 2009;43 Suppl 2:117-125.
6. Lima-Costa MF, Matos DL. Prevalência e fatores associados à realização da mamografia na faixa etária de 50-69 anos: um estudo baseado na Pesquisa Nacional por Amostra de Domicílios (2003). Cad Saúde Pública. 2007;23(7):1665-73.
7. Amorim VMSL, Barros MBA, Cesar CLG, Carandina L, Goldbaum M. Fatores associados a não realização da mamograia e do exame clínico das mamas: um estudo de base populacional em Campinas, São Paulo, Brasil. Cad Saúde Pública. 2008;24(11):2623-32.
8. Dias-da-Costa JS, Olinto MTA, Gigante DP, Menezes AMB, Macedo S, Borba AT, et al. Cobertura do exame citopatológico na cidade de Pelotas, Rio Grande do Sul, Brasil. Cad Saúde Pública. 2003;19(1):191-7.
9. Amorim VMSL, Barros MBA, César CLG, Carandina L, Goldbaum M. Fatores associados à não realização do exame de Papanicolaou: um estudo de base populacional no Município de Campinas, São Paulo, Brasil. Cad Saúde Pública. 2006;22(11):2329-38.
10. Barros MBA. Inquéritos domiciliares de saúde: potencialidades e desaios. Rev Bras Epidemiol. 2008;11 Suppl 1: 6-19.
11. Waldman EA, Novaes MHD, Albuquerque MFM, Latorre, MRDO; Ribeiro, MCSA; Vasconcellos M, et al. Inquéritos populacionais: aspectos metodológicos, operacionais e éticos. Rev Bras Epidemiol. 2008;11Suppl 1:168-79.
12. Nelson DE, Powell-Griner E, Town M, Kovar MG. A comparison of national estimates from the National Health Interview Survey and the Behavioral Risk Factor Surveillance System. Am J Public Health. 2003;93(8):1335-41.
13. Galán I, Rodríguez-Artalejo F, Tobías A, Gandarillas A, Zorrilla B. Vigilancia de los factores de riesgo de las enfermedades no transmisibles mediante encuesta
telefónica: resultados de la Comunidad de Madrid en el período 1995-2003. Gac Sanit. 2005,19(3):193-205.
14. Fahimi M, Link M, Mokdad A, Schwartz DA, Levy P, Mokdad A. Tracking chronic disease and risk behavior prevalence as survey participation declines: statistics from the behavioral risk factor surveillance system and other national surveys. Prev Chronic Dis. 2008;5(3):A80.
15. Mokdad AH. he Behavioral Risk Factors Surveillance System: past, present, and future. Annu. Rev. Public Health. 2009;30:43-54.
16. Monteiro CA, Moura EC, Jaime PC, Lucca A, Florindo AA, Figueiredo ICR, et al. Monitoramento de fatores de risco para doenças crônicas por entrevistas telefônicas. Rev Saúde Pública. 2005;39(1):47-57.
17. Brasil. Ministério da Saúde. Secretaria de Vigilância em Saúde. Secretaria de Gestão Estratégia e Participativa. VIGITEL Brasil, 2008: vigilância de fatores de risco e proteção para doenças crônicas por inquérito telefônico. Brasília: Ministério da Saúde, 2009.
18. Lee S, Davis WW, Nguyen HA, McNeel TS, Brick JM, Flores-Cervantes I. Examining trends and averages using combined
cross-sectional survey data from multiple years. CHIS
Methodology Paper, 2007. [cited 2010 Set 19]. Available from:
http://www.chis.ucla.edu/pdf/paper_trends_averages.pdf.
19. Lavrakas PJ. Telephone survey methods. Sampling, selection and supervision. London: Sage Publications, 1990.
20. Cesar CLG, Carandina L, Alves MCGP, Barros MBA, Goldbaum M. Saúde e condição de vida em São Paulo: inquérito multicêntrico de saúde no Estado de São Paulo (ISA – SP). São Paulo: USP/FSP; 2005.
21. Kish L. Survey sampling. New York: John Wiley and Sons; 1965.
22. Cesar CLG, Segri NJ, Sportello RA. Inquéritos de saúde no estado de São Paulo [internet]. São Paulo: Faculdade de Saúde Pública da USP; 2005. Disponível em: http://www. fsp.usp.br/isa-sp.
23. Segri NJ, Cesar CLG, Barros MBA, Alves MCGP, Carandina L, Goldbaum M. Inquérito de saúde: comparação dos entrevistados segundo posse de linha telefônica residencial. Rev. Saúde Pública. 2010;44(3):503-12.
24. Alves MCGP, Silva NN. Métodos de estimação de variância em amostras provenientes de inquéritos domiciliares. Rev. Saúde Pública. 2007;41(6):938-46.
25. Davis WW, Parsons VL, Xie D, Schenker N, Town M, Raghunatan TE, et al. State-based estimates of mammography screening rates based on information from two health surveys. Public Health Rep. 2010;125(4):567–578.
27. Pinho AA, França Junior I, Schraiber LB, D´Oliveira AFPL. Cobertura e motivos para a realização ou não do teste de Papanicolaou no Município de São Paulo. Cad. Saúde Pública. 2003;19 Suppl 2:S303-13.
28. Instituto Brasileiro de Geograia e Estatística - Pesquisa Nacional por Amostra de Domicilio. Um panorama da saúde no Brasil: acesso e utilização de serviços, condições de saúde e fatores de risco e proteção à saúde. Rio de Janeiro, 2010. [cited 2011 Jun 15]. Available from: http://www.ibge. gov.br/home/estatistica/populacao/panorama_saude_ brasil_2003_2008/PNAD_2008_saude.pdf.
29. Ford ES. Characteristics of survey participants with and without a telephone: indings from the third National Health
and Nutrition Examination Survey. J Clinic Epidemiol. 1998;51(1):55-60.
30. Bernal R, Silva NN. Cobertura de linhas telefônicas residenciais e vícios potenciais em estudos epidemiológicos. Rev. Saúde Pública [online]. 2009, 43(3): 421-26.
31. Smith RA, Cokkinides V, Brawley OW. Cancer Screening in the United States, 2008: a review of current American Cancer Society guidelines and cancer screening issues. CA Cancer J Clin. 2008;58(3):161–179.
Submitted on: 05/01/2011 Final version presented on: 23/02/2011