Rev Saúde Pública 2005;39(1) www.fsp.usp.br/rsp
Surveillance of risk factors for chronic
diseases through telephone interviews
Carlos Augusto M onteiroa, Erly Catarina de M ourab, Patrícia Constante Jaimea, Alessandra Luccaa,*, Alex Antonio Florindob, Iramaia Campos Ribeiro Figueiredoa,**, Regina Bernalc and N ilza N unes da Silvac
aDepartamento de Nutrição. Faculdade de Saúde Pública. Universidade de São Paulo (FSP/USP). São Paulo, SP, Brasil. bNúcleo de Pesquisas Epidemiológicas em Nutrição e Saúde. Universidade de São Paulo (NUPENS/USP). São Paulo, SP, Brasil. cDepartamento de Epidemiologia. FSP/USP. São Paulo, SP, Brasil
Correspondence to: Carlos Augusto Monteiro
Departamento de Nutrição - NUPENS/USP Av. Dr. Arnaldo, 715
01246-904 São Paulo, SP, Brasil E-mail: [email protected] Keywords
Health surveys. Health status monitoring. Chronic disease, epidemiology. Interviews, metods. Telephone. Risk factors.
Socioeconomic factors. Chronic non-communicable disease.
*Doctoral student, Curso de Pós-Graduação em Saúde Pública da Faculdade de Saúde Pública da Universidade de São Paulo (FSP/USP).
**MSc student, Curso de Pós-Graduação em Saúde Pública da FSP/USP.
Study conducted at the Núcleo de Pesquisas Epidemiológicas em Nutrição e Saúde da Universidade de São Paulo (NUPENS/USP).
Study financed by the Brazilian Ministry of Health (Convênio MS/FUSP 1390/2002) Received on 28/4/2004. Approved on 13/9/2004.
Abstract
Objective
To describe methods and initial findings of a surveillance system of risk factors for chronic non-communicable diseases (CNCDs) based on telephone interviews. Methods
Interviews undertaken in a random sample of the adult population of the Municipality of São Paulo living in households with telephone. Sampling was done in two steps and included the random selection of households and the random selection of the household member to be interviewed. The system’s questionnaire investigated demographic and socioeconomic characteristics, food consumption and physical activity patterns, smoking, consumption of alcoholic beverages, recalled weight and height and reported medical diagnoses of hypertension and diabetes, among other topics. Prevalence estimates of selected risk factors for CNCDs were calculated for the adult population with telephone and for the city’s entire adult population. In this last case, we applied sample weighting factors that took into account demographic and socioeconomic differences between the adult population with telephone and the entire adult population of the municipality.
Results
Strong differences between sexes were found for most risk factors: low consumption of fruit and vegetables, high consumption of alcohol and overweight were more frequent among men while sedentary lifestyle and hypertension were more frequent among women. Additional possibilities of stratification of risk factor prevalences allowed by the surveillance system are illustrated using age groups, schooling, and place of residence in the city.
Conclusions
System performance was considered as good and was better than the performance observed in similar systems operating in developed countries when evaluated with basis on the representativeness and reliability of the estimates and on costs. The cost per concluded interview was eight times lower than the cost usually seen in similar systems in developed countries and four to eight times lower than the cost of traditional household surveys undertaken in the city of Sao Paulo.
INTRODUCTION
Chronic non-communicable diseases (CNCDs) are extremely relevant to the current health profile of human populations. This is true for both the global
Rev Saúde Pública 2005;39(1) www.fsp.usp.br/rsp Surveilance of risk factors for chronic diseases
Monteiro CA et al
One of the explanations proposed for the dissatis-factory monitoring of risk factors for CNCDs in the Brazilian population is that household surveys, the major instrument employed in the country for gener-ating monitoring information, are operationally com-plex, costly, and generally involve long stretches of time between study planning and the publication of results. Such conditions render household surveys inadequate as the single or main source of informa-tion for monitoring systems, particularly for state or municipal ones.
The system presented in the present paper is a po-tentially simple, inexpensive, and agile system for monitoring risk factors for CNCDs. This system is based essentially on annual surveys carried out by means of telephone interviews with probabilistic sam-ples of the population living in homes with fixed telephone lines. Similar systems are being used suc-cessfully* in populations in which telephone serv-ices reach the great majority of residences,17 a
sce-nario projected for most Brazilian cities in the rela-tively near future.**
Below we describe the methods and initial results of the pioneer experience in Brazil of implementing a CNCD risk factor monitoring system based on tel-ephone interviews. Subsequent papers will report on additional results and focus on aspects related to sys-tem reliability and validation.
M ETH O D S
In 2003, in the Municipality of Sao Paulo, we im-plemented a system for monitoring risk factors for CNCDs through telephone interviews (SIMTEL/ MSP). The sampling procedures employed by the SIMTEL/MSP were aimed at obtaining a probabilis-tic sample of the population aged 18 years or older, living in households in the city of Sao Paulo with at least one telephone line in 2003. We established the minimum number of subjects to be studied by the system at 2,000, which would allow us to estimate the frequency of any risk factor in the studied popula-tion with a 95% confidence coefficient and a maxi-mum error of about two percentage points. Maximaxi-mum errors of about three percentage points would be ex-pected for gender-specific estimates, assuming 45% of men and 55% of women in the final sample.20
The first stage of sampling was carried out in Octo-ber 2003 and consisted of drawing 7,000 telephone lines from the electronic registry of residential fixed In Brazil, it is estimated that cardiovascular diseases
and neoplasias alone account for almost one-half of all deaths by known causes.6 Mortality time series,
available for the Brazilian capitals, indicate that the proportion of deaths due to CNCDs more than tripled between the 1930’s and 1990’s.1
Cross-sectional and prospective epidemiological studies have provided exhaustive proof of the asso-ciation between several of the major CNCDs (cardio-vascular diseases, respiratory diseases, diabetes, and certain types of cancer) and a relatively small group of risk factors, noteworthy among which are smok-ing, excessive alcohol consumption, overweight, ar-terial hypertension, hypercholesterolemia, low fruit and vegetable consumption, and physical inactiv-ity.23 According to recent WHO estimates, these seven
risk factors are part of the list of fourteen factors most relevant to the total global disease burden. In coun-tries like Brazil, these same risk factors are part of the list of nine factors that most cause death and disease among the population.22
Although potentially relevant to the definition of the epidemiological profile of the Brazilian population, and, more importantly, potentially preventable, risk factors for CNCDs are not being adequately monitored. House-hold surveys on the occurrence of health and nutrition conditions in the Brazilian population have shown a sharp increase in obesity , especially in poorer socioeco-nomic strata.11,13,15 Notwithstanding, in light of the wide
intervals separating these surveys (10-15 years) and of the impossibility of sorting data by state and municipal-ity, one cannot consider the issue of obesity in this coun-try as being adequately monitored. Knowledge of the time trends of food consumption and of physical activ-ity patterns is even more scarce. Regarding the former, periodical information are restricted to the trends in met-ropolitan areas, estimated based on surveys of family budgets, which refer to the purchase of food by families rather than to the actual consumption pattern of indi-viduals.9,14 As to the latter, a single recorded household
survey estimated the frequency of physical activities during leisure time in the Northeast and Southeast Re-gions of Brazil in 1996/97.16 Anyhow, data in both cases
point towards patterns of food consumption and physi-cal activity that greatly favor the occurrence of CNCDs. The most recent estimates on the consumption of ciga-rettes and alcohol in the country date from 15 years ago and also cannot be sorted by state and municipality,7
whereas estimates of the prevalence of arterial hyperten-sion and hypercholesterolemia are mostly punctual, and refer to very specific populations.2
*Centers for Disease Control and Prevention [CDC]. BRFSS: system state information [on-line] 2004. Available from: <URL: http:// www.cdc.gov/brfss/dataused.htm> [2004 Apr 5]
!
Rev Saúde Pública 2005;39(1) www.fsp.usp.br/rsp
Surveilance of risk factors for chronic diseases Monteiro CA et al
telephone lines in the municipality of Sao Paulo. This registry* comprised 2,915,860 lines. A telephone company staff member, who was supervised by one of the authors, carried out the draw. The draw, strati-fied and systematic, took into account the five strata into which the registry was divided, corresponding to the Central, North, South, East, and West Regions of the city. The same sampling fraction was main-tained in all regions (1/416). The 7,000 lines drawn were then redrawn and divided into twenty replicates of 350 lines ordered from 1 to 20, each replicate re-producing the proportion of lines according to city region. We divided the total sample into replicates due to difficulties in estimating the proportion of lines in the registry eligible for the system (active residential lines) and, therefore, the total number of lines that should be drawn in order to reach 2,000 interviews.
The second stage of the sampling process was the selection of individuals – one per telephone line – to be interviewed by the system. This stage, carried out in parallel with the interviews – between 15 October and 31 December 2003 –, involved prior identifica-tion, among the lines drawn, of lines that were both residential and active (eligible lines) and the obtain-ment of the consent of users of these lines to partici-pate in the system. To this end, we placed calls to the telephone lines included in the replicates drawn from one to nine, that is, to 3,150 lines (9x359). We con-sidered as ineligible for participation in the system lines that were out of service (n=235), commercial lines (n=138) or unexisting phone number (n=109) , and lines for which we could not obtain an answer after ten calls placed on different days and at differ-ent times, including weekends and evenings, and that probably corresponded to closed residences (n=163), which resulted in a total 2,505 eligible telephone lines, or roughly 80% of the total initially drawn. Refusals to participate in the system were observed in 157 of the 2,505 eligible lines (6.3%). Another 37 lines remained busy (n=4) or were answered by fax (n=15) or answer machines (n=18) after ten calls placed on different days and times, including week-ends and evenings. We were thus able to draw indi-vidual subjects in 2,311 (92.3%) of the 2,505 eligi-ble lines. This draw was done based on the a list of all individuals living in the residence aged at least 18 years, ordered ascendantly by age, and by reference to random number sequences corresponding to the number of adults living in the household. Thus, for example, in households with four adults, we referred to a random sequence of numbers 1, 2, 3, and 4 (e.g., 3,1,2,4,2,3,1,4,4,1,2,3 …), selecting for the interview
the number immediately following the one selected for the previous interview.
The SIMTEL/MSP questionnaire comprised 89 short, simple questions, the great majority of which included preestablished answer categories. Many ques-tions in the questionnaires were linked and, depend-ing on the answers obtained, many questions were skipped, thus reducing the actual number of questions by up to 40%. The questionnaire was constructed so as to allow for the telephone interviews to be carried out with the aid of a computer, that is, questions were read directly from a computer screen and answers were en-tered digitally (using the keyboard or mouse), directly and immediately. The questionnaire, built in ‘fox-pro’ language, allows for the automatic skipping of non-applicable questions based on prior answers, and pro-vides direct and continuous feeding to a ‘d-base’ for-mat data bank. After obtaining the subject’s agreement, interviews were recorded and saved to electronic me-dia for subsequent quality control.
The questionnaire addressed especially: a) indi-vidual demographic and socioeconomic characteris-tics (age, gender, marital status, ethnicity, schooling, occupation, neighbourhood of residence, number of persons and rooms in the household, number of adults, and number of telephone lines); b) certain characteris-tics of consumption and physical activity patterns as-sociated to the occurrence of CNCDs (including fre-quency of consumption of fruit and vegetables and of foods rich in saturated fats, frequency and duration of physical exercise, and habit of watching television); c) characteristics related to body composition (recalled weight and height); d) frequency of consumption of cigarettes and alcoholic beverages; and e) self-rated health status and reference to prior medical diagnosis of arterial hypertension, high cholesterol levels, and diabetes. The construction of the questionnaire took into account models of simplified questionnaires used by systems for the monitoring of CNCD risk factors17,21
and the experience accumulated in a number of sur-veys of health and nutrition carried out in Brazil. Pre-liminary versions of the questionnaire used in the sys-tem were tested during the two weeks preceding the beginning of interviews.
System operation and performance
The SIMTEL/MSP was operated by a technical team including one interview scheduler, two interviewers, one coordinator, and two coordination assistants. Overall, the system operated for a period of three months (1 October to 31 December 2003), including
" Rev Saúde Pública 2005;39(1) www.fsp.usp.br/rsp Surveilance of risk factors for chronic diseases
Monteiro CA et al
two weeks dedicated to training and pre-testing the instruments used for data collection.
The interview scheduler placed initial telephone calls to all the drawn lines, repeated these calls in case of failure (at least ten times), confirmed whether the line at hand was an active residential line, ex-plained to this person (if aged 16 years or older) the characteristics and goals of the monitoring system, requested the person’s consent to participate in the study, listed the adults (= 18 years) living in the house-hold in ascending order of age, selected the subject to be interviewed from this list according to the ran-dom number sequences, and recorded the best days and times for carrying out the telephone interview. In the three months during which the system operated, the scheduler placed a total 8,234 calls to the 3,150 selected lines, a mean 2.61 calls per line. As we saw above, these calls resulted in 2,505 eligible lines and in the selection of 2,311 subjects to be interviewed.
The two interviewers placed telephone calls to the selected subjects, repeated the explanations regard-ing the system, obtained subject’s consent to be in-terviewed, and administered the questionnaire, record-ing all the answers obtained directly into the compu-ter. The subjects selected for the interview were called at the date and time suggested by the household mem-ber who answered the initial call and, in case of fail-ure, were called at least ten times at different times and days, including weekends. In the three months of system operation, the two interviewers placed a total 5,967 calls to the 2,311 subjects selected, which cor-responded to a mean 2.58 calls placed per selected line. These calls resulted in 2,122 interviews, or 91.8% of all interviews programmed. Refusals accounted for the failure to carry out 5.8% of the programmed inter-views, and in the remaining cases (2.3%), interviews were not carried out due to lines that went out of service or which were not answered even after ten calls. Considering the total of 2,505 active residen-tial lines drawn from the telephone company registry, the final success rate (identification and selection of interview subjects and questionnaire administration) in the present study was 84.7%. The proportion of lines whose users refused to participate in the study was 11.7%, and the proportion of lines that could not be contacted was 3.6%. The median duration of the interviews administered was 9.3 (mean =9.9 minutes; standard deviation =3.4 minutes).
Finally, the study coordinator, aided by two assist-ants, recruited and trained the remaining team mem-bers, prepared and distributed work charts to the scheduler and interviewers, reviewed recorded tel-ephone interviews (the initial interview of all
inter-viewers plus a random sample of 20% of subsequent interviews), indicated problems and failures in the voicing of questions or in the recording of answers, indicated the need for further telephone contact with the subject for the correction of answers, periodically evaluated the consistency of the database built based on the interviews, and produced simple tabulations of the frequency and distribution of selected risk factors.
Data analysis
The selected SIMTEL/MSP indicators presented below include behavioral variables (food consump-tion, physical activity, smoking, and alcoholic bev-erage consumption), weight and height, and reported prior medical diagnosis of arterial hypertension and diabetes. The selection of indicators took into ac-count the importance of these indicators to the deter-mination of the total burden of disease in Brazil, as estimated by WHO.22
#
Rev Saúde Pública 2005;39(1) www.fsp.usp.br/rsp
Surveilance of risk factors for chronic diseases Monteiro CA et al
The prevalences of the selected indicators, adjusted to represent the total adult population of the Munici-pality of Sao Paulo, were calculated separately, with 95% confidence intervals, for men and women. In ad-dition, as an illustration of the possibilities of stratifi-cation of the estimates provided by the system, we present prevalence estimates according to the age group and schooling level of subjects. Statistical analy-ses of the association between risk factors and stratifi-cation variables were performed using a statistical test based on the chi-squared distribution. Data process-ing and statistical analyses were carried out usprocess-ing Epi Info version 6.1 software, employing the ‘csample’ func-tions, that compute proportions with confidence in-tervals taking into account the complex nature of sam-pling (use of strata and weighting factors).6
Ethical aspects
Since interviews were conducted by telephone, free informed consent forms were replaced by verbal sent obtained from subjects during the telephone con-tacts. During these contacts, we made clear that the data obtained would be used only for research pur-poses and for the implementation of a municipal sys-tem for the monitoring of risk factors for chronic non-transmissible diseases. We also informed subjects of the possibility of refraining form participation in the study at any moment during the interview, of the in-existence of risk or of additional health hazards, and of the guarantee that all information provided were confidential. We provided a telephone number for the resolution of any doubts concerning the project. This research project was approved by the Ethics Committee of the School of Public Health of the Uni-versity of Sao Paulo .
RESU LTS
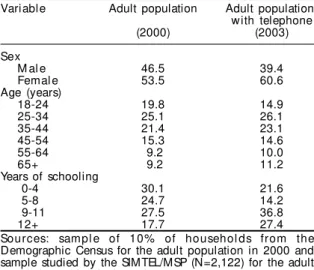
Table 1 compares sociodemographic characteris-tics of the sample of the population of adults with telephone line studied by the SIMTEL/MSP in 2003, with those of the total adult population of the mu-nicipality, studied by the 2000 demographic census. The population studied by the monitoring system has a greater proportion of women (60.6% versus 53.5% in the census), a lesser proportion of youths between ages 18 and 24 years (14.9% versus 19.8% in the census), and greater proportion of subjects with nine or more years of schooling (64.2% versus 45.2% in the census). Mean age and schooling in the stud-ied population were 41.2 and 9.4 years, respectively, whereas the corresponding values for the total adult population in the municipality were 39.6 and 8.1 years.
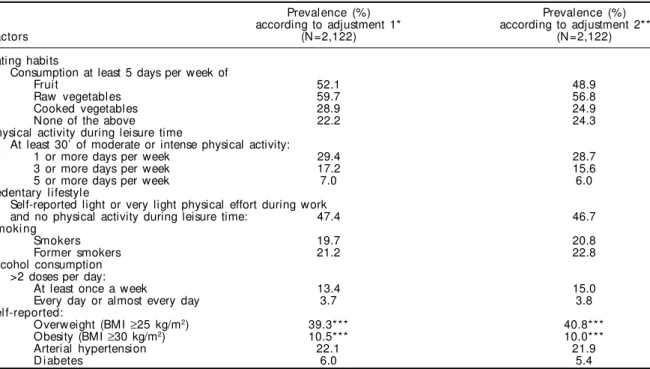
Table 2 presents SIMTEL/MSP estimates for the
prevalence of selected risk factors. The table presents estimates referent to the population of adults with telephone lines and to the entire adult population of the municipality. It should be noted that differences between the two estimates are relatively small and non-systematic: in most cases, absolute differences do not exceed two percentage points, above or below, and relative differences are always below 10%.
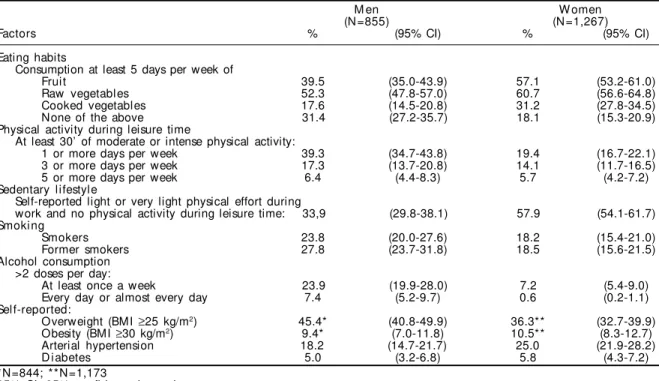
Table 3 presents SIMTEL/MSP estimates for the male and female adult populations of the Munici-pality of Sao Paulo. Substantial differences between the genders are observed with respect to the fre-quency of most risk factors studied. Significantly more frequent among men are the insufficient con-sumption of fruit and vegetables, excessive alcohol consumption, and overweight, whereas among women sedentary lifestyle and hypertension are sig-nificantly more frequent.
Figures 1 and 2 illustrate further stratification op-tions made possible by the monitoring system, in-volving the age group and schooling of the inter-viewed subjects. Figure 1 makes evident two relevant risk factors for the male population of the Municipal-ity of Sao Paulo: 1) after age 50 years the frequency of former smokers is substantially higher than that of current smokers; and 2) beginning to smoke seems to have declined substantially in the last decades – roughly 70% of subjects aged 45 years or older (born, therefore, before 1959) are smokers or former smok-ers, whereas only 32.8% of subjects in the 18-24 years age group (born after 1979) are in the same situation. Figure 2 indicates that sedentary lifestyle and obes-ity tend to be more frequent among women with less schooling.
Table 1 - Esti mated di stri buti on (%) of the enti re adul t popul ati on and of the adul t popul ati on w i th tel ephone according do sociodemographic variables. M unicipality of Sao Paulo, 2000/2003.
Variable Adult population Adult population with telephone
(2000) (2003)
Sex
M al e 46.5 39.4
Femal e 53.5 60.6
Age (years)
18-24 19.8 14.9
25-34 25.1 26.1
35-44 21.4 23.1
45-54 15.3 14.6
55-64 9.2 10.0
65+ 9.2 11.2
Years of schooling
0-4 30.1 21.6
5-8 24.7 14.2
9-11 27.5 36.8
12+ 17.7 27.4
$ Rev Saúde Pública 2005;39(1) www.fsp.usp.br/rsp Surveilance of risk factors for chronic diseases
Monteiro CA et al
D ISCU SSIO N
The discussion of the present article shall focus mainly on two aspects that are crucial to monitoring systems based on telephone in-terviewing: the representativity of the esti-mates and the cost of the system. We used as a general reference for this evaluation, when-ever possible, the system of monitoring by telephone interview used in the United States, the ‘Behavioral Risk Factor Surveillance Sys-tem’ (BRFSS). The BRFSS, created by the US Centers for Disease Control and Prevention in 1981, is the oldest and largest telephone
monitoring system in the world. It was implemented initially in 29 US states and, since 1994, works regu-larly in all 50 states, in the District of Columbia, and in the three US federal territories. Comparable to the sys-tem tested in Sao Paulo, the BRFSS interviews proba-bilistic samples of subjects 18 years or older with tel-ephone lines in their household employing question-naires that address risk or protective factors for CNCDs, including food consumption and physical activity pat-terns, smoking and alcohol consumption, recalled weight and height, and reported previous medical di-agnosis of arterial hypertension, hypercholesterolemia, and diabetes, among other variables.3
An analysis of the representativeness of the sam-ple of subjects studied by a monitoring system based
on telephone interviews must take into considera-tion how well this sample represents the group of individuals that have a telephone and how well this same sample represents the entire population one wishes to monitor. In the first case, three aspects must be considered: the quality of the telephone registry used for drawing residential lines, the ad-equacy of the sampling system employed in the se-lection of telephone lines and users to be inter-viewed, and, finally, the proportion of interviews completed in relation to the total interviews pro-grammed or predicted. In the second case, it is also important to evaluate the degree of coverage of tel-ephone services in the population to be monitored and, in case of non-universal coverage, the differ-ences between individuals living in households with
Figure 1 - Frequency (%) of smokers and former smokers according to age in the adult male population of the Municipality of Sao Paulo. SIMTEL/ MSP, 2003.
Smokers (1) 1+2
For mer smokers (2)
0 20 40 60 80
18-24 25-34 35-44 45-54 55-64 65+
Age in years
%
Table 2 - Estimated prevalence of risk and protection factors for CNCDs in the adult population of the Municipality of Sao Paulo according to two different adjustment procedures. SIMTEL/MSP, 2003.
Prevalence (%) Prevalence (%)
according to adjustment 1* according to adjustment 2**
Factors (N =2,122) (N =2,122)
Eating habits
Consumption at least 5 days per week of
Fruit 52.1 48.9
Raw vegetables 59.7 56.8
Cooked vegetables 28.9 24.9
None of the above 22.2 24.3
Physical activity during leisure time
At least 30’ of moderate or intense physical activity:
1 or more days per week 29.4 28.7
3 or more days per week 17.2 15.6
5 or more days per week 7.0 6.0
Sedentary lifestyle
Self-reported light or very light physical effort during work
and no physical activity during leisure time: 47.4 46.7
Smoki ng
Smokers 19.7 20.8
Former smokers 21.2 22.8
Alcohol consumption >2 doses per day:
At least once a week 13.4 15.0
Every day or almost every day 3.7 3.8
Self-reported:
Overweight (BMI ≥25 kg/m2) 39.3*** 40.8***
Obesity (BMI ≥30 kg/m2) 10.5*** 10.0***
Arterial hypertension 22.1 21.9
D i abetes 6.0 5.4
BMI: body mass index
*Adjusted to ‘represent’ the population of adults with telephone in the municipality **Adjusted to ‘represent’ the total adult population of the municipality
%
Rev Saúde Pública 2005;39(1) www.fsp.usp.br/rsp
Surveilance of risk factors for chronic diseases Monteiro CA et al
and without telephone. We shall examine each of these aspects below.
The telephone registry used by the SIMTEL/MSP seems to be virtually univer-sal, given that the proportion of households with telephone service calculated based on this registry approaches the coverage calcu-lated based on household surveys. Consider-ing the number of lines in the 2003 registry (2,915,860 lines), subtracting from this number the percentage of commercial lines (4.4%), and also considering the mean number of lines per household (1,08), we arrive at a total of 2,581,076 households with telephone
service, which would cover 84.9% of permanent house-holds estimated for the same year (2003) in the Mu-nicipality of Sao Paulo (3,040,047 according to the Fundação Sistema Estadual de Análise de Dados – Seade).* We arrive at similar levels coverage if we base our calculations on the proportion of households in the Municipality of Sao Paulo with at least one tel-ephone line in the year 2000 (67% according to Cen-sus data, processed by us) and on an expansion in cov-erage of about 10% per year in the 2000-2003 period (projection based on the evolution of fixed telephone coverage in the Southeast Region of Brazil between 1999 and 2001).** It is assumed that the telephone registries used by the BRFSS system include a large
share of the universe of residential telephone lines, even though the registries fail to distinguish between residential and other lines in a number of states.17
The availability of a computerized registry, strati-fied by area of residence and specific for residential telephone lines, allowed the use of systematic sam-pling by strata, which is a fairly simple, traditional and reliable sampling procedure for the selection of tel-ephone lines.18 In order to draw the telephone user to
be interviewed, an equally simple and reliable proce-dure –selection based on random number lists – was employed.8 The American BRFSS employs much more
complex sampling systems due to the lack of a registry
Table 3 - Prevalence (%) of risk and protective factors for CNCDs in the adult male and female population of the Municipality of Sao Paulo. SIMTEL/MSP, 2003.
M en W omen
(N =855) (N =1,267)
Factors % (95% CI) % (95% CI)
Eating habits
Consumption at least 5 days per week of
Fruit 39.5 (35.0-43.9) 57.1 (53.2-61.0)
Raw vegetables 52.3 (47.8-57.0) 60.7 (56.6-64.8)
Cooked vegetables 17.6 (14.5-20.8) 31.2 (27.8-34.5)
None of the above 31.4 (27.2-35.7) 18.1 (15.3-20.9)
Physical activity during leisure time
At least 30’ of moderate or intense physical activity:
1 or more days per week 39.3 (34.7-43.8) 19.4 (16.7-22.1)
3 or more days per week 17.3 (13.7-20.8) 14.1 (11.7-16.5)
5 or more days per week 6.4 (4.4-8.3) 5.7 (4.2-7.2)
Sedentary lifestyle
Self-reported light or very light physical effort during
work and no physical activity during leisure time: 33,9 (29.8-38.1) 57.9 (54.1-61.7) Smoki ng
Smokers 23.8 (20.0-27.6) 18.2 (15.4-21.0)
Former smokers 27.8 (23.7-31.8) 18.5 (15.6-21.5)
Alcohol consumption >2 doses per day:
At least once a week 23.9 (19.9-28.0) 7.2 (5.4-9.0)
Every day or almost every day 7.4 (5.2-9.7) 0.6 (0.2-1.1)
Self-reported:
Overweight (BMI ≥25 kg/m2) 45.4* (40.8-49.9) 36.3** (32.7-39.9)
Obesity (BMI ≥30 kg/m2) 9.4* (7.0-11.8) 10.5** (8.3-12.7)
Arterial hypertension 18.2 (14.7-21.7) 25.0 (21.9-28.2)
D i abetes 5.0 (3.2-6.8) 5.8 (4.3-7.2)
*N=844; **N=1,173
95% CI: 95% confidence interval BMI: body mass index
Figure 2 - Frequency (%) of selected risk factors according to years of schooling in the female adult population the Municipality of Sao Paulo. SIM TEL/M SP, 2003.
0 20 40 60 80
Sedentary lifestyle Overweight Obesity
%
0-4 5-8 9-11 12+ years
P < 0,001
p= 0,000
p= 0,000
& Rev Saúde Pública 2005;39(1) www.fsp.usp.br/rsp Surveilance of risk factors for chronic diseases
Monteiro CA et al
specific for residential telephone lines. These proce-dures include a prior stage in which area codes are drawn for a study of the proportion of residential lines in each area code, and codes with greater potential for containing residential lines are selected. In addition to a greater number of telephone calls, these proce-dures also require the use of additional weighting fac-tors in order not to compromise the final representa-tiveness of the sample obtained.19 In its early years, the
BRFSS selected for the interview the subject whose birthday was closest to the date of the interview, but this procedure has recently been replaced by the use of random number sequences.17 During the pre-testing of
the system implemented in Sao Paulo, we observed that the selection procedure based on birthdays took an excessive amount of time and was not always prop-erly understood by the respondent.
The proportion of completed interviews in relation to the total interviews predicted in the SIMTEL/MSP was 84.7%. This success rate is similar to those ob-tained in household surveys carried out in the 1980’s and 90’s in the Municipality of Sao Paulo10,12 and
higher than the success rate obtained in different US states by the BRFSS system (median success rate of 56.7% in 1999, ranging from 38.4% to 83.9%). The so called ‘cooperation rate’ (the proportion of inter-views completed over the proportion of interinter-views completed plus refusals) was equally higher in the SIMTEL/MSP: 88.0%, versus 68.4% in the BRFSS.4
Therefore we conclude that the sample interviewed by the SIMTEL/MSP represents the population of the Municipality of Sao Paulo with telephone. Re-garding the representativeness of the sample in rela-tion to the entire popularela-tion, as we have seen, one must consider the coverage of telephone services in the municipality and the differences between the population with and without telephone. In 2003, the proportion of households with telephone in the mu-nicipality, according to the estimates already men-tioned, was of approximately 85%; a high, albeit far from universal, coverage. The differences between the population with and without telephone in the mu-nicipality cannot be determined directly, given that the most recent data available for such a comparison date from the year 2000, when the coverage of tel-ephone services in the municipality was substantially lower than in 2003. Notwithstanding, a comparison between the distributions with respect to schooling in the sample studied by the SIMTEL/MSP and in the sample of the total adult population of the mu-nicipality suggests substantial – though not surpris-ing – socioeconomic disadvantages to the popula-tion without telephone (Table 1). Differences between the two samples were also found in terms of gender
and age, the monitoring system sample showing lesser proportions of males and of individuals aged 18-24 years than those projected by the census. Such differ-ences, however, were due especially to the greater failure rates in the interviews with men and, gener-ally speaking, with very young subjects. The BRFSS does not face problems related to the telephone cov-erage given the universal covcov-erage in all American states. Nevertheless, higher failure rates in interviews with men and youngsters in general determine repre-sentativeness issues in terms of gender and age very similar to those observed in the Municipality of Sao Paulo. Thus, between 1981 and 1987, the proportion of men in the BRFSS sample ranged from 40% to 42% and the proportion of individuals aged 18-24 years form 11% to 14%, while the same proportions in the 1980 American demographic census were, re-spectively, 48% and 19%.20 In the SIMTEL/MSP
sam-ple, the proportion of males was 39.9% and that of youngsters, 14.2%, versus 46.6% and 19.8%, respec-tively, in the 2000 demographic census.
In order to extend the representativeness of the monitoring system sample to the entire adult popula-tion of the Municipality of Sao Paulo we developed adjustment factors that simulate, in the sample, the structure in terms of gender, age group, and school-ing observed in the entire adult population in the year 2000. These factors, when applied to the sample of the system, produce estimates that would be ob-served if the sociodemographic structure of this sam-ple were the same as that of the entire population. An analogous procedure is adopted by the BRFSS in or-der to obtain estimates extendable to the entire US adult population.17 In addition to making estimates
closer to those that would be obtained in case the total population of the municipality could be stud-ied directly, the use of adjustment factors also allows us to control any eventual changes that may occur in the structure of the monitoring system sample from year to year. Such possibility is especially important in our case, since changes in the structure of the popu-lation covered by telephone services are likely to occur on a short term basis, given the expansion that is still likely to occur in the coverage of the telephone system in the Municipality of Sao Paulo (and in other Brazilian cities).
formu-'
Rev Saúde Pública 2005;39(1) www.fsp.usp.br/rsp
Surveilance of risk factors for chronic diseases Monteiro CA et al
lation of indicators; 3) payment of the technical team (coordinator, two assistants, and two interviewers); and 4) cost of telephone calls. The two first elements of the expense are hard to quantify, since their cost was absorbed by the institution (NUPENS/USP) that tested the system. In any case, equipment and system design tend to represent a small share of the total cost of the system, since these expenses are incurred in only once, and are therefore diluted throughout the entire period of system operation. The monthly earn-ings of the project team (R$700.00* for each inter-viewer and assistant and R$1,500.00 for the coordi-nator) amounted to R$6,201.60, or R$18,604.80 for the three months of operation, already including taxes and labor duties. The cost of telephone calls and of the monthly fees of the three telephone lines used amounted to R$4,530.80, taxes included. Thus the variable cost of the system amounted to R$23,135.60, or R$10.90 per completed interview.
Higher per-interview costs are usually observed in household surveys. The authors’ experience in other household health and nutrition surveys car-ried out in the Municipality of Sao Paulo indicated mean costs per completed interview between R$50,00 and R$100,00, depending on the charac-teristics of the interview. The mean cost of the tel-ephone interviews carried out in the American BRFSS system is estimated at 25-30 US dollars, (roughly 90.00 Brazilian Reais), two to five times lower then the mean cost of household interviews conducted in the United States.17 In addition to
be-ing relatively inexpensive, the SIMTEL/MSP proved extremely agile: the entire process of sam-ple selection, scheduling, and interviewing was completed in three months, a preliminary report was produced 30 days after the completion of the last interview, and a full report was completed after 120 days. We wish to highlight that, although the SIMTEL/MSP operated for three months, it would be equally possible to extend system operation to twelve months, so as to make system operation con-tinuous, as in the American BRFSS system.
The present study showed that the system of moni-toring of risk factors for CNCDs based on telephone interviews is capable of reaching good performance in Brazilian urban areas similar to Sao Paulo, be it in terms of sample representativeness, be it in terms of the cost and agility of the system. Further studies must focus on aspects related to the reliability and validation of monitoring systems such as the one im-plemented in the Municipality of Sao Paulo.
ACKN O W LED GEM EN TS
We would like to thank the local telephone com-pany – Telecomunicações de São Paulo S/A (Telesp) – for its help with drawing the sample of residential telephone lines; Silvio Fernando Barbieri for his ex-pertise in the field of informatics; and Rosemary Sena Alves, Maria Gabriela da Cunha, and Danira Martins Passos for the technical support in all stages of the project.
*1 Real (R$) corresponds to about 2.5-3.0 US dollars.
REFEREN CES
1. Barreto ML, Carmo EI. Tendências recentes das doenças crônicas no Brasil. In: Lessa I, organizador. O adulto brasileiro e as doenças da modernidade: epidemiologia das doenças crônicas não-transmissí-veis. São Paulo: Hucitec; 1998. p. 15-27.
2. Bloch KV. Fatores de risco cardiovasculares e para o diabetes mellitus. In: Lessa I, organizador. O adulto brasileiro e as doenças da modernidade: epidemiolo-gia das doenças crônicas não transmissíveis. São Paulo: Hucitec; 1998.
3. Centers for Disease Control and Prevention [CDC]. Behavioral Risk Factor Surveillance System – BRFSS. About the BRFSS [on-line] 2004. Available from: URL: http://www.cdc.gov/brfss/about.htm [2004 abr 5]
4. Centers for Disease Control and Prevention [CDC]. Behavioral Risk Factor Surveillance System – BRFSS [on-line] 2004. Available from: URL: http://
www.cdc.gov/brfss/quality.pdf [2004 abr 5].
5. Centro N acional de Epidemiologia [CEN EPI]. Proposta para implantar o monitoramento de doenças não transmissíveis, de seus fatores de riscos e de outros agravos à saúde. Brasília (DF): Ministério da Saúde/ Fundação Nacional de Saúde; 2001. [ D ocumento Base]
6. Dean AG, Arner TG, Sunki GG, Friedman R, Lantinga M, Sangam S et al. Epi Info, a database and statistics program for public health professionals. Atlanta, Georgia, USA: Centers for Disease Control and Prevention; 2002.
7. Instituto Nacional de Alimentação e Nutrição [INAN]. Pesquisa nacional sobre saúde e nutrição – PNSN, 1989. Arquivo dos dados da pesquisa. Brasília (DF); 1990.
Rev Saúde Pública 2005;39(1) www.fsp.usp.br/rsp Surveilance of risk factors for chronic diseases
Monteiro CA et al
16. Monteiro CA, Conde WL, Matsudo SM, Matsudo VR, Benseñor IM, Lotufo PA. A descriptive epidemiology of leisure -time physical activity in Brazil (1996/97). Rev Panam Salud Publica 2003;14:246-54.
17. Remington PL, Smith MY, Williamson DF, Anda RF, Gentry EM, Hogelin GC. Design, characteristics, and usefulness of state-based behavioral risk factor surveillance: 1981-87. Public Health Rep 1988;103:366-75.
18. Silva NN. Amostragem probabilistica. 2ª ed. São Paulo: EDUSP; 2000.
19. Waksberg J. Sampling methods for random digit dialing. J Am Stat Assoc 1978;73:40-6.
20. World Health Organization [WHO]. Sample size determination in health studies. A practical manual. Geneva; 1991.
21. W orld Health Organization [W HO]. Summary: surveillance of risk factors for noncommunicable diseases. The WHO STEP wise approach. Geneva; 2001.
22. World Health Organization [WHO]. The world health report 2002: reducing risks, promoting healthy life. Geneva; 2002.
23. World Health Organization [WHO]. Diet, nutrition and the prevention of chronic diseases. Geneva; 2003. 9. Mondini L, Monteiro CA. Mudanças no padrão de
alimentação na população urbana brasileira (1962-1988). Rev Saúde Pública 1994;28:433-9.
10. Monteiro CA. Saúde e nutrição das crianças de São Paulo: diagnóstico, contrastes sociais e tendências. São Paulo: Hucitec/Edusp; 1988.
11. Monteiro CA, Mondini L, Souza ALM, Popkin BM. The nutrition transition in Brazil. Eur J Clin Nutrit
1995;49:105-13.
12. Monteiro CA, Conde WL. Tendência secular do crescimento pós-natal na cidade de São Paulo (1974-1996). Rev Saúde Pública 2000;34(6 Supl):41-51.
13. Monteiro CA, Benicio MHD’A, Conde WL, Popkin BM. Shifting obesity trends in Brazil. Euro J Clin Nutrit 2000;54:342-6.
14. Monteiro CA, Mondini L, Levy-Costa RB. Mudanças na composição e adequação nutricional da dieta familiar nas áreas metropolitanas do Brasil (1988-1996). Rev Saúde Pública 2000;34:251-8.