1. INTRODUCTION
1.1. FOREWORD
This document presents the main activities carried out in 2005 in the frame of the Contract of Association (CoA) signed in 1990 by the European Atomic Energy Community (EURATOM) and “Instituto Superior Técnico” (IST), hereinafter referred to as Association EURATOM/IST, and of the Contract of Associated Laboratory on Plasma Physics and Engineering signed in 2001 by “Fundação para a Ciência e a Tecnologia” (FCT) and IST, hereinafter referred to as Associated Laboratory (AL). The CoA activities are described in chapters 2 to 12, while the AL activities are presented in chapters 2 to 9, 12 and 13 to 18. Chapter 19 contains the list of publications, laboratorial prototypes, prizes and awards.
The activities described in this document were mainly performed by “Centro de Fusão Nuclear” (CFN) and “Centro de Física de Plasmas” (CFP), two Research Units of IST (Figure 1.1). The other collaborating Institutions are presented in Figure 1.1 and Table 1.1.
1.2. ASSOCIATION EURATOM/IST
The Contract of Association EURATOM/IST frames the Portuguese participation in the EURATOM Specific Research and Training Programme in the Field of Nuclear Fusion Energy, hereinafter referred as Community Fusion Programme. This Programme has as its long-term objective
the development of a prototype commercial fusion power plant. It is presently implemented through several Agreements, in particular: (i) Contracts of Association signed between EURATOM and Institutions of the Member States of the European Union and Switzerland (Associates); (ii) the European Fusion Development Agreement (EFDA); and (iii) the Mobility Agreement, both signed by EURATOM and its Associates.
The work programme of the Association EURATOM/IST includes activities carried out in Portugal (mainly related with the tokamak ISTTOK) and abroad related with the operation and scientific exploitation of large and medium-sized tokamaks and stellarator (JET, (Figure 1.2) ASDEX-Upgrade, TCV, and TJ-II) as well as with the design of the next generation fusion devices (ITER (Figure 1.3) and W7-X).
1.3. MAIN PROJECTS IN 2005
The Association EURATOM/IST had in 2005 the following main Projects:
Tokamak ISTTOK;
Participation in the collective use of the JET facilities by the EFDA Associates;
Participation in the ASDEX-UPGRADE Programme; Participation in the TCV Programme;
Participation in the ITER Project; Other activities on theory and modelling; Participation in the TJ-II Programme;
Other activities on control, data acquisition and signal processing;
Keep-in-touch activities on inertial fusion energy; Participation in the Fusion Technology Programme; Other fusion-related activities.
Table 1.1 presents information about the responsible person(s) and the Institutions involved in each project.
Project Responsible Person(s) Collaborating Institutions
Portuguese Other
Tokamak ISTTOK Carlos Varandas CFN1 UBI2
CEI3, CFA4
CIEMAT5, IPP-Kharkov6, UI7, IFUR8, IFUSP9 Participation in the collective use of the
JET Facilities by the EFDA Associates
Fernando Serra CFN, CEI, UBI
EFDA10 CSU11 Culham UKAEA12
Participation in the ASDEX Upgrade programme
Maria Emília Manso Fernando Serra
CFN IPP-Garching13 Participation in the ITER Project Carlos Varandas
Maria Emília Manso
CFN EFDA CSU Garching
Participation in the TJ-II programme Carlos Varandas CFN, CEI CIEMAT
Maria Emília Manso
Participation in the TCV programme Carlos Varandas CFN CRPP14
Other studies on theory and modelling Fernando Serra CFN IFP15, PT16, DFRC17 J. Pedro Bizarro
Other activities on control and data acquisition
Carlos Varandas CFN, CEI IFUSP Keep-in-touch activities on inertial fusion
energy
J.T. Mendonça CFP18
Participation in the Fusion Technology Programme
E. Alves ITN19
Table 1.1 – Responsible person(s) and collaborating Institutions in the 2005 projects of the Association EURATOM/IST
1 CFN means “Centro de Fusão Nuclear” 2 UBI means “Universidade da Beira Interior”
3 CEI means “Centro de Electrónica e Instrumentação da Faculdade de Ciências e Tecnologia da Universidade de Coimbra” 4 CFA means “Centro de Física Atómica da Universidade de Lisboa”
5 CIEMAT means “Centro de Investigaciones Energeticas Medioambientales y Tecnologicas” 6
IPP- Kharkov means “Institute of Plasma Physics of the National Science Center” “Kharkov Institute of Physics & Technology”.
7 UI means “University of Innsbruck”.
8 IFUR means “Institute of Physics of the University of Riga” 9 IFUSP means “Instituto de Física da Universidade de São Paulo” 10 EFDA means “European Fusion Development Agreement” 11
CSU means “Close Support Unit”
12 UKAEA means “United Kingdon Atomic Energy Authority” 13 IPP-Garching means “Max-Planck-Institut für PlasmaPhysik”
14 CRPP means “entre de Recherches en Physique des Plasmas de École Polytechnique Fédérale de Lausanne” 15 IFP means “Istituto di Física del Plasma”
16 PT means “Politécnico di Turino”
17 DFRC means “Department de Recherches sur la Fusion Controlée”. 18 CFP means “Centro de Física dos Plasmas”
Figure 1.2 – Tokamak JET
Figure 1.3 – Tokamak ITER 1.4. ASSOCIATED LABORATORY
The Associated Laboratory on Plasma Physics and Engineering has two thematic areas:
o Controlled Nuclear Fusion;
o Technologies of Plasmas and High-Power Lasers where the following main Projects were carried out in 2005: • Tokamak ISTTOK;
• Participation in the collective use of the JET facilities by the EFDA Associates;
• Participation in the ASDEX-UPGRADE Programme; • Participation in the ITER Project;
• Participation in the TJ-II Programme; • Participation in the TCV Programme;
• Other activities on theory and modelling;
• Other activities on control, data acquisition and signal processing;
• Keep-in-touch activities on inertial fusion energy; • Other fusion-related activities;
• Theory and simulations on high energy density science and astrophysical and space plasma physics;
• Experimental physics and technological developments on ultra intense lasers, radiation sources, plasma based accelerators and biomedical optics (Figure 1.4);
Figure 1.4 - Detail of the compressor stage at the Laboratory for Intense Lasers.
• Space plasma physics;
• Environmental engineering plasma laboratory; • Modelling of plasma reactors (Figure 1.5);
• Non-equilibrium kinetics and simulation of discharges, afterglow plasmas and high-speed planetary entries.
Figure 1.5 - Plasma torch, developed at the University of Cordoba (Spain), and modeled at CFP.
2. TOKAMAK ISTTOK
C.A.F. Varandas (Head), H. Fernandes and C. Silva (Deputy Heads), A. Soares, A. Vannucci, B.B. Carvalho, D. Valcárcel, I. Carvalho, I. Nedzelskij, M.P. Alonso, P. Carvalho, R. Coelho, H. Figueiredo, J. Figueiredo, J. Fortunato, R. Gomes, A. Neto, T. Pereira, V. Plyusnin, Y. Tashchev
2.1. INTRODUCTION
ISTTOK is a small-size (R=46 cm, a=8.5 cm), large aspect-ratio, low magnetic field (0.46 T) limiter tokamak with an iron core transformer (flux swing of 0.22 Vs), equipped with a distributed VME control and data acquisition system. Its low temperature (150 eV), low density (8x10¹⁸ m-3) plasmas are diagnosed by electric and magnetic probes, a microwave interferometer, a heavy ion beam diagnostic and spectroscopic diagnostics.
The main objectives of this project are: (i) development of new diagnostic and control and data acquisition systems; (ii) testing of new operation scenarios (liquid metal limiter and alternating plasma current); (iii) study of the influence of external applied signals on the plasma confinement and stability; and (iv) education and training on tokamak physics and engineering.
This project included in 2005 work in the following main research areas:
• Testing of the liquid metal limiter concept; • Optimization of the ISTTOK operation; • Diagnostics;
• Control and data acquisition; • Plasma physics studies.
2.2. TESTING OF THE LIQUID METAL LIMITER CONCEPT1
IST/CFN has proceeded with the testing of the liquid metal limiter concept.
The liquid metal loop experimental facility has been successful filled with oxide-free Gallium. The overall setup has been tested showing satisfactory operation of the device.
The jet stability and reproducibility has been studied for the 2.30 mm diameter nozzle, which is planned to be used in the tokamak, since it produces a close to 13 cm continuous jet length. The time evolution for a 6 s main valve opening is shown in Figure 2.1. Gallium jet flow velocities and jet Break-Up Length parameter (BUL) have been measured for 1.45, 1.80, 2.09, 2.30 and 2.40 mm nozzle diameters. The results are presented in Figures 2.2 and 2.3.
1
Work carried out in collaboration with the Association EURATOM/University of Latvia. Contact Person: O. Lielausis
Figure 2.1 - The gallium jet time evolution for a 6 s valve opening using a 2.30 mm nozzle. Each frame was obtained using a 700 µs exposition.
The influence of a pulsed magnetic field (0.25 T, 60 ms) on the jet characteristics has been analysed for both spatially uniform line distribution and with a high gradient perturbation. Transients in the magnetic field were found not to perturb significantly the jet behaviour;
Finally, careful studies have been carried out on the observed scattering of Gallium droplets from the lower collector to the main chamber. A damping device has already been tested. Although it has shown a clear reduction on the number of large size (~ 0.5 to 0.2 mm) droplets, until now, it has been unsuccessful to fully eliminate the appearance of small (~10 to 200 µm size) ones. A more technically advanced damping device is under development in order to achieve a full elimination of the droplets that could reach the tokamak vessel.
0 2 4 6 8 10 12 0 2 4 6 8 10 12 v = 2.5 m/s v = 2.9 m/s v = 3.1 m/s v = 3.3 m/s fl ow-rat e ( c m 3/s )
valve time opening (s)
Nozzle 1.45 mm Nozzle 1.80 mm Nozzle 2.09 mm Nozzle 2.30 mm
Figure 2.3 - Break-up length (L) for several nozzle sizes and as a function of Weber number.
2.3 OPTIMIZATION OF THE ISTTOK OPERATION Aiming at optimizing the ISTTOK operation, the gas
injection system has been upgrade by using a fast valve to
allow a better control of the plasma density. The RF
generator used for the discharge pre-ionization has been
replaced by a biased tungsten filament. The new set of
external coils has been simultaneously used as the
transformer primary and as a partial vertical field generator. This approach allows a smaller current on the vertical field quadrupole, with a much higher response time for feedback proposes.
2.4. DIAGNOSTICS 2.4.1. Main activities
This research line included activities on spectroscopy for the analysis of Gallium impurities2, X-ray tomography, retarding field energy analyzer and emissive probes.
The spectroscopy diagnostic, designed to measure neutral Ga density on ISTTOK, has been improved by introducing a multi-channel (x8) fiber in order to acquire Ga spatial density profiles at the plasma edge. The required software has been modified and the diagnostic tested using tokamak cleaning discharges as a plasma source.
A commercial, low cost, CCD video camera has been tested. The test proved that these types of cameras are not adequate to be used as detectors in a soft X-ray tomography diagnostic due to the high noise level and the slow acquisition rate. A new diagnostic based on three linear 10-pixel detectors to perform real-time tomography from three different views has been designed.
The design, installation and testing of a retarding field
energy analyzer for the measurement of the edge ion
temperature has been performed.
An improved version of the multi-pin array of emissive
probes has been installed on ISTTOK (Figure 2.4), which
allows the simultaneous measurement of the density,
2
Work carried out in collaboration with the Association EURATOM/University of Látvia. Contact Person: Ivars Tale.
poloidal and radial electric field, and their fluctuations in a spatial scale smaller than the turbulence correlation length.
2.4.2. Retarding Field Energy Analyzer
The retarding field energy analyzer (Figure 2.5) is rather compact (D14×L23 mm2
) and consits of an input 0.6 mm stainless steel pinhole (S), three Ni grids (G1, G2, G3) and a Cu collector plate (C) separated by MICA insulators. The grid stack is assembled in a boron nitride cup with a 14 mm of external diameter and with 2 mm diameter opening on the pinhole side.
Figure 2.4 - The ISTTOK probe system, consisting of three emissive probes and one cold probe.
Figure 2.5 - Photograph and schematically illustration of the retarding field energy analyser
5 pin C bl P Shaf Suppo C Pin Wa Colle MI
G
Shaft Plu Cu Support Cables Collector Pinhol MICA G Washe 5 pin 1 , 4 1 , 6 1 , 8 2 , 0 2 , 2 2 , 4 2 , 6 0 2 0 4 0 6 0 8 0 1 0 0 1 2 0 1 4 0 1 6 0 BU L ( mm) N o z z l e d i a m e t e r ( m m ) 0 10 20 30 40 50 60 70 80 0 50 100 150 200 We L/ d ISTTOK data 5.9*We^0.48A +100 V sawtooth voltage is applied to the second grid G2 to obtain the ions characteristic, while grids G1 and G3
are kept at –50 V to suppress the respective electron flux from plasma and secondary electrons from collector. Figure 2.6 shows a typical characteristic obtained in the ISTTOK scrape-off layer (1.3 cm outside the limiter) as well as an exponential fit to the experimental data. The derived ion temperature (Ti = 14 eV) is typically a factor of two larger than that of the electrons at the same location, which is in agreement with the results of the scrape-off layer models. 0 10 20 30 40 50 60 70 80 90 100 -0.1 0.0 0.1 0.2 0.3 0.4 Ti = 14 eV Ushift = 18 V shot #12137 0.3*exp(-(x/0.002-18)/14)-0.08 irfea , a. u. Us, V
Figure 2.6 - Typical characteristic obtained in the ISTTOK scrape-off layer
2.5. CONTROL AND DATA ACQUISITION 2.5.1. Main activities
In 2005, a real-time controller for the horizontal plasma position, a PCI timing board, a new version of software for
shared remote data consulting and analysis and remote data analysis tools have been developed. New power supplies have been designed and commissioned with
optically isolated communication circuits and with local processing capabilities for self-implementation of control algorithms.
2.5.2. Real-time controller for the horizontal plasma position
The real-time controller for the horizontal plasma position allows controlling the vertical magnetic equilibrium field using a novel power supply. This controller is based on an existing PCI module (PCI-TR-256), developed at CFN.
The main technical characteristics of this module are: 8 galvanic isolated channels, with 14-bit ADC @ 2
MHz;
a Texas Instruments Fixed-Point DSP @ 500 MHz (TMS320C6415);
a Xillinx FPGA (Spartan-IIE XC2S400E); 512 MB SDRAM memory module;
The module software acquires data from 8 poloidal magnetic probes, removes the offset present in the signals, numerically integrates them, calculates the plasma position using the current filaments method and generates a power supply control signal with a PI controller. Off-line tests
show that this system is capable of performing the plasma position calculation in 74 µs and that its time evolution is similar to the plasma position calculated offline with floating-point numerical codes running in MatLab.
2.5.3. Timing board
A new PCI-EPN board is intended to improve the trigger and the synchronism between the various ISTTOK diagnostics and allowing the migration of the ISTTOK CODAS to an event based system. The boards are on prototype stage and are planned to be operational earlier 2006.
2.5.4 New power supplies
A new concept of switched power supplies (57 kHz) were designed and completed with an embedded microcontroller, for the necessary current drive of the vertical and horizontal magnetic fields. This option allows a direct implementation of PID algorithms with a faster response time. Each power supply will allow a maximum current of 100A, with a very compact design and bipolar capabilities.
2.5.5. Cooperative software for shared tokamak operation
A new version of a multi-user platform, based on standards like CORBA, XML and JAVA, has been developed for remote control and data acquisition experiments. The main objective of this tool is to detach the machine operation from a single computer, allowing hardware configuration, experiment follow and data share by all the connected users. Among the main features it has a built-in chat, profile saving and sharing and remote calculation invocation. Since it was developed in JAVA and deployed with JAVA Web-Start technology, it can run in all the most common operating systems and computer platforms like PCs, Solaris and Mac in a very intuitive way. The software is plugin based, providing an easy way of adding new hardware, data viewers and data calculation algorithms. Since every hardware is described in a XML file, the program automatically creates configurators to the hardware. Every time a configuration is changed, the information is sent to hardware controller so that in the next discharge the hardware is programmed accordingly.
2.5.6. Remote data analysis tools
Based on the Extensible Markup Language (XML) and the Remote Method Invocation (RMI) standards, a client/server remote data analysis application has been developed for intensive data processing. This GRID oriented philosophy presents a powerful tool to maintain centralized computational resources (Figure 2.7). Another major feature is the ability to share proprietary algorithms in remote computers without the need of local code and
libraries installation and maintenance. The 16 CPU Orionte cluster in operation at CFN is currently used to provide remote data analysis. The codes running in languages such as Octave, C, Fortran or IDL are called through a script remote invocation and data is released to the client as soon as available. The remote calculations parameters are described in a XML file containing the configuration for the server runtime environment. Since the execution is made by calling a script any program can be launched to perform the analysis. Some properties of the ISTTOK plasma that require heavy computational resources are already obtained using this approach, allowing ready intershot analysis and parameterization decisions.
Figure 2.7 - The remote data analysis protocol scheme
2.6. PLASMA PHYSICS STUDIES 2.6.1. Introduction
The ISTTOK plasma physics studies were related in 2005 with:
o Control of edge transport by emissive electrode biasing; o Plasma SOL flow measurements;
o Emissive probe measurements.
2.6.2. Control of edge turbulent transport by emissive electrode biasing
Emissive electrode biasing experiments have been previously investigated on ISTTOK. Experiments revealed that although a large radial electric field is induced by emissive electrode bias for both polarities (up to ±15 kV/m), a significant improvement in particle confinement is only observed for negative bias. The main motivation for this work is therefore to contribute to the better understanding of the distinct plasma behaviour with positive and negative bias. The boundary plasma was further characterized with focus on the relation between ExB sheared flows and particle transport. The use of emissive electrodes allowed, for the first time, the extension of this investigation to negative bias.
The ExB flow shear has been independently estimated from a radial array of Langmuir probes and a Gundestrup probe, which measures the parallel and perpendicular
plasma flows. A good agreement has been found both in the profile and the absolute magnitude. We have observed that the magnitude of the ExB flow shear, in the region just inside the limiter position, is larger for negative bias. The ExB sheared flows induced by negative bias exceeds significantly the turbulence de-correlation time across most of the boundary plasma, while for positive bias this is only valid near the LCFS (r-a>-4 mm). The importance of the ExB flow shear on the global particle confinement has been demonstrated by the good correlation observed between these two quantities for both polarities in a wide range of bias conditions (Figure 2.8). We have found that above a certain threshold value of the ExB shearing rate (~1x10⁶ kV/m2) an improvement in particle confinement is observed for both polarities, being that value a factor of three larger than the turbulence de-correlation time. Results support therefore that the distinct particle confinement behaviour observed for positive and negative bias is related with the different ExB flow profile induced by edge biasing.
0 5 10 15 20 25 30
ExB flow shear (105 V/m2)
0.5 1.0 1.5 2.0 2.5 (n/H α )Bias /(n/H α )No Bias Negative bias Positive bias
Figure 2.8 - Dependence of the modification in particle confinement induced by electrode biasing ([n/Hα]Bias/[n/Hα]No Bias) with the ExB shearing rate in the region just inside the
LCFS.
The effect of electrode bias on the edge turbulent transport has also been investigated identifying the changes induced on the fluctuations frequency spectrum and probability distribution function, PDF. We have observed that negative electrode bias reduces the large amplitude, low frequency events, resulting in low amplitude fluctuations with a near Gaussian distribution across most of the scanned region. For positive bias, a substantial reduction of the fluctuations is also observed in the SOL. However, large amplitude, broad spectrum fluctuations appear in the core periphery, which increase the cross-field transport and contribute to the observed asymmetry in particle confinement with the bias polarity. 2.6.3. Plasma SOL flow measurements
Plasma SOL flow measurements were made using a Gundestrup Probe. A 1D fluid probe model was used to
deduce the parallel and perpendicular components of the unperturbed flow, taking into account the roundness of the collectors. The radial profile of the Mach numbers is shown in Figure 2.9. We note that the positive bias is not able to drive large sheared flows, which for both type of bias are larger around the limiter radius. The perpendicular Mach number behaves in opposite ways inside the LCFS and in the SOL region when bias is applied. We further note that the unbiased plasma exhibits a toroidal flow of about 0.2 throughout the measured region, being the direction the same as that of the toroidal field and plasma current. Furthermore, we note that the modification induced by biasing in the flows is maximum for negative bias and occurs in the region just inside the limiter for both parallel and perpendicular flows.
Figure 2.9 - Radial traces of parallel and perpendicular Mach numbers.
2.6.4. Emissive probe measurements3
Detailed measurements of the edge quantities with high temporal and radial resolutions have been performed with a multi-pin array of emissive probes. The main aim of this work was to investigate the importance of temperature fluctuations in the turbulent transport estimation. Both the root mean square of the poloidal electric field and the fluctuation-induced particle flux were found to be significantly larger when measured with the emissive probes, indicating that temperature fluctuations are important for the particle flux determination. The flux distribution was also found to be more peaked and asymmetric when measured with the emissive probes (Figure 2.10). A clear reduction of the turbulent particle flux and an improvement of the plasma confinement are observed during the negative emissive electrode biasing.
3
Work carried out in collaboration with the Association EURATOM/OAW (University of Innsbruck). Contact Person: Roman Schrittwieser.
Figure 2.10 - Probability distribution functions for the normalized turbulent particle flux at r = -8 mm inside LCFS.
-2 0 2 4 6 0.01 0.1 1
PD
F (
Γ)
Γ / RMS( Γ ) cold emissive probes3. PARTICIPATION IN THE USE OF THE JET FACILITIES BY THE EFDA ASSOCIATES
F. Serra (Head), A. Figueiredo, A. Vannucci, B. Gonçalves1, C. Silva, C. Varandas, D. Alves, D. Borba2, F. Nabais, F.
Salzedas, I. Nedzelski, I. Nunes, J. Sousa, L. Cupido, L. Fattorini, L. Meneses, N. Cruz, M.E. Manso, M.F. Nave, P. Belo, P. Varela, R. Coelho, S. Cortes, S. Hacquin3, T. Ribeiro, V. Plyusnin.
1 Member of the Close Support Unit.
2 Head of Office for the EFDA Associate Leader for JET 3 Secondee with JOC.
4 Work carried out in collaboration with the JET EFDA Contributers 3.1. INTRODUCTION
The Association EURATOM/IST has proceeded with its participation in the collective use of the JET facilities, in the frame of the “European Fusion Development Agreement” (EFDA) through the “JET Operation Contract” and the “JET Implementing Agreement”.
The main activities carried out during this year were related with: • Operation; • Scientific exploitation; • Performance enhancements; • Management. 3.2. OPERATION
Two members of the IST/CFN staff have been working in the JET Operation Team:
One physicist belonged to the “Electron Kinetics
Group”, being responsible by maintenance and data
validation of the X-mode correlation reflectometer (KG8b) and the O-mode fluctuation reflectometer (KG3), as well as completing some shifts as “Diagnostic co-ordinator” (DCO) during the restart campaign; The other physicist belonged to the “Operation Group”,
being involved namely in the development of new plasma scenarios and configurations, in particular for the new divertor, and in the conceptual design of the tiles for all the main JET limiters and antenna (ICRH and LHCD) protections, and acting as first Session Leader in the restart of JET (during September/December 2005). 3.3. SCIENTIFIC EXPLOITATION4
3.3.1. Introduction
The participation in the JET 2005 Work Programme had contributions from fifteen physicists who performed post-analysis of data from the experimental campaigns C13 - C14, and who were also involved in the preparation of the Campaigns C15-C17. The work was focused on code
developments and physics studies related mainly with Task Forces M (with contributions to S1,S2, and T) , D and E.
3.3.2. Integration of transport and MHD codes
(i) Implementation of sawtooth models into the transport code JETTO
The so-called sawtooth crash is thought to start with the onset of the m/n=1/1 internal kink mode. During this crash a reconnection process results in the drop of the central temperature. The corresponding outward transport of energy defines an inversion radius that separates the central region, where energy is lost, from an outer region, where energy is deposited.
Until recently the sawtooth physics available in the transport code JETTO was limited to a simple phenomenological model. At a user specified sawtooth crash time, the bulk plasma profiles of density and pressure were flattened within a user specified radius. No redistribution of the magnetic flux was included. In addition, the code could not be used for predictive sawtooth studies since no sawtooth trigger model was available. Following an assessment of available numerical modules, it has been proposed implementing into JETTO: (i) the NTCC Module KDSAW used in TRANSP; and (ii) the Porcelli’s sawtooth trigger model available in the BALDUR code. The first part of this work, the implementation of KDSAW into JETTO, has been carried out and completed (Figure 3.1). KDSAW is now fully integrated and tested. A new interface for JAMS has been written. WEB documentation has been prepared. The second part of the work, i.e. the work on the implementation of the Porcelli model was initiated. A test version of JETTO including the Porcelli model is now available.
(ii) Testing JAMS interface for the equilibrium code
HELENA and for the MHD code MISHKA5
The MHD codes MISHKA and HELENA have recently been integrated into JAMS. However, in order to simplify the JAMS input panels only a limited number of parameters were offered to the user, for the study of edge stability. Test runs of MISHKA and HELENA were
5 Work performed in collaboration with the Association EURATOM/UKAEA,
made to assess the input required in the JAMS interface for the study of core MHD modes. This will be useful for the study of core MHD stability in Optimised shear as well as in ELMy H-mode plasmas. In addition the HELENA and MISHKA codes were tested for the edge MHD analysis of ELM-free discharges with large edge bootstrap currents. Areas for improvement in the input panels, output files and JAMS interface have been identified.
Figure 3.1 – Time traces of central q, Te and ne comparing the
treatment of sawtooth crashes with KDSAW (curves a (no reconnection), b (partial reconnection) and c (full reconnection)) and the old JETTO (curve d).
3.3.3. JET sawtooth studies
Auxiliary heating be that either from ICRF or NBI has come to be associated with sawtooth stabilization leading to long sawtooth periods. Recent JET experiments challenged our sawtooth knowledge, as observations showed that both types of heating can produce short sawtooth periods, in the range of τST=20-100 ms, that are shorter than observed in Ohmic
heated plasmas. Experimental results from small sawtooth regimes have continued to be analysed, in particular on sawtooth observations in the reversed BT campaign.
Observations with counter-NBI indicated the important role of rotation on sawtooth stability (Figure 3.2). Two conclusions were made: (i) q-profile modifications from NIB driven current have been excluded as a possible explanation for the different sawtooth observation in co- and counter-NBI; and (ii) qualitatively, the sawtooth period observations may be explained by shear rotation effects on the internal kink stability.
3.3.4 Modelling edge stability of JET quiescent H-mode plasmas
The edge stability of JET QH-mode discharge #59611 has been studied using different versions of the transport code JETTO coupled to an ELM cycle model. Attempts on JET to access the Quiescent H-Mode (QMM) regime with counter-NBI heating, produced plasmas with extended ELM-free phases up to 1.5 s duration. These were characterised by continuous edge n=1 MHD modes similar to the DIII-D “edge harmonic oscillation”. The possibility that the edge n=1 mode observed in the QH-mode plasmas may be an external kink QH-mode (similar to the JET Outer Mode observed in Hot-ion H-mode plasmas) is being considered. Different models for the calculation of the Bootstrap Current and Neo-Classical transport were tried (Figure 3.3). A systematic variation of input parameters while searching for continuous ELMs has been made first with the JETTO Default version, then with a JETTO version that is coupled to a Theory Motivated Ballooning/Peeling ELM model. Continuous peeling modes have been obtained with the latter. Sensitivity studies of ELM stability to different edge parameters and to assumptions in the model is in progress. In addition, the edge stability of the n=1 mode is being studied with the codes HELENA and MISHKA.
W
Figure 3.2 – Pair of JET discharges with counter-NBI showing sawtooth periods similar or smaller than observed with Ohmic heating. (a) Total and perpendicular NBI power; (b) Volume averaged power transferred to the electrons, at the flux surface
ψ=0.1 (calculated with the PENCIL code); and (c) observed sawtooth period. Vertical lines indicate the times when perpendicular NBI was added: t=17.5 for pulse n. 59707 and t=21 s for pulse n. 59706. c(kdsaw f=1) b (kdsaw f=0.5) a (kdsaw f=0) d (jetto) q Te ne a a Time(s) b b c d c d
3.0 3.2 3.4 3.6 3.8 R(m) 2 4 6 8 0 0 T , T [keV] e i T (ECE)e T (Core CXRS)i T (edge CXRS) i 4 3 2 1 0 5 3.6 3.8 3.4 3.2 3.0 4.0 ne (10 19m -3) R (m) Pulse No: 59611 ne (Core LIDAR)
ne (Edge Lithium Beam) ELM-free phase ELMy phase t=22 s t=16.5 s 1.5 0.5 0 1.0 2.0 3.2 3.4 3.6 3.0 3.8 10 6A/m 2 R (m) J JG05.515-1c Pulse No: 59611 JETTO Simulations
Figure 3.3 - (a) and (b) – Temperature and density profiles measured in a JET Quiescent H-Mode experiment.(c )– Current Density profile modelled with JETTO: (A) Interpretation runs using measured T and n during quiescent phase, for different models for Bootstrap current (Red: NCLASS model, green: JETTO model). (B) Predictive run without ELMs or any other MHD modes (dotted line).
3.3.5. Contribution to DIII-D experiments in the quiescent H-mode (QHM) regime6
Current ramps were used to study the stability of edge MHD modes as a function of the plasma current, in quiescent H-mode plasmas. The idea for these experiments originated from a proposal from IST to identify the nature of the Edge Harmonic Oscillator (EHO) and to determine if there were similarities with the MHD observations in JET ELM-free plasmas. It had been proposed that the EHO was likely to be an external kink as the JET Outer Mode and therefore its stability should be sensitive to the edge plasma current. As predicted, the experimental results have shown that the EHO is stabilised by ramping down the plasma current, leading to MHD free periods. In contrast, ramping up the plasma current triggered ELMs. Qualitatively the experiment suggested that the edge of the QHM plasma is marginally stable to external kinks. Both EHO and ELMs behave as external kinks (also known as peeling modes). The EHO observations are consistent with a non-linearly saturated external kink, while the ELMs appear to be linearly unstable external kinks.
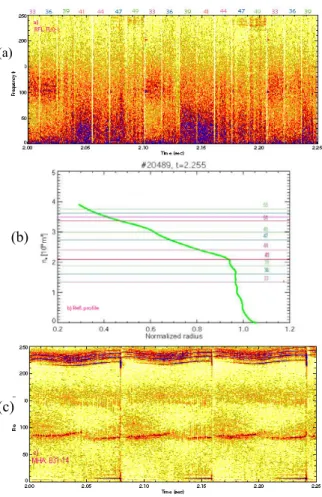
3.3.6. Data analysis of n=0 chirping modes observed in JET ion cyclotron heated plasmas.
Persistent rapid up and down frequency chirping modes with a toroidal mode number of zero (n=0) have been observed in the JET tokamak (Figure 3.4). They arise only when
energetic ions with a mean energy ~500 keV are created by high field side ion cyclotron resonance frequency heating. A study of fluctuation data from magnetic and reflectometry diagnostics has been performed.
Figure 3.4 – Spectrogram of the signal of a Mirnov coil on JET showing the chirping n=0 mode.
3.3.7. Forecast of tokamak plasma instabilities using artificial neural networks
A research program was initiated to investigate the possibility of using artificial neural networks to forecast the occurrence of major disruptions and ELM instabilities in JET plasmas. The feed-forward neural networks used were chosen to have two hidden layers and were trained using the well known back-propagation algorithm.
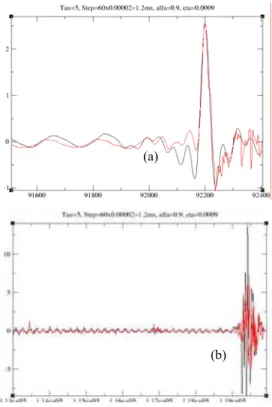
Using soft X-ray signals, the major disruptions in some class of plasma discharges could be forecasted up to 2.0 ms in advance, as shown (Figure 3.5). The red and the black curves correspond to the neural network output and to the experimental data, respectively.
Figure 3.5 – Validation result using JET soft X-ray signal. The red curves represent the output signals from the neural network, forecasted 2.0 ms in advance. In (b) it is shown in detail the last instants of time before the plasma disruption.
(a)
Using magnetic signals, both the disruption event and the ELM occurrences could be forecasted up to 1.2 ms in advance. Figure 3.6 presents the comparison the result of the training process (curve in red) to the experimental data (in black). Figure 3.7 shows in detail, an ELM spike and also the plasma disruption event.
After the neural network has been properly trained it was then put to forecast the ELM occurrences and the plasma disruption events using five other different JET plasma pulses. The results obtained can be considered very good, as illustrated in Figures 8 and 9.
Figure 3.6 – Result of the training process using two JET magnetic signals. The red curve represents the output signals from the neural network, with forecasting time 1.2 ms in advance, and the black curve represent the experimental data.
Figure 3.7 – Time expanded signals of figure 6 showing in detail that the neural network closely matches (a) the ELM spike and (b)
Figure 3.8 – Forecast result (in red) of the JET pulse 62052, using the neural network trained previously. The forecasting time interval is 1.2 ms.
Figure 3.9 – In (a) the disruption event of the JET pulse 62052 (Figure 3.4) is shown in detail. In (b) the time expanded signal of the JET pulse 62310 is presented, showing in detail an ELM spike.
3.3.8. Numerical calculations of the precessional fishbones resonance
A surprising feature of the precessional drift fishbones recently observed in JET low density experiments was its unusually high frequency (around 60 to 90 kHz). To try and explain this, numerical simulations were carried out with the CASTOR-K code. This code allows to calculate the resonant exchange of energy between a mode with an (a)
(b)
(a)
internal kink structure and populations of ICRH driven fast ions as were used in the experiments. It uses the equilibrium calculated by the HELENA code and the eigenmode calculated by the MISHKA code. Thus, the CASTOR-K code was used to calculate the resonant transference of energy
δ
W
HOT between the fast particles population and the mode for different values ofT
HOT, as function of the mode frequency (Figure 3.10). The modes frequencies that maximize this transference should be around the frequencies observed in the experiments.Figure 3.10 shows that the best fit between experimental and numerical results is for a fast ions temperature
T
HOT between 1 MeV and 1.5 MeV, while the value of the fast ions temperatureT
HOT estimated for these experiments was around 1 MeV. It can also be seen that the mode expected frequency increases rapidly as the fast ions temperature increases. To analyse in more detail what is happening, it is needed an orbits analysis.Figure 3.11 (upper half) shows the resonant transference of energy between the internal kink mode (f=50 kHz) and three ICRH driven fast ion populations characterized by different temperatures (500, 750 and 1000 keV). The orbits of the particles in stronger resonance with the mode are also represented in Figure 3.11 (lower half). It can be seen that there are two main resonances, one corresponding to particles nearer the magnetic axis centred around 900 keV and the other corresponding to particles farer from the plasma axis centred around 1.8 MeV. This second resonance becomes dominant when the fast ions temperature increases (it is already dominant for THOT=750 keV). Thus, it can be
concluded that there is a change in the type of orbits of the particles that have a stronger interaction with the mode, which cause the mode frequency to increase rapidly with the fast ions temperature and may explain the high frequency of the precessional fishbones observed experimentally.
3.3.9. Improved time–frequency visualization of chirping mode signals in tokamak plasmas using the Choi-Williams distribution
The use of auxiliary heating in tokamak plasmas produces energetic ions that can destabilize a variety of magnetohydrodynamic (MHD) modes. These instabilities may expel energetic ions from the plasma core, reducing the heating efficiency. Often, such MHD instabilities have time-varying frequencies, being referred to as “chirping modes”. The best examples are “fishbones”, which have decreasing frequency while the mode amplitude increases. Such chirping down has also been observed in JET Alfvén eigenmodes. Upward frequency chirping is less common, although sometimes observed in JET plasmas with ion cyclotron resonant heating (ICRH).
Here, it is shown an unusual class of JET low-frequency chirping modes, with toroidal mode number n = 0, which are rapidly swept upwards and downwards in the 25–40 kHz range. Similar nearly symmetric up and down chirping has recently been observed in toroidal Alfvén eigenmodes in the spherical tokamak MAST with neutral beam heating. The nonstationary character of MHD chirping modes is best seen in a time–frequency image, which can be compared with others from nonlinear theoretical models of kinetic instabilities. These models predict frequency splitting as well as frequency sweeping. The short-time Fourier transform spectrogram has been used to analyze chirping mode signals. Still, images based on the spectrogram are hindered by a trade-off between time and frequency resolution, which is particularly detrimental when nonstationarity is strong. Excellent time–frequency resolution can be achieved with the Wigner distribution, but artifacts may preclude its use for signals with multiple components. The Choi-Williams distribution allows a compromise to be made between good time–frequency resolution and an acceptable level of artifacts.
Figure 3.10 - Resonant transference of energy between the internal kink mode and an ICRH driven fast ions population with temperatures of 500 keV (solid line), 750 keV (dotted), 1 MeV (dashed) and 1.5 MeV (dashed/dotted). The observed frequency of precessional fishbones is shadowed. 0 0 20 40 60 80 100 120 Frequency (kHz) 6x10¹¹ 4x10¹¹ 2x10¹¹ HOT W ^ δ
Figure 3.11 - Upper line - Resonant transference of energy between the internal kink mode (f=50 kHz) and an ICRH driven fast ions population as function of the energy and the toroidal canonical moment for three different fast ions temperatures: 500 keV (left), 750 keV (middle) and 1000 keV (right). Lower line: Orbits of the particles with a stronger interaction with the node, for each case.
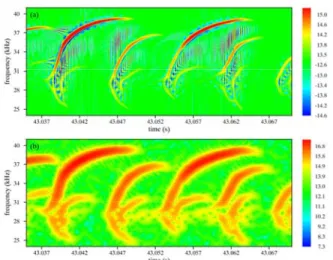
The images in Figure 3.12 are time–frequency representations of chirping modes in a JET plasma, which are observed during the initial heating phase — when ICRH is applied — of a discharge with a non-monotonic current density profile. Figure 3.12 shows that the Choi-Williams distribution does yield a sharper time–frequency picture than the spectrogram. Artifacts can be recognized in Figure 3. 12(a) by their oscillatory nature, but pose no problems reading the plot since they are separated from the signal components. In Figure 3.12(b), the spectrogram shows each burst of magnetic activity as a pair of modes that start at the same low frequency and then diverge with one mode chirping up and the other chirping down. In Figure 3.12(a) the frequency splitting in two modes is more clearly observed even at the lowest frequency.
Figure 3.12 - Time–frequency density plots of a chirping mode signal (JET pulse 54893) obtained using (a) the Choi-Williams distribution with σ = 25 and (b) the spectrogram with a 2 ms window.
3.3.10. Impurity transport studies
The classical friction in the SOL was studied as a mechanism to prevent impurities to reach the plasma core. A 2-D multispecies transport code EDGE2D/NIMBUS was used, for typical MARKIIGB divertor H-mode JET plasmas. To describe H-mode plasma we used a prescribed ad-hoc perpendicular transport coefficients of heat and particle diffusivities, and drifts were not considered. The parallel transport was determined using the 21 moments approximation of the Braginskii equations .
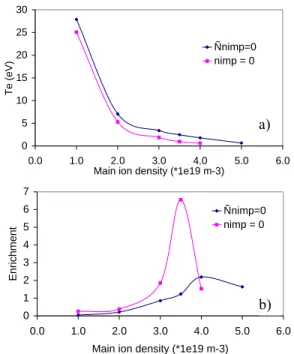
The force balance between the classical parallel friction force and the thermal force are related to Neon content inside the last closed flux surface. The higher is the friction force relatively to the thermal force the lower is the Neon content in the core before the plasma detachment. This study was done for four different main gas inlet positions: top of the vessel, divertor region, inner mid plane and outer mid plane. We found that Neon exhaust is better for the latter case. This conclusion is still valid with the change of impurity boundary conditions although some differences are found: the plasmas detaches at higher densities because the electron temperature at the inner divertor is higher and the Neon enrichment factor is lower because the system allows more impurities inside the last closed flux surface for the steady state boundary condition,∇nz(ψmin) = 0, than for
the external impurity puff nz(ψmin) = 0 (Figure 3.13).
The Neon core content is lower and the enrichment factor is higher for the simulations with Neon and Carbon than with Neon only but for main ion densities at the plasma detachment. The main influence of Carbon on Neon is the plasma detachment onset happens at lower main ion densities. There is no clear increase of the friction force between Carbon and Neon. The sum of
friction and the thermal forces is lower and closer to zero at onset of plasma detachment making the Neon to be mainly confined in the divertor region in such plasma.
0 5 10 15 20 25 30 0.0 1.0 2.0 3.0 4.0 5.0 6.0 Main ion density (*1e19 m-3)
Te (e V ) Ñnimp=0 nimp = 0 0 1 2 3 4 5 6 7 0.0 1.0 2.0 3.0 4.0 5.0 6.0 Main ion density (*1e19 m-3)
Enri
chm
ent
Ñnimp=0 nimp = 0
Figure 3.13 - a) Electron temperature at the inner divertor and b) Neon enrichment factor for the two boundary conditions at the last closed flux surface.
A reduction of the core carbon content and a drop of the C2+ spectral line intensity in the divertor region were
observed in high density seeded impurity JET plasmas after the introduction of the extrinsic impurity . We found the same effects in our simulations with Carbon and with Carbon and Neon of the experiments when we compare the modelling results for the same main ion densities. However these effects are also observed in a pure Carbon simulation but at higher main ion densities, (Figure 3.14). We can conclude that the extrinsic impurity plays an indirect role on the Carbon redistribution and it is the electron temperature in the divertor region that is the main factor. Namely it is the reduction of the electron temperature that leads to and increase in the friction force relatively to the thermal force. As the plasma approaches detachment the electron temperature becomes so low that the efficiency of the carbon chemical sputtering goes down reducing the C2+
spectral line intensity in the divertor region (Figure 3.15). 3.3.11. Exploitation of the microwave reflectometry systems7
(i) Characterisation of Alfvén Cascades (ACs) in advanced plasma regimes
The excitation and observation of Alfvén Cascades are now used to diagnose advanced plasma scenarios with
0 1 2 3 4 5 6 7 8 9 10 0.0 1.0 2.0 3.0 4.0 5.0 Main Ion Density (*1e19 m-3)
Flux f rom div e rt or (* 1e21 s -1 ) C C+Ne 0.0 0.5 1.0 1.5 2.0 2.5 3.0 0 1 2 3 4 5
Main Ion Density (*1e19 m-3)
C Cor e Con te n t/ D c ont ent (% ) C C+Ne
Figure 3.14 - a) Carbon source at the divertor and b) carbon content inside the last closed flux surface / deuterium content, for the simulations with carbon (c) only and with carbon + Neon (c+Ne). 0 10 20 30 40 50 60 70 80 6 6.5 7 7.5 8 8.5 Poloidal position (m) Te (e V) C Ne+C
Figure 3.15 – Electron temperature along a poloidal field line 1 cm outside the last closed flux surface, in the SOL of the inner divertor for simulations with C and Ne+C.
Internal Transport Barriers (ITBs). In addition to the determination of the reversed magnetic shear, the time evolution of the safety factor minimum qmin(t) can be
inferred from the time evolution of the Alfvén Cascade frequency. A good determination of qmin(t) is crucial for
the development of such scenarios on JET since the ITBs are usually triggered at low order rational magnetic surfaces corresponding to qmin(t). The JET O-mode
multi-channel reflectometer (KG3 diagnostic) used in the interferometry regime allows routine measurement of Alfvén Cascades with high frequency and time resolution. In addition, the level of density fluctuations induced by an Alfvén Cascade can be inferred from the phase perturbations of the reflectometry signal. This only requires an assumption on the shape of the density fluctuations, which can be obtained from an equilibrium a)
b)
a)
b)
reconstruction and MISHKA-H and NOVA-K computations. The level of density fluctuations is then estimated by matching the phase perturbations evaluated experimentally (Figure 3.16) and those computed by WKB simulations.
(ii) Turbulence studies
H-mode access at very low plasma density has been studied on JET, providing valuable information on the physics of the edge transport barrier formation . In particular, a significant reduction of the turbulence level was observed after the L-H transition (Figure 3.17). This is exemplified on the figure below, which displays a clear reduction of the fluctuations of the reflectometer signal reflected in the edge plasma region.
Figure 3.16 - Fluctuations of the reflectometry homodyne signal, of its amplitude and of its phase induced by the presence of an Alfvén cascade
Figure 3.17 - Reduction of plasma turbulence at the L-H transition observed from a O-mode reflectometry signal at fixed frequency 34.1 GHz. From upper to lower parts: Raw reflected signal (b) Radial position of the cut-off layer (c) Averaged level of the reflected signal fluctuations (d) Spectrogram (sliding FFT) of the reflected signal
3.3.12. Turbulence experiments in reversed and standard-B field configurations in the JET tokamak In 2005 it was performed the analysis of the data collected by the fast reciprocating Langmuir probe system in the plasma boundary region during the campaigns of 2003/2004 with the aim to compare plasma turbulence in normal and reversed field configurations. Basic turbulence properties (e.g. level of fluctuations, ExB turbulent transport) are comparable in normal and reversed field configurations. It was observed that the SOL turbulence is less intermittent in REV-B discharges.
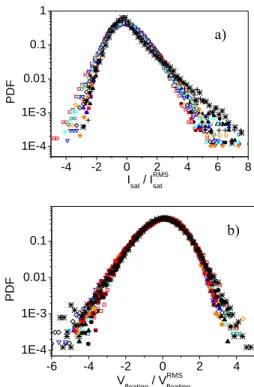
The normalized Probability Distribution Function (PDF) shows that the distributions of fluctuations in the ion saturation current, Is and the floating potential, Vf are
very similar in both magnetic field directions (Figure 3.18). It should also be noted that the PDF’s were obtained at different radial positions. Some differences in PDF shape are observed for the measurements from the far SOL (star points).
The normalized PDFs of the turbulent flux are also remarkably similar (Figure 3.19). A reduction of the intermittence is observed in REV-B discharges (closed symbols) being this reduction more pronounced in inward intermittent flux events (ΓExB < -5 <ΓExB>, negative tail of
the curve). This small difference is not reflected in the turbulent flux profiles because the contribution from intermittent events to the total flux is small.
-4 -2 0 2 4 6 8 1E-4 1E-3 0.01 0.1 1 PD F Isat / IRMSsat -6 -4 -2 0 2 4 1E-4 1E-3 0.01 0.1 PDF V floating / V RMS floating
Figure 3.18 - Probability Distribution function of Is (a)) and Vf
(b)) normalized to the level of fluctuations a)
-20 -10 0 10 20 30 10-4 10-3 10-2 10-1 100 PDF ΓExB / <ΓExB>
Forward B, old probe Forward B, new probe Reversed B, new probe
-20 -10 0 10-4 10-3 10-2 PDF ΓExB / <ΓExB> -20 -10 0 10 20 30 10-4 10-3 10-2 10-1 100 PDF ΓExB / <ΓExB>
Forward B, old probe Forward B, new probe Reversed B, new probe
-20 -10 0 10-4 10-3 10-2 PDF ΓExB / <ΓExB>
Figure 3.19 - a) PDF of the turbulent ExB flux. b) A detail of the tail of the distribution shows a reduction in the inward intermittent events for the reversed field discharges.
3.3.13. Analysis of generation and loss mechanisms of runaway electrons
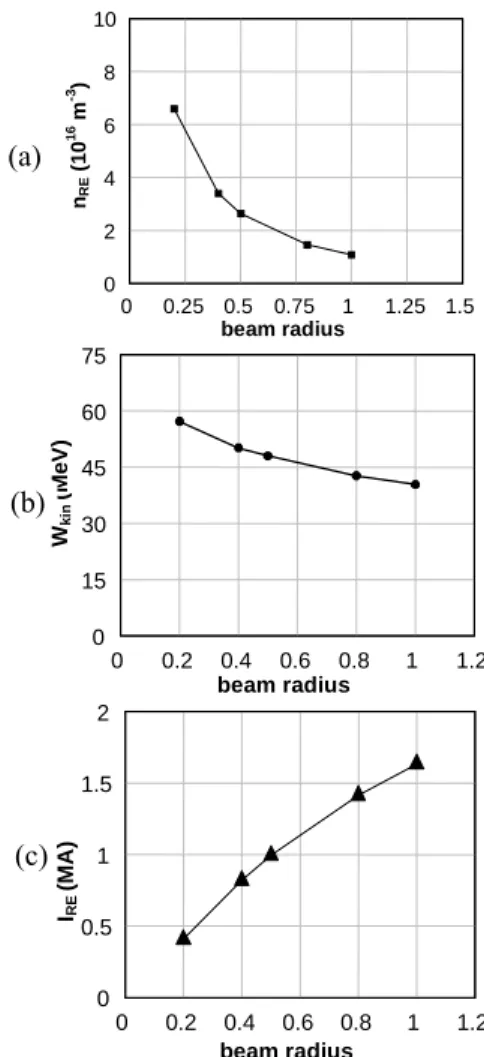
A comprehensive understanding of the trends of disruption-generated runaway electrons (REs) is needed to avoid their detrimental consequences on the materials of the plasma facing components (PFC) and vacuum chamber in large tokamaks and ITER. Comparison of experimental results and numerical modeling has allowed further contribution into development of the model for generation of runaway electrons during disruptions. Numerical modelling has been carried out in frame of a test particle model taking into account the evolution of the runaway beam geometry, which has been observed in experiments using soft-X diagnostics. A detailed scan on RE beam size shows that calculated current conversion efficiency can exceed the upper bound of the experimental values if the RE beam will occupy the whole plasma cross-section despite a significant decrease of the RE density (Figure 3.20 (a,b,c)). At some combinations of the disruption parameters the current conversion rate can achieve 100%, which never has been observed in experiments. Similar trends have been also predicted by other studies, where under certain conditions practically all the initial plasma current can be converted into runaways.
Several mechanisms are considered as possible reasons for the observed in experiments a 60% upper bound for the current conversion rate:
(i) REs are sensitive to magnetic fluctuations, which decrease the characteristic life-time of the runaways: τRE=apl/5.8Dr, where Dr≈ πqR0c(br/B0)2 is the coefficient of
the radial diffusion caused by the presence of magnetic field perturbations with the magnitude br. Very large magnetic
perturbations lead to the enhanced losses of fast particles and limit the energy and total amount of REs at the early stage of disruptions. However, with the increase of kinetic energy (Wkin) REs become less sensitive to the magnetic
turbulence.
(ii) Another loss mechanism can be understood from the analysis of the runaway orbit outward drift as the RE energy increases: dr=c/ωce (q/P||)(P||2+ P⊥2/2). From this expression
one can obtain a condition for the energy of runaway electron, at which it will escape outside the confining region
created after disruption: P⊥2=2(dr/q*ωce/c*P||-P||2) (Figure
3.21 (a)). So, that even under conditions of the perfect confinement the runaway electrons can produce intense photo-neutron emission interacting with PFC due to outward shift of the runaway orbit at certain values of the REs energy (Figure 3.21 (b)).
beam radius nRE (1 0 16 m -3) 0 0.25 0.5 0.75 1 1.25 1.5 0 2 4 6 8 10 beam radius W ki n (Me V ) 0 0.2 0.4 0.6 0.8 1 1.2 0 15 30 45 60 75 beam radius IRE (M A ) 0 0.2 0.4 0.6 0.8 1 1.2 0 0.5 1 1.5 2
Figure 3.20 - Dependence of the calculated RE density (a), maximal kinetic energy (b), and RE currents vs. dimensionless runaway beam radius.
(a)
(b)
0 30 60 90 120 P|| 0 30 60 90 P⊥2 q=3 q=2 q=4 0 50 100 150 200 0 4 8 12 16 20 P⊥2 b/a=0.2 b/a=0.4 b/a=0.5 b/a=0.8 b/a= 1 P|| q=4 q=3 q=2
Figure 3.21 - (a) - Trajectories of the test electron in a momentum space at which its orbit outward shift becomes equal to the minor plasma radius (dr=a, for a=1 m) at different values of safety
factor: q=2,q=3 and q=4. (b) - Evolution of the test runaway electron at different values of dimensionless runaway beam radius. Conditions for complete runaway electron diffusion from the confining region are presented by curves calculated at values q=2,3 and 4.
3.4. ENHANCEMENTS 3.4.1. Introduction
The Association EURATOM/IST has been in charge with the following tasks carried out in the frame of the JET Enhanced Performance Project:
• Mw access – Project management and implementation; • Development of a new fast sweep frequency
reflectometer;
• TOFOR – Project design and procurement activities; • Collaboration in the commissioning of TOFOR and
MPRu;
• RTP – Development of a real-time test facility; • PCU-VS – design of the PCU vertical stabilization; • DPDT4 – Real-time measurement & control diagnostics
& infrastructure project; • Fast wave reflectometer.
3.4.2. Millimeter wave access (EFDA/01-625)
The installation of both in-vessel and ex-vessel hardware, namely antennas and waveguides for both reflectometry and ECE, was completed. A quasi optical coupling arrangement to couple five different systems into a waveguide was developed. Calibration of the existing correlation
reflectometrs to the expected performance within the new
waveguides was done.
Tests were performed, first with a mirror in-vessel and later with plasma.
Figure 3.22 shows that significant improvements of the S/N ratio for the KG8b reflectometer signals have been reached. The increase of the raw signal amplitude by a factor of 50 suggests an improvement of at least 17 dB and a clear dynamic can now be observed on the signal spectrum.
Figure 3.22 - Raw signal and corresponding spectrum from the KG8b 103 GHz channel before (on the left) and after (on the right) the installation of the new MWA
3.4.3. Development of a new fast swept frequency reflectometer (KG8a diagnostic).
A new fast swept-frequency heterodyne reflectometer (KG8a diagnostic) dedicated to density profile measurement is being developed and should be operational for the next JET experimental campaigns in 2006. Providing routine measurement of the edge density profile with high spatial (< 1 cm) and temporal (< 30-50 µs) resolution, this diagnostic will be of the greatest importance for the pedestal studies on JET. In addition to the development of the routine for density profile inversion, some theoretical studies were carried out in order to estimate the spatial resolution of these measurements. The influence of the misalignment between the plasma magnetic axis and the probed region was especially assessed. As depicted in the figure below, a spatial resolution better than 1 cm is expected from the KG8a measurements in a large majority of the JET discharges.
3.4.4. TOFOR – Project design and procurement activities8
Five time digitizer boards (TDB) were assembled and delivered to JET after successfully tested at the Uppsala University. Since the TDB power needs require that no more than three boards coexist in the same computer, the
control software was modified for three plus two boards
in two computers, with an implementation of a TCP
8 Work carried out in collaboration with the Swedish Euratom Association
based synchronism server and a client. Better synchronization links were tested and found operative for the required length. Integration of the boards in the diagnostics was performed by the VR Association in close collaboration with IST/CFN.
Figure 3.23 - Estimation of the spatial resolution of the KG8a reflectometer diagnostic as a function of the misalignment between the plasma and the reflectometry antenna mid-planes
3.4.5. RTP – Development of a real-time test facility The complete unit providing 32 waveform generator (WG)
plus 8 transient recorder channels was assembled.
Requirements compliance tests were performed at IST/CFN. Integration to CODAS and functional tests were performed at JET by the IST/CFN staff with success. Minor accuracy corrections on the WG outputs and additional software features allowing local unit control were incorporated. Software and hardware manuals have been finished.
3.4.6. PCU-VS – Design of the PCU vertical stabilization The implementation of a new vertical stabilization controller will require the increment of the number of input signals to over 50, while maintaining the control loop delay under 50 µs, and aiming to reducing it to fewer than 10 µs. The design of an ATCA-based hardware platform (Figure 3.24) for the
low-latency controller was proposed aiming at:
• Reducing the delays on the acquisition/generator endpoints and data interconnect links;
• Providing high processing power near the acquisition/generator endpoints and on the system controller;
• Providing the synchronism of all digitizer/generator endpoints;
• Having an architecture designed for maintainability, upgradeability and scalability;
• Targeting the specificities of the VS controller including low cost per channel;
• Decreasing risks during implementation and testing.
Figure 3.24 - Vertical stabilization controller
3.4.7. DPDT4 – Real-time measurement & control diagnostics & infrastructure project
The essential aim of this project is to expand JET real-time diagnostics and control capabilities required to fulfil the programme objectives of JET in the proposed FP7 phase of operation dedicated to ITER preparation. In particular the objective is to optimize the control of the plasma during operation and to enable control schemes for the main plasma scenarios and in particular profile control. In response to the call for participation in the diagnostic enhancements, Associations IST, CEA and UKAEA declared interest in the project. IST offered to lead the project and proposed the workgroup organization chart of Figure 3.25.
3.5. Management
The Association EURATOM/IST has collaborated on the management of the use of the JET facilities by the EFDA Associates in the following manner:
• Dr. Duarte Borba, as Head of Office for the EFDA Associate Leader for JET,
• Dr. Bruno Gonçalves as a member of the staff of the Close Support Unit to the EFDA Associate Leader for JET;
• Prof. Horácio Fernandes and Dr. Paulo Varela as members of the Remote Participation Users Group.
Figure 3.25 – Organization of the DPDT4 project
EDFA PROJECT BOARD ________ Project Sponsor Bernardo Carvalho Project Leader Robert Felton Co-Project Leader FIR Interferometer Project Manager Neutron Diagnostics Project Manager Emmanuel Joffrin FE Bremstrahlung Project Manager J. Sousa Network Infrastructure Project Manager RT Analysis Project Manager Optics design Mechanic Electronics Data Acquisition IST CEA UKAEA/JOC Associations Involved
Data Acquisition Data Acquisition LH deposition profile codes q-profile analysis Test Methodology Evaluation Network JET OPERATOR Drawing Office Quality Assurance Installation & Commissioning Manager UKAEA
4. PARTICIPATION IN THE ASDEX UPGRADE PROGRAMME1
M.E. Manso (Head), F. Serra (Deputy Head), A. Combo, A. Ferreira, A. Silva, D. Borba, F. Salzedas, F. Silva, I. Nunes, J. Santos, L. Cupido, L. Fattorini, L. Guimarãis, L. Meneses, P. Varela, R. Coelho, S. Hacquin, S. Graça, T. Ribeiro
1Work carried out in collaboration with the ASDEX-Upgrade Team. Contact Person: Dr. G. Conway.
4.1. INTRODUCTION
The Portuguese participation in the ASDEX Upgrade2
(AUG) programme has been mainly focused in two research lines:
• Microwave reflectometry; • MHD, turbulence and transport.
4.2. MICROWAVE REFLECTOMETRY 4.2.1. Introduction
This research line included in 2005 activities on microwave systems and electronics, control and data acquisition, diagnostic developments, data processing, modelling and plasma physics studies.
Concerning microwave systems and electronics, the V band LFS channel was tested and electronics had to be modified for homodyne detection due to the degradation of the mixer. After its repair it was changed back again to heterodyne. The main control switch board of the system was calibrated and a faulty optical coupler was replaced. The pig-back of the optical analogue signal transmitters was changed. V band/X-mode channel was tested and changed from heterodyne to homodyne detection. All the diagnostic channels were inspected and tested. Part of the transmission line of the Q/X-mode channel was disassembled, tested and calibrated after high losses that were found to be caused by metal peaces of soldering material inside one of the waveguides. The V/X-mode antenna was modified to correct a construction error. A new transmission line for the HFS channels is being studied in order to protect the diagnostic in AUG forthcoming experiments with increased ECRH power.
Regarding control and data acquisition, the firmware of all of the eight control boards was upgraded to use a high level language, like the one used in the fluctuations monitor control system. This makes the communication more robust. Control software for a new “hopping” frequency system has being installed and tested. Also a new system has started to be developed.
Concerning diagnostic developments, the new hopping diagnostic was completed and first turbulence results were obtained.
Regarding data processing, a new algorithm was developed for the time-frequency analysis of broadband
signals which allows the length of the analysis window of the spectrogram to be adapted to automatically to the local time-frequency characteristics of the signals while maintaining a good time-frequency resolution. Several upgrades were also made to the interactive data analysis tools for better efficiency and less computing time.
Concerning modelling, dedicated tools were developed to simulate Doppler reflectometry. A code was developed for the analysis of turbulence and transport in the SOL.
The plasma physics studies: were focused mainly in pellet experiments as well as MHD, turbulence and transport. The studies could be extended to higher densities with the W band channel in full operation. 4.2.2. Frequency calibration
The frequency calibration system was upgraded with a delay line. The output of the detected signal resulting from interference between the non delayed and the delayed signal as well as the spikes from the frequency markers are shown in Figure 4.1. The interference data was used to obtain a continuous the frequency versus time characteristics of the oscillators in ultrafast swept operation.
The instantaneous phase evolution of the signal shown in Figure 4.1a is obtained with an Hilbert Transform and the resulting frequency step is depicted in Figure 4.1b. The spectrogram of a signal reflected from a metallic mirror obtained with the frequency marker calibration shows significant deviations from a constant value corresponding to the distance between the antenna and the mirror (Figure 4.2a), whereas in the case of the delay line calibration an almost constant time delay is recovered (Figure 4.2b). The novel method greatly improved the accuracy of density profiles.
4.2.3. Control and data acquisition
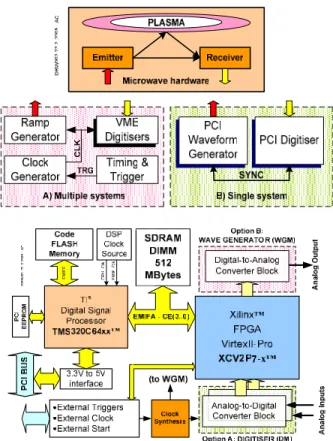
In order to exploit full diagnostic capabilities of the ASDEX Upgrade tokamak it is mandatory to upgrade the data acquisition and control system. This will cope with faster frequency sweep times and improved time resolution as well as accuracy allowing, for example, plasma position and shape measurements for control purposes, as it is foreseen for ITER. A new PCI-based
0 2 4 6 8 10 12 14 16 18 20 22 24 26 -0.1 0.0 0.1 0.2 0.3 0.4 (c) Ma rk e rs [ V ] t [µs] -0.4 -0.3 -0.2 -0.1 0.0 0.1 In te rf er e n c e [V ] (a) 0 10 20 30 40 50 (b) ∆ F [ M H z]
Figure 4.1 - a) Interference signal. b) Frequency step from the interference signal. c) Frequency markers signal.
Figure 4.2– Spectrogram of a signal reflected from a metallic mirror: a) frequency marker calibration and b) delay line calibration.
system (Figure 4.3) is being developed based on a digitizer card with 2 channels, 12-bit resolution and a waveform generator with one channel, 14-bit resolution. Both cards will have 512 Mbytes of memory, a Digital Signal Processor (DSP) for advanced processing modes and a Field Programmable Gate Array (FPGA) for real-time algorithms and complex trigger managing modes. The system will be able to support multiple cards (digitisers and signal generators) operating synchronously at a maximum
speed of 210 MHz. The development of the fast digitizers and generators was started with the schematic and layout design of the PCI cards
.
4.2.4. Numerical studies for plasma position
The sensitivity and robustness of reflectometry to track plasma movements in a steady state ELMy H-mode scenario was studied aiming to fully demonstrate the use of reflectometry for control purposes as foreseen for ITER. Position curves after ELM removal were averaged using a window of 3 measurements or 26 ms, roughly equivalent to averaging three ITER individual measurements (at a 10 ms rate). To compensate the errors in the profile inversion due to the non probed plasma region with O-mode reflectometry, a dynamic initialization procedure was developed.
Figure 4.3 - Current (A), new (B) data acquisition system and PCI module diagram.
To track the separatrix position from reflectometry profiles two estimations for the density at the separatrix were used one from diagnostic XPTO and multiplying the average density by a factor α (with α Є [0.15, 0.65]). Position results obtained using the dynamic estimation for the ratio between the separatrix density and the average density after removing measurements performed during ELMs, were impressively good (Figure 4.4). In this case, shot #19701, the tracking of the separatrix position using