Comparing surface measurement of black carbon and columnar
AERONET inferred contents during the “El Arenosillo 2004 summer
campaign”
Comparativa de las medidas de superfície de black carbon con los valores
columnares deducidos de AERONET durante la campaña de verano “El
Arenosillo 2004”
S. Mogo
(*,1,2,S), V. Cachorro
(2,S), A. de Frutos
(2,S), J. de la Rosa
(3), M. Sorribas
(4)1. Universidade da Beira Interior, Dep. de Física, Covilhã, Portugal. 2. Grupo de Óptica Atmosférica, Universidad de Valladolid, España.
3. Departamento de Geologia, Universidad de Huelva, España. 4. Instituto Nacional de Técnica Aeroespacial, Mazagón, España. (*)
Email: [email protected] S: miembro de SEDOPTICA / SEDOPTICA member
Recibido / Received: 22/12/2009. Versión revisada / revised versión: 03/02/2010. Aceptado / Accepted: 04/02/2010
ABSTRACT:
During the summer of 2004 a field campaign was carried out at the El Arenosillo Atmospheric Sounding Station (ESAt), near Huelva, South-Western Spain. The campaign was designed to obtain experimental data on aerosol in situ absorption, size distribution, chemical composition, and columnar optical properties but this paper deals only with the evaluation of the absorbent aerosol. A Dekati cascade impactor and a PM10 Graseby-Andersen high volume sampler were used to collect aerosol fractions over filters. In this paper an estimation is made for the concentration of black carbon at ground level, using the absorption coefficients obtained from a filter transmission method. The values obtained are highly variable and range from 31 ng m-3 to 770 ng m-3. The high volume sampler filters were analyzed for elemental carbon with a thermal-optical method (LECO). The black carbon concentration is also compared with the columnar level retrieved from aerosol absorption optical depth derived from inversion of a sun-photometer data inside the AERONET framework.
Key words: Black Carbon, Absorption, AERONET. RESUMEN:
Durante el verano de 2004 se realizó una campaña de medida de aerosoles en la Estación de Sondeos Atmosféricos de El Arenosillo (ESAt), cerca de Huelva, sudoeste de España. La campaña estuvo destinada a la obtención de datos in situ de absorción, distribución de tamaños, composición química y propiedades ópticas de columna de los aerosoles pero el presente trabajo está dedicado solamente al estudio de los aerosoles de tipo absorbente. Se utilizaron para recoger las partículas de diferentes fracciones en filtros, un impactador de cascada Dekati y un impactador de alto volumen Graseby-Andersen PM10. En este trabajo se presenta una estimación de la concentración de black carbon a nivel de suelo, partiendo de los valores de los coeficientes de absorción obtenidos con un método basado en la transmisión de la luz por filtros con aerosoles depositados. Los valores obtenidos, altamente variables, están en el rango 31 ng m-3-770 ng m-3. Los filtros del impactador de alto volumen se han analizado con un método termo-óptico (LECO) para la obtención de la fracción de carbono elemental. Para terminar, la concentración de black
carbon se comparó con los niveles columnares obtenidos a partir del espesor óptico de absorción
de aerosoles derivado de la inversión de los datos de un fotometro solar de la red AERONET Palabras clave: Black Carbon, Absorción, AERONET.
REFERENCES AND LINKS
[1] J. Haywood, O. Boucher, “Estimates of direct and indirect radiative forcing due to tropospheric aerosols: a review”, Rev. Geophys. 38, 513-543 (2000).
[2] D. Roberts, A. Jones, “Climate sensitivity to black carbon aerosol from fossil fuel combustion”, J.
Geophys. Res. 109, D16202 (2004).
[3] J. Hansen, L. Nazarenko, “Soot climate forcing via snow and ice albedos”, Proc. Nat. Acad. Sci. USA 101, 423-428 (2004).
[4] C. Toledano, V. Cachorro, A. Berjón, A. de Frutos, M. Sorribas, B de la Morena, P. Goloub, “Aerosol optical depth and Ångström exponent climatology at El Arenosillo AERONET site (Huelva, Spain)”,
Quart. J. Roy. Meteorol. Soc. 133, 795-807 (2007).
[5] N. Prats, V. Cachorro, M. Sorribas, S. Mogo, A. Berjón, C. Toledano, A. de Frutos, J. de la Rosa, N. Laulainen, B. de la Morena, “Columnar aerosol optical properties during ``El Arenosillo 2004 summer campaign''”, Atmos. Environ. 42, 2643-2653 (2008).
[6] S. Mogo, V. Cachorro, M. Sorribas, A. de Frutos, R. Fernández, “Measurements of continuous spectra of atmospheric absorption coefficients from UV to NIR via optical method”, Geophys. Res. Lett. 32, L13811 (2005).
[7] R. Hitzenberger, U. Dusek, A. Berner, “Black carbon measurements using an integrating sphere”, J.
Geophys. Res. 101, 19,601-19,606 (1996).
[8] C. Chou, T.-K. Chen, S.-H. Huang, S. Liu, “Radiative absorption capability of Asian dust with black carbon contamination”, Geophys. Res. Lett. 30, 1616 (2003).
[9] C. Chou, W.-N. Chen, S.-Y. Chang, T.-K. Chen, S.-H. Huang, “Specific absorption cross-section and elemental carbon content of urban aerosols” Geophys. Res. Lett. 32, L21808 (2005).
[10] T. Bond, T. Anderson, D. Campbell, “Calibration and intercomparison of filter-based measurements of visible light absorption by aerosols”, Aerosol Sci. Technol. 30, 582-600 (1999).
[11] G. Schuster, O. Dubovik, B. Holben, E. Clothiaux, “Inferring black carbon content and specific absorption from Aerosol Robotic Network (AERONET) aerosol retrievals”, J. Geophys. Res. 110, D10S17 (2005). [12] O. Dubovik, M. King, “A flexible inversion algorithm for retrieval of aerosol optical properties from Sun
and sky radiance measurements”. J. Geophys. Res. 105, 20,673-20,696 (2000).
[13] O. Dubovik, B. Holben, T. Eck, A. Smirnov, Y. Kaufman, M. King, D. Tanré, I. Slutsker, “Variability of absorption and optical properties of key aerosol types observed in worldwide locations”, J. Atmos. Sci. 59, 590-608 (2002).
[14] C.-H. Jeong, P. Hopke, E. Kim, D.-W. Lee, “The comparison between thermal-optical transmittance elemental carbon and Aethalometer black carbon measured at multiple monitoring sites”, Atmos. Environ. 38, 5193-5204 (2004).
[15] S. Decesari, M. Facchini, E. Matta, F. Lettini, M. Mircea, S. Fuzzi, E. Tagliavini, J.-P. Putaud, “Chemical features and seasonal variation of fine aerosol water-soluble organic compounds in the Po Valley, Italy”,
Atmos. Environ. 35, 3691-3699 (2001).
[16] P. Quinn, T. Bates, “Regional aerosol properties: Comparisons of boundary layer measurements from ACE 1, ACE 2, Aerosols99, INDOEX, ACE Asia, TARFOX, and NEAQS”, J. Geophys. Res. 110, D14202 (2005).
[17] C. Hueglin, R. Gehrig, U. Baltensperger, M. Gysel, C. Monn, H. Vonmont, “Chemical characterisation of PM2.5, PM10 and coarse particles at urban, near-city and rural sites in Switzerland”, Atmos. Environ. 39, 637-651 (2005).
[18] G. Allen, J. Lawrence, P. Koutrakis, “Field validation of a semi-continuous method for aerosol black carbon (aethalometer) and temporal patterns of summertime hourly black carbon measurements in southwestern PA”, Atmos. Environ. 33, 817-823 (1999).
[19] S. Tripathi, S. Dey, V. Tare, “Aerosol black carbon radiative forcing at an industrial city in northern India”,
Geophys. Res. Lett. 32, L08802 (2005).
[20] M. Viana, X. Chi, W. Maenhaut, X. Querol, A. Alastuey, P. Mikuška, Z. Večeřa, “Organic and elemental carbon concentrations in carbonaceous aerosols during summer and winter sampling campaigns in Barcelona, Spain”, Atmos. Environ. 40, 2180-2193 (2006).
[21] E. Sumanth, K. Mallikarjuna, J. Stephen, M. Moole, V. Vinoj, S. Satheest, K. Moorthy, “Measurements of aerosol optical depths and black carbon over Bay of Bengal during post-monsoon season”, Geophys. Res.
Lett. 31, L16115 (2004).
[22] S. Babu, S. Satheesh, K. Moorthy, “Aerosol radiative forcing due to enhanced black carbon at an urban site in India”, Geophys. Res. Lett. 29, 1880 (2002).
[23] B. Bodhaine, J. Harris, J. Ogren, D. Hofmann, “Aerosol optical properties at Mauna Loa Observatory: Long-range transport from Kuwait?”, Geophys. Res. Lett. 19, 581-584 (1992).
[24] C. Liousse, H. Cachier, S. Jennings, “Optical and thermal measurements of black carbon content in different environments: variation of specific attenuation cross-section”, Atmos. Environ. A27, 1203-1211 (1993).
[25] J. Martins, P. Hobbs, R. Weiss, P. Artaxo, “Sphericity and morphology of smoke particles from biomass burning in Brazil”, J. Geophys. Res. 103, 32,051-32,067 (1998).
[26] G. Schuster, Inferring the Specific Absorption and Concentration of Black Carbon from AERONET Aerosol
Retrievals”, Ph.D. Thesis, Pennsylvania State University (2004).
1. Introduction
The aerosols suspended in the atmosphere have a significant impact on the radiation received at the Earth's surface. They can influence climate directly by scattering and absorbing solar radiation. In models, the net effect of such aerosols is one of the larger uncertainties [1]. Ongoing research seeks to understand the UV-visible absorption characteristics of aerosols. The presence of absorbing aerosols such as black carbon (BC) can change the sign of radiative forcing from negative to positive [2,3]. But the impact of BC on forcing and hence on climate, though well recognized, is still uncertain due to the lack of a comprehensive database.
During the 2004 summer an extensive campaign of aerosol measurements was carried out at the Atmospheric Sounding Station “ESAt – El Arenosillo”, (37.10ºN, 6.70ºW). This station belongs to the National Institute of Aerospacial Technology (INTA) and is located in the south of the Iberian Peninsula. This is a non-urban station located in the neighborhood of a nature-protected area, the national park of Doñana; 30 km from the city of Huelva (~160 000 inhabitants), Spain. The proximity of Huelva, with a strong industrial belt, represents the main source of anthropogenic aerosol. An important feature of this station is its proximity to the sea and to North Africa, allowing the study of several aerosol types [4]. Concerning this aspect it is interesting to note that during the campaign several Saharan outbreaks were detected [5]. Details of the station and the experimental setup have been described elsewhere [6].
The campaign was devoted mainly to the absorbing properties (columnar and surface) linked with size distribution and chemical composition of atmospheric aerosols. Extensive measurements of particulate matter (PM) and BC amounts were carried out, which were performed for the first time at this area. The routine atmospheric measurements performed in this station include that of a sun-photometer for columnar aerosol properties, as part of the Aerosol Robotic Network (AERONET). Routine in situ aerosol measurements for numerical particle aerosol distribution are also carried out with two spectrometers, a Scanning Mobility Particle Sizer (SMPS-TSI) for the submicrometer size range and an Aerodynamic Particle Sizer (APS-TSI) for micrometer range.
The aerosol filter samples were collected from July 15th to October 15th, 2004. The columnar aerosol measurements were conducted with routine data from the ESAt’s Cimel sun-photometer. The sun-photometer data provided not only the aerosol optical depth at various wavelengths but also the subsequent products given by the inversion algorithm of AERONET.
2. Experimental methods
A Dekati PM10 cascade impactor was installed in the station and the filters were weighed for 3 particulate matter size fractions, PM1, PM2.5 and PM10. The aerosols for optical analysis were collected over Millipore polycarbonate membrane filters with 0.2 µm pores using the Dekati impactor with a constant flow rate of 16.5 l min-1. The measuring protocol included daily collection of
aerosols except for the weekends where collection was for 72 h. The filters were weighed before and after collection and care was taken in order to eliminate electrostatic charges from the filters before weighing.
The PM1 filters were then analyzed by an optical method, in order to obtain the absorption coefficients of the aerosols from 320 to 800 nm. This spectral information allows the determination of the absorption alpha parameter in different spectral ranges [6]. For determination of the absorption coefficients we used an integrating sphere photometer. The exposed filters were dissolved in chloroform and the solution was placed in a quartz cell located in the center of the integrating sphere [6,7]. The dissolution of the polycarbonate filter leaves the aerosol particles in suspension. A stable suspension of the aerosols was obtained using ultrasound. To minimize errors due to the differences between filters, the light transmission coefficient through the blank filter was evaluated as the average of 20 blank filters.
The absorption coefficients, σa, of the aerosol samples were evaluated by measuring the apparent transmission of the light source beams through the quartz cell. Assuming that the attenuation of light through the sample follows the Beer-Lambert law, the σa can be calculated from the measurements:
( )
λ =( )
λ[
− ⋅σa( )
λ]
f I x
I 0 exp , (1)
where If(λ) and I0(λ) denote the intensities of light passing through the quartz cell with a sampling filter dissolved and with a blank filter dissolved, respectively, for each wavelength; x is the optical path length calculated from the volume of the sampled air and the collection area of the filter.
By assuming that BC is the sole light-absorbing component of submicrometric particulate matter, PM1, mass specific absorption cross-section of BC is defined by Ba( )BC
( )
λ =σa( )
λ ⋅CBC−1, where CBC is the mass concentration of BC [8,9]. This assumption can lead to an overestimation ofBa(BC)(λ), particularly during desert outbreaks, because some mineral absorbing particles can be present. However, mineral particles are present, mainly in the coarse fraction of PM and the absorption coefficient of BC is substantially higher than other species at the wavelengths considered.
The system has been calibrated with known amounts of Nigrosin, a commercially available
black pigment. The Nigrosin mass specific absorption cross-section determined by [10] is
Ba(Nigrosin)= 3 m-2g-1. This allows the study of the behavior of the photometer for high amounts of BC. The mass calibration curve of the integrating sphere photometer shows that the system response is highly nonlinear for large amounts of soot. The change from the linear part of the calibration curve to the nonlinear part defines the upper limit of detection in 1 g for each measurement. This means an upper limit of detection of 42 mg m-3 for the 24 h samples and 14 mg m-3 for the 72 h samples. For values above this, the system becomes saturated and the response is nonlinear. Even in polluted atmospheres the values are in the range of a few µg, that is, within the range of linear response of the system.
The BC concentration in the atmospheric column can be deduced from the aerosol absorption optical depth by choosing a single value for the mass specific absorption cross-section of the atmospheric aerosol [11]: ( )
(
)
1 BC BC =τa Ba − C , (2)where CBC is the concentration of absorbing aerosol in all the atmospheric column and τa is the aerosol absorption optical depth which can be achieved by:
(
−ω)
⋅ τ =
τa 1 , (3)
where τ is the aerosol optical depth and ω is the single scattering albedo. The units of the CBC in Eq. (2) are mass per area. In this work the τa was obtained from the AERONET Cimel photometer data, after using the inversion algorithm developed by Dubovik and King [12,13]. The criteria for the selection of the Cimel data was chosen according with the time interval of the Dekati collection. We include no restriction on aerosol optical depth as accurate values can be obtained on the AERONET retrievals, even at low optical depths [26], but one must be aware that this procedure can only produce values with an expected accurancy of 30%.
In addition, PM10 sampling was performed by using a Grasseby-Andersen high-volume sampler (68 m3h-1). QF20 Schleicher and Schuell QF20S quartz glass filters were used. A sampling rate of one daily sample per week during the study period from 9th July to 25th October 2004. A total of 20 daily samples were collected using the above procedure. The mass levels of PM10 were obtained by weighting the filters with standard methods
(T=20ºC and Relative Humidity=50%). Several techniques have been used in order to characterize the chemical composition of PM10 (MS, ICP-AES, Ion Chromatography). Finally, a small circular portion (19,64 cm2) of each filter was used to determine the total carbon content by LECO methodology. “LECO” is an abbreviation for Laboratory Equipment Corporation of St. Joseph, Michigan. The levels of Cnon-mineral (or organic “OC” plus elemental carbon “EC”) were obtained by subtracting the Ccarbonate from Ctotal determinations. The LECO system was designed to determine the weight percentage of total carbon (TC), organic carbon (OC), and calcium carbonate (CaCO3) in the samples by heating them to high temperature in pure oxygen atmosphere. The TC content of the sample is determined by measuring the thermal conductivty of the gaseous products of pyrolysis of the sample. The analysis may also be conducted on an acidified sample to determine the organic carbon content. The weight percentages of TC, OC and CaCO3 are related by the equation
(TC−OC)×8.33=CaCO3 and the carbon is
determined with a precision of 5%.
3. Results and discussion
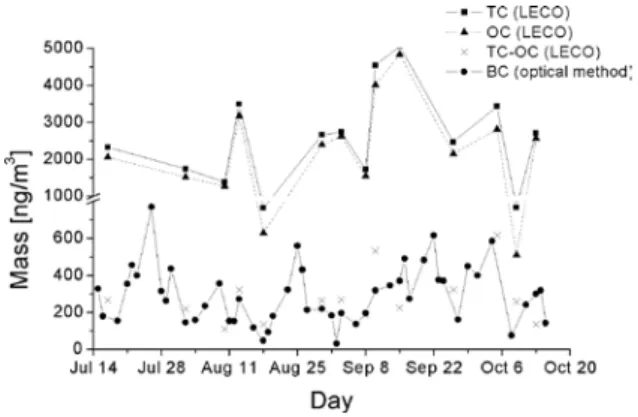
3.a. Inferred concentration of BC at surface Figure 1 illustrates the time series of the absorbent aerosol mass determined with the integrating sphere. The concentration of absorbent aerosol varies between 31 ng m-3 and 770 ng m-3, the average value is 293 ng m-3 (std=158 ng m-3). These values are not unequivocally related to black carbon mass due to two main reasons. The first is related to the fact that BC, even when it is the strongest aerosol absorbent in the range UV-NIR, it may not be the only one, as explained above. The second reason is related to the possible coagulation of fine black carbon particles with dust during transportation in dust events. Nevertheless, it can be used as a good approximation of black carbon mass whenever there is no Saharan entry. The measurements of absorbent aerosol mass determined with the integrating sphere can also be affected by the BC absorption coefficient, which can vary depending on the mixing state (external or internal), size and source of the ambient aerosol.
For selected days we have determined the carbon content of the filters collected with the PM10 high-volume sampler. This independent determination of
the carbon content was made by a thermo-optical method, the LECO system. Figure 1 shows the carbon amount determined by the LECO system together with the time series of BC determined with the integrating sphere photometer. The LECO values TC-OC represent the no-organic carbon levels, which includes the elemental carbon (EC) and the inorganic carbon (IC). We emphasize that these values do not represent exactly the same fraction as BC. While BC refers the soot component that absorb light when determined with filter transmittance based methods, the EC refers to carbon amounts determined using the pyrolysis of the sample. Both EC and BC define a similar fraction of the carbonaceous aerosol and should be comparable. However, a slight difference exists and there is no simple relationship between them. For example [14] observed differences depending on the source (sampling during a haze event or a forest fire event).
The BC obtained from the integrating sphere photometer represents on average 5.9% of the TC measured with the LECO while EC represents ~10% of the TC. A similar proportion between BC and TC has been reported by [15] in the Po Valley, Italy, during summer.
Fig. 1. Amount of absorbent aerosol determined with the integrating sphere photometer (BC) and the difference TC-OC, determined by the thermo-optical method.
For comparison we present BC or EC values reported in previous studies in other regions. [16] reported EC values of 20 ng m-3 in the sub-tropical NE Atlantic for the fine fraction, during the ACE2 in June-July 1997. In rural European locations (e.g. Chaumont) values of 400 ng m-3 have been reported and in urban zones (Bern) values of 4200 ng m-3 [17,18] have reported for a semiurban region in the USA (Uniontown) values in the range
278−3062 ng m-3
and in polluted regions of India (Kanpur) levels have reached 6-20 µg m-3
[19]. In an urban region of Spain (Barcelona) [20], reported EC levels in PM2.5 ranging from 1 to 2~ µg m-3
in summer to 1–3~ µg m-3 in winter. Comparing with our BC levels, we classify El Arenosillo as a rural/suburban station.
3.b. Aerosol absorption optical depth spectra and BC
Figure 2 shows the evolution of the surface in-situ BC mass concentration and the total optical depth, τ. A linear regression analysis of the scatter diagram of simultaneous estimates of τ and CBC yields a correlation coefficient of R=0.38 which is quite significant if we consider that τ is the aerosol absorption and scattering optical depth due to all the components in the entire column. The slope of the CBC versus τ plot is 0.26 (BC in µg m-3), comparable to the value of 0.36 presented for another region with weakly absorbing aerosols [21]. A slope of 0.024 had been presented for urban continental locations [22]. It may be noted that over urban locations larger amounts of BC are observed for similar values of τ. This implies that over that urban locations other aerosol species make a non-negligible contribution to the aerosol optical depth. More interesting than the correlation CBC versus τ is the correlation CBC versus τa, which yields
R=0.60, but this value needs to be taken with care
because the τa values are very low and frequently below the uncertainty of its determination. For this calculation, the daily average τa values at 441 nm are mostly in the range 0.0005 to 0.07 with a mean value of 0.02 (std=0.01). The value of Ba(BC) considered was 10 m2g-1, which is commonly accepted [23-25].
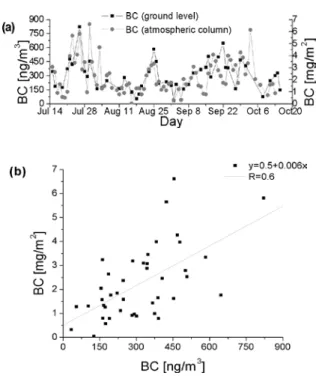
Once again, considering the BC as the only light absorbing aerosol in our spectral range, it is possible to determine its concentration in the atmospheric column using Eq. (2). The calculated values range between 0.05 mg m-2 and 6.62 mg m-2 with an average value of 2.25 mg m-2. Figure 3(a) shows the evolution of the surface and columnar BC mass concentration. A scatter diagram of surface and column values is shown in Figure 3(b). The correlation coefficient between the concentrations in the ground and in the atmospheric column is R=0.60, meaning that there is no direct linear dependence between both concentrations.
This observation may be due to BC present in the atmospheric column due to transportation from other locations and not detectable at ground level.
Fig. 2. Evolution of τ together with CBC at ground level.
Fig. 3. a) Daily averages of BC concentration in the atmospheric column [mg m-2] and at ground level [ng m−3]. (b) Correlation between the BC concentrations in the atmospheric column and at ground level.
In a previous work [26] there were presented annual average values of 1.914 mg m-2 in Europe for the year 2001 and 0.283 mg m-2 for remote Atlantic islands.
4. Summary and conclusions
A field experiment was conducted in El Arenosillo, Spain to analyze the carbonaceous composition and corresponding light absorption characteristics of aerosols sampled in non-urban locations. The average BC content in the submicrometric fraction
of PM is 293 ng m-3. Measurements have shown that ~6% of the carbon measured is BC and the remaining fraction may be secondary aerosol originating from the surrounding woods and industry. LECO values are in average higher than those obtained from the integrating sphere because they include the contribution of carbon particles higher than 1 µm, because the mixing state of the ambient aerosol might have affected the determination of the absorption coefficient and because, as we explained, the two techniques do not represent exactly the same fraction of carbon. In any case the range of values obtained by both methods is approximately the same and the
consistency among results from the independent techniques suggests that the discrepancy is not large. The strong linear correlation between BC content and aerosol absorption optical depth suggests that the aerosol absorption can be mainly attributed to the BC.
Acknowledgements
This work was supported by CYCyT (MEC) under coordinated project CGL2005-05693/CLI and VA001-C05 of the “Junta de Castilla y León”.