ACPD
12, 1299–1400, 2012Carbonaceous Aerosols and Radiative Effects
Study
R. A. Zaveri et al.
Title Page
Abstract Introduction
Conclusions References
Tables Figures
◭ ◮
◭ ◮
Back Close
Full Screen / Esc
Printer-friendly Version
Interactive Discussion
Discussion
P
a
per
|
Dis
cussion
P
a
per
|
Discussion
P
a
per
|
Discussio
n
P
a
per
|
Atmos. Chem. Phys. Discuss., 12, 1299–1400, 2012 www.atmos-chem-phys-discuss.net/12/1299/2012/ doi:10.5194/acpd-12-1299-2012
© Author(s) 2012. CC Attribution 3.0 License.
Atmospheric Chemistry and Physics Discussions
This discussion paper is/has been under review for the journal Atmospheric Chemistry and Physics (ACP). Please refer to the corresponding final paper in ACP if available.
Overview of the 2010 Carbonaceous
Aerosols and Radiative E
ff
ects Study
(CARES)
R. A. Zaveri1, W. J. Shaw1, D. J. Cziczo2, B. Schmid1, R. A. Ferrare3,
M. L. Alexander4, M. Alexandrov5,R. J. Alvarez6,W. P. Arnott7,D. B. Atkinson8,
S. Baidar9,R. M. Banta6,J. C. Barnard1,J. Beranek1, L. K. Berg1, F. Brechtel10,
W. A. Brewer6, J. F. Cahill11, B. Cairns12, C. D. Cappa13, D. Chand1, S. China14,
J. M. Comstock1, M. K. Dubey15, R. C. Easter1, M. H. Erickson16, J. D. Fast1,
C. Floerchinger17, B. A. Flowers15, E. Fortner18, J. S. Gaffney19, M. K. Gilles20,
K. Gorkowski14,W. I. Gustafson1,M. Gyawali7,J. Hair3,R. M. Hardesty6,J. W. Har-worth8, S. Herndon18, N. Hiranuma1, C. Hostetler3, J. M. Hubbe1, J. T. Jayne18,
H. Jeong21, B. T. Jobson16, E. I. Kassianov1, L. I. Kleinman22, C. Kluzek1,
B. Knighton17,K. R. Kolesar13, C. Kuang22, A. Kubatov´ a´21, A. O. Langford6,
A. Laskin4, N. Laulainen1, R. D. Marchbanks6, C. Mazzoleni14, F. Mei22,
R. C. Moffet23, D. Nelson1, M. D. Obland3, H. Oetjen9, T. B. Onasch18,
I. Ortega9, M. Ottaviani24, M. Pekour1, K. A. Prather11, J. G. Radney8,
R. R. Rogers3, S. P. Sandberg6, A. Sedlacek22, C. J. Senff6, G. Senum22,
ACPD
12, 1299–1400, 2012Carbonaceous Aerosols and Radiative Effects
Study
R. A. Zaveri et al.
Title Page
Abstract Introduction
Conclusions References
Tables Figures
◭ ◮
◭ ◮
Back Close
Full Screen / Esc
Printer-friendly Version
Interactive Discussion
Discussion
P
a
per
|
Dis
cussion
P
a
per
|
Discussion
P
a
per
|
Discussio
n
P
a
per
|
R. Subramanian26, K. Suski11, J. Tomlinson1, R. Volkamer9, H. W. Wallace16,
J. Wang22, A. M. Weickmann6, D. R. Worsnop18, X.-Y. Yu1, A. Zelenyuk27,
Q. Zhang25
1
Atmospheric Sciences & Global Change Division, Pacific Northwest National Laboratory, Richland, WA, USA
2
Massachusetts Institute of Technology, Cambridge, MA, USA 3
NASA Langley Research Center, Hampton, VA, USA 4
Environmental Molecular Sciences Laboratory, Pacific Northwest National Laboratory, Richland, WA, USA
5
Department of Applied Physics and Applied Mathematics, Columbia University, New York, NY, USA
6
Chemical Sciences Division, NOAA Earth System Research Laboratory, Boulder, CO, USA 7
University of Nevada, Reno, NV, USA 8
Portland State University, Portland, OR, USA 9
Department of Chemistry and Biochemistry, University of Colorado at Boulder, CO, USA 10
Brechtel Manufacturing, Inc, Hayward, CA, USA 11
University of California, San Diego, CA, USA 12
NASA Goddard Institute for Space Studies, New York, NY, USA 13
Department of Civil and Environmental Engineering, University of California, Davis, CA, USA 14
Atmospheric Science Program, Michigan Technological University, Houghton, MI, USA 15
Los Alamos National Laboratory, Los Alamos, NM, USA 16
Washington State University, Pullman, WA, USA 17
Montana State University, Bozeman, MT, USA 18
Aerodyne Research, Inc., Billerica, MA, USA 19
University of Arkansas, Little Rock, AR, USA 20
Lawrence Berkeley National Laboratory, Berkeley, CA, USA 21
ACPD
12, 1299–1400, 2012Carbonaceous Aerosols and Radiative Effects
Study
R. A. Zaveri et al.
Title Page
Abstract Introduction
Conclusions References
Tables Figures
◭ ◮
◭ ◮
Back Close
Full Screen / Esc
Printer-friendly Version
Interactive Discussion
Discussion
P
a
per
|
Dis
cussion
P
a
per
|
Discussion
P
a
per
|
Discussio
n
P
a
per
|
22
Brookhaven National Laboratory, Upton, NY, USA 23
University of the Pacific, Stockton, CA, USA 24
NASA Postdoctoral Program Fellow, NASA Goddard Institute for Space Studies, New York, NY, USA
25
Department of Environmental Toxicology, University of California, Davis, CA, USA 26
Droplet Measurements Technologies, Boulder, CO, USA 27
Chemical and Materials Sciences Division, Pacific Northwest National Laboratory, Richland, WA, USA
Received: 5 December 2011 – Accepted: 9 December 2011 – Published: 13 January 2012
Correspondence to: R. A. Zaveri ([email protected])
ACPD
12, 1299–1400, 2012Carbonaceous Aerosols and Radiative Effects
Study
R. A. Zaveri et al.
Title Page
Abstract Introduction
Conclusions References
Tables Figures
◭ ◮
◭ ◮
Back Close
Full Screen / Esc
Printer-friendly Version
Interactive Discussion
Discussion
P
a
per
|
Dis
cussion
P
a
per
|
Discussion
P
a
per
|
Discussio
n
P
a
per
|
Abstract
Substantial uncertainties still exist in the scientific understanding of the possible inter-actions between urban and natural (biogenic) emissions in the production and trans-formation of atmospheric aerosol and the resulting impact on climate change. The US Department of Energy (DOE) Atmospheric Radiation Measurement (ARM) program’s
5
Carbonaceous Aerosol and Radiative Effects Study (CARES) carried out in June 2010 in Central Valley, California, was a comprehensive effort designed to improve this un-derstanding. The primary objective of the field study was to investigate the evolution of secondary organic and black carbon aerosols and their climate-related properties in the Sacramento urban plume as it was routinely transported into the forested Sierra
10
Nevada foothills area. Urban aerosols and trace gases experienced significant physical and chemical transformations as they mixed with the reactive biogenic hydrocarbons emitted from the forest. Two heavily-instrumented ground sites – one within the Sacra-mento urban area and another about 40 km to the northeast in the foothills area – were set up to characterize the evolution of meteorological variables, trace gases, aerosol
15
precursors, aerosol size, composition, and climate-related properties in freshly polluted and “aged” urban air. On selected days, the DOE G-1 aircraft was deployed to make similar measurements upwind and across the evolving Sacramento plume in the morn-ing and again in the afternoon. The NASA B-200 aircraft, carrymorn-ing remote sensmorn-ing instruments, was also deployed to characterize the vertical and horizontal distribution
20
of aerosols and aerosol optical properties within and around the plume. This overview provides: (a) the scientific background and motivation for the study, (b) the operational and logistical information pertinent to the execution of the study, (c) an overview of key observations and initial results from the aircraft and ground-based sampling platforms, and (d) a roadmap of planned data analyses and focused modeling efforts that will
fa-25
ACPD
12, 1299–1400, 2012Carbonaceous Aerosols and Radiative Effects
Study
R. A. Zaveri et al.
Title Page
Abstract Introduction
Conclusions References
Tables Figures
◭ ◮
◭ ◮
Back Close
Full Screen / Esc
Printer-friendly Version
Interactive Discussion
Discussion
P
a
per
|
Dis
cussion
P
a
per
|
Discussion
P
a
per
|
Discussio
n
P
a
per
|
1 Introduction
The strategy of the US Department of Energy for improving the treatments of atmo-spheric aerosol processes and properties in global climate models involves building up from the microscale with observational validation at every step (Ghan and Schwartz, 2007). Particular emphasis is placed on improving the scientific understanding of the
5
possible interactions between various urban (anthropogenic) and natural (biogenic) emissions in aerosol formation and evolution of aerosol properties over a range of me-teorological and chemical environments via an integrated approach of field, laboratory, and modeling studies. The Carbonaceous Aerosols and Radiative Effects (CARES) field campaign conducted in June 2010 in Sacramento, California, was a
comprehen-10
sive effort designed to contribute toward accomplishing this goal.
Field observations show that ambient aerosol can be composed of a wide variety of compounds, including sulfate, nitrate, ammonium, sea salt, crustal species from soil dust, and carbonaceous materials (e.g., Murphy et al., 1998; Seinfeld and Pan-dis, 1998). Primary carbonaceous aerosols include black carbon (BC) particles mixed
15
with varying amounts of organic compounds that are directly emitted from fossil fuel combustion, cooking, industrial processes, and biomass burning (agricultural burning and natural wildfires). Secondary carbonaceous aerosols, more commonly referred to as secondary organic aerosols (SOA), are those formed in the atmosphere via homo-geneous nucleation, condensation, and heterohomo-geneous reactions of myriad gas-phase
20
oxidation products from numerous volatile and semi-volatile organic compounds of both anthropogenic and biogenic origins. Analyses of ambient aerosols in urban and rural areas have shown that carbonaceous compounds may constitute up to 90 % of the dry submicron particle mass (Kanakidou et al., 2005; Zhang et al., 2007).
Depending on their size and composition, aerosol particles can efficiently scatter
25
ACPD
12, 1299–1400, 2012Carbonaceous Aerosols and Radiative Effects
Study
R. A. Zaveri et al.
Title Page
Abstract Introduction
Conclusions References
Tables Figures
◭ ◮
◭ ◮
Back Close
Full Screen / Esc
Printer-friendly Version
Interactive Discussion
Discussion
P
a
per
|
Dis
cussion
P
a
per
|
Discussion
P
a
per
|
Discussio
n
P
a
per
|
state-of-the-art aerosol models that include treatments for trace gas photochemistry, aerosol microphysics, aerosol thermodynamics, gas-particle mass transfer, and het-erogeneous chemistry (e.g., Wexler and Seinfeld, 1991; Jacobson, 2002; Zhang et al., 2004; Bauer et al., 2008; Zaveri et al., 2008). However, substantial uncertainties still exist in our understanding of the evolution of organic and black carbon aerosols of
5
both anthropogenic and biogenic origins and the associated optical and CCN activa-tion properties. The CARES campaign was therefore motivated by three inter-related science questions: (1) How do anthropogenic and biogenic precursors interact to form SOA? (2) How rapidly does BC mix with other species, and what are the relative con-tributions of condensation and coagulation to BC mixing state evolution? (3) What are
10
the effects of aerosol mixing state and organic (primary and secondary) species on the associated optical and CCN activation properties?
During summer, the Sacramento urban plume transport is controlled by consistent, terrain-driven upslope winds that draw polluted air to the northeast, into the Sierra Nevada foothills area rich in biogenic emissions (Dillon et al., 2002). As a result, the
15
anthropogenic BC, primary organic aerosols (POA), SOA, and reactive trace gases from the Sacramento urban area undergo significant photochemical ageing as they mix with biogenic SOA precursors such as isoprene, monoterpenes, and related species. Some of these aged aerosols and trace gases could be transported back into the ur-ban area by nighttime downslope flows. In this way, the Sacramento plume forms a
20
natural chemical reactor useful for studying evolution of various carbonaceous and re-lated aerosols. The CARES campaign observational strategy was designed to take advantage of this flow pattern by setting up two observation sites – one located within the Sacramento urban area, referred to as the “T0 site”, and another located about 40 km to the northeast in Cool, CA, a small town in the foothills area, referred to as
25
ACPD
12, 1299–1400, 2012Carbonaceous Aerosols and Radiative Effects
Study
R. A. Zaveri et al.
Title Page
Abstract Introduction
Conclusions References
Tables Figures
◭ ◮
◭ ◮
Back Close
Full Screen / Esc
Printer-friendly Version
Interactive Discussion
Discussion
P
a
per
|
Dis
cussion
P
a
per
|
Discussion
P
a
per
|
Discussio
n
P
a
per
|
ground measurements were complemented by a similar set of airborne measurements onboard the DOE Gulfstream-1 (G-1) aircraft, with flight plans involving sampling up-wind, within, and outside of the evolving Sacramento urban plume in the morning and again in the afternoon. The NASA B-200 King Air aircraft, equipped with remote sens-ing instruments, was also deployed to characterize the vertical and horizontal
distribu-5
tion of aerosol optical properties and provide the vertical context for the G-1 and ground measurements.
The DOE CARES campaign overlapped temporally with the CalNex campaign in the Central Valley and Southern California regions in May and June 2010. CalNex was sponsored by the National Oceanic and Atmospheric Administration (NOAA) and the
10
California Air Resources Board (CARB), and it focused on the atmospheric chemistry and meteorological processes that affect air quality and climate change issues both in California and nationally. The CalNex sampling platforms included the NOAA WP-3D and Twin Otter aircraft, the NOAA R/V Atlantis, and two ground sites in southern California – one in Bakersfield and another in Los Angeles. The NOAA Twin Otter
air-15
craft moved its operation from Southern California to Sacramento (McClellan Airfield) to collaborate with CARES from 14–28 June. It carried a combination of downward-looking ozone/aerosol and Doppler wind lidars and the scanning University of Colorado Airborne Multi-Axis DOAS (CU AMAX-DOAS) system to investigate NOx emission in-ventories and the 3-dimensional distribution and transport processes of ozone and
20
aerosols in the Central Valley.
This paper provides an overview of the CARES project, and presents: (1) the scien-tific background and motivation for the field campaign, (2) the operational and logistical information pertinent to the execution of the campaign, (3) an overview of key obser-vations from the aircraft and ground-based sampling platforms, and (4) a roadmap of
25
ACPD
12, 1299–1400, 2012Carbonaceous Aerosols and Radiative Effects
Study
R. A. Zaveri et al.
Title Page
Abstract Introduction
Conclusions References
Tables Figures
◭ ◮
◭ ◮
Back Close
Full Screen / Esc
Printer-friendly Version
Interactive Discussion
Discussion
P
a
per
|
Dis
cussion
P
a
per
|
Discussion
P
a
per
|
Discussio
n
P
a
per
|
2 Brief review of previous research related to CARES objectives
2.1 SOA formation and interactions between anthropogenic and
biogenic emissions
Several field studies have shown that SOA forms rapidly in urban plumes, with most of the SOA mass forming within the first 12 h (Volkamer et al., 2006; Kleinman et al.,
5
2007; de Gouw et al., 2008). In contrast, modeling studies using Raoult’s-Law-based schemes, parameterized using laboratory chamber SOA yield data, significantly under-predict SOA formation in the ambient urban atmosphere as well as in the upper tropo-sphere (de Gouw et al., 2005; Heald et al., 2005; Johnson et al., 2006; Volkamer et al., 2006). In a more recent study, de Gouw et al. (2009) demonstrated that the growth of
10
SOA at a suburban site in Mexico City could not be explained in terms of the measured volatile organic compounds (VOCs) and their chamber-based particulate mass yields and formation kinetics. Robinson et al. (2007) have suggested that some SOA mass at urban to regional scales may be produced by volatilization of high molecular weight semi-volatile and intermediate volatility organic compounds (SVOCs and IVOCs) from
15
diesel exhaust primary organic aerosols (POA), followed by condensation of their ox-idation products. Recent modeling efforts incorporating these and other previously missing SOA sources have begun to close the gap between predicted and measured SOA levels (Dzepina et al., 2009; Hodzic et al., 2010; Slowik et al., 2010; Lee-Taylor et al., 2011). However, comparisons of higher-order modeling endpoints to
measure-20
ments, such as organic aerosol (OA) oxygen-to-carbon ratio (O/C), OA volatility, and ageing kinetics continue to indicate discrepancies in our understanding of SOA forma-tion and atmospheric ageing (Dzepina et al., 2009; Hodzic et al., 2010; Lee-Taylor et al., 2011).
In addition to these discrepancies, results from field studies suggest that
anthro-25
ACPD
12, 1299–1400, 2012Carbonaceous Aerosols and Radiative Effects
Study
R. A. Zaveri et al.
Title Page
Abstract Introduction
Conclusions References
Tables Figures
◭ ◮
◭ ◮
Back Close
Full Screen / Esc
Printer-friendly Version
Interactive Discussion
Discussion
P
a
per
|
Dis
cussion
P
a
per
|
Discussion
P
a
per
|
Discussio
n
P
a
per
|
anthropogenic emissions from fossil fuel combustion. However, the carbon isotope (14C) analysis of the WSOC samples indicated that roughly 70–80 % of the carbon was of biogenic (modern) origin. Formation of organosulfate and organic nitrate com-pounds as a result of interactions between anthropogenic pollutants (e.g., sulfate, NOx) and biogenic hydrocarbons (e.g., isoprene) has been suggested to contribute to SOA
5
mass (Bruns et al., 2010; Farmer et al., 2010; Surratt et al., 2008, 2010; Zaveri et al., 2010a). In contrast, hydrophobic POA formed from fossil fuel combustion may not readily absorb oxidized (polar) biogenic hydrocarbons, as was previously assumed in many models, to enhance the overall SOA yields (Song et al., 2007). Many laboratory studies have implicated heterogeneous chemistry of semi-volatile and volatile organic
10
vapors within aqueous inorganic aerosols as a potential route for SOA formation from biogenic precursors (Jang et al., 2003; Kroll et al., 2005; Liggio et al., 2005, 2007; Limbeck et al., 2003). Also, accretion reactions, including aldol condensation, acid dehydration, and gem-diol condensation can transform volatile organic species into oligomeric products of low volatility (Gao et al., 2004; Jang et al., 2003; Kalberer et al.,
15
2004; Tolocka et al., 2004), potentially increasing SOA mass beyond that predicted by Raoult’s Law based models. Recent laboratory and field studies (including CARES) indicate that biogenic SOA particles may exist in amorphous solid form, in which case the Raoult’s Law may not even be applicable to calculate gas-particle partitioning of organic species on atmospherically relevant timescales (Vaden et al., 2011a; Virtanen
20
et al., 2010).
One of the key instruments deployed during this and many previous campaigns for characterizing aerosol chemistry is the Aerodyne Aerosol Mass Spectrometer (AMS). The AMS provides real-time, quantitative, and size-resolved data on submicron aerosol composition with a time resolution of a few minutes or faster (Canagaratna et al.,
25
ACPD
12, 1299–1400, 2012Carbonaceous Aerosols and Radiative Effects
Study
R. A. Zaveri et al.
Title Page
Abstract Introduction
Conclusions References
Tables Figures
◭ ◮
◭ ◮
Back Close
Full Screen / Esc
Printer-friendly Version
Interactive Discussion
Discussion
P
a
per
|
Dis
cussion
P
a
per
|
Discussion
P
a
per
|
Discussio
n
P
a
per
|
to effectively determine organic aerosol factors representative of distinct sources and atmospheric processes (Zhang et al., 2005; Ulbrich et al., 2009). Recent studies have shown that comprehensive analyses of the mass spectra (i.e., chemical information) and temporal variation profiles of the OA factors, in conjunction with measurements of aerosol physics, tracer compounds, secondary aerosol precursors, and meteorological
5
conditions, may reveal insights into organic aerosol lifecycle processes, such as SOA formation and evolution (Zhang et al., 2011).
While significant progress has been made on this topic, the physical and chemi-cal interactions between anthropogenic and biogenic emissions leading to enhanced SOA formation remain poorly understood and are not represented well in regional and
10
global atmospheric models. The CARES campaign observational strategy was de-signed to examine SOA formation at the urban (source) and rural (receptor) sites when the Sacramento urban plume mixed with biogenic emissions and when it did not. The comprehensive observations of precursor gases, aerosol composition, size distribu-tion, etc. at the two sites and aboard the G-1 aircraft will be useful in constraining
15
and evaluating SOA models designed to investigate the various possible physical and chemical interactions between anthropogenic and biogenic SOA precursors.
2.2 Evolution of aerosol mixing state
Primary aerosol emissions typically consist of particles from sources such as wind-blown soil and road dust, sea spray, diesel and gasoline engine exhaust, biomass
20
burning, cooking, etc. Primary particles and particles formed via homogeneous nu-cleation are initially “externally mixed,” such that each particle type has a distinct size distribution and chemical composition. The optical and hygroscopic properties of these particles from different sources are also different. Upon physical and chemical inter-actions with various reactive and condensable trace gases and coagulation with other
25
ACPD
12, 1299–1400, 2012Carbonaceous Aerosols and Radiative Effects
Study
R. A. Zaveri et al.
Title Page
Abstract Introduction
Conclusions References
Tables Figures
◭ ◮
◭ ◮
Back Close
Full Screen / Esc
Printer-friendly Version
Interactive Discussion
Discussion
P
a
per
|
Dis
cussion
P
a
per
|
Discussion
P
a
per
|
Discussio
n
P
a
per
|
properties, CCN activation super-saturations, and chemical reactivity of freshly emitted (or formed) and aged aerosol particles can therefore differ significantly and depend strongly on their mixing state.
Amongst all the different types of primary and secondary aerosols present in the troposphere, BC (the refractory component of soot particles) is the most efficient and
5
significant particulate absorber of solar radiation, and plays an important role in both regional- and global-scale climate forcing (Ramanathan et al., 2001; Jacobson, 2002, 2006; Bond, 2007; Levy et al., 2008). Freshly emitted soot particles consist of fractal-like chain agglomerates of primary soot spherules of 10 to 30 nm diameter (Wentzel et al., 2003). Ageing of soot particles by condensation of hygroscopic species such as
sul-10
fate, nitrate, and SOA typically leads to a compaction of the initially non-spherical chain agglomerate structures (Zhang et al., 2008; Tritscher et al., 2011), although coated yet non-compacted BC particles have also been observed in urban plumes (Adachi and Buseck, 2008). The mixing state and morphology of BC-containing particles is of par-ticular interest from a climate change perspective, as a non-light-absorbing coating on
15
BC particles can increase the ensemble averaged absorption cross section of the BC core by up to a factor of 2 due to the focusing of light by the coating to the BC core (Lesins et al., 2002; Saathoff et al., 2003; Schnaiter et al., 2005; Bond et al., 2006; Adachi et al., 2010; Cross et al., 2010). The coating on BC particles also greatly in-creases their scattering cross sections, and the resulting single scattering albedo (i.e.,
20
the ratio of scattering cross section to the sum of scattering and absorption cross sec-tions) is a function of the BC core size and the coating thickness. Hygroscopic coatings also dramatically affect the CCN activation properties and atmospheric lifetime of BC particles (Cantrell et al., 2001; Mochida et al., 2006; Kuwata et al., 2007; Medina et al., 2007; Cubison et al., 2008; Furutani et al., 2008; Tritscher et al., 2011).
25
ACPD
12, 1299–1400, 2012Carbonaceous Aerosols and Radiative Effects
Study
R. A. Zaveri et al.
Title Page
Abstract Introduction
Conclusions References
Tables Figures
◭ ◮
◭ ◮
Back Close
Full Screen / Esc
Printer-friendly Version
Interactive Discussion
Discussion
P
a
per
|
Dis
cussion
P
a
per
|
Discussion
P
a
per
|
Discussio
n
P
a
per
|
et al., 2010). Several modeling studies have examined the roles of condensation and coagulation in transforming externally-mixed BC aerosols into internal mixtures (Fassi-Fihri et al., 1997; Jacobson, 2001, 2002; Jacobson et al., 1994; Strom et al., 1992). Recently, Riemer et al. (2008) developed a stochastic particle-resolved aerosol box-model, PartMC-MOSAIC, that explicitly resolves the composition and mixing state of
5
individual particles in a given population of different types of aerosols, including, but not limited to BC. The model was applied to an idealized urban plume scenario based on Los Angeles emissions, and the results indicate that BC particles have a wide range of mixing states after 12 to 24 h of processing. Evolution of aerosol mixing state was shown to be a highly complex phenomenon that strongly depended on the
10
concentration and composition of the emitted particles, gas-phase photochemical oxi-dation rates, dynamic mass transfer of condensable trace gases to particles of different sizes and compositions, coagulation rates, temperature, relative humidity, dilution with background air, and processing time since emission. In a follow-on study, Zaveri et al. (2010b) investigated the evolution of aerosol optical, hygroscopic, and cloud
activa-15
tion properties with the particle-resolved aerosol model, and found that these proper-ties can be sensitive to the aerosol mixing state even after 1 to 2 days of ageing. While field observations of evolution of BC mixing state are qualitatively consistent with the results from particle-resolved modeling studies, a quantitative validation of the detailed theoretical picture of aerosol mixing state evolution is necessary before a reliable,
com-20
putationally efficient mixing state framework can be developed for use in regional and global climate models.
The SP2 instrument, when combined with the state-of-the-art single particle mass spectrometer (SP-MS) instruments such as the single particle mass spectrometer (SPLAT II, Zelenyuk et al., 2009), Particle Analysis by Laser Mass Spectrometry
25
ACPD
12, 1299–1400, 2012Carbonaceous Aerosols and Radiative Effects
Study
R. A. Zaveri et al.
Title Page
Abstract Introduction
Conclusions References
Tables Figures
◭ ◮
◭ ◮
Back Close
Full Screen / Esc
Printer-friendly Version
Interactive Discussion
Discussion
P
a
per
|
Dis
cussion
P
a
per
|
Discussion
P
a
per
|
Discussio
n
P
a
per
|
to extend the analysis of data to determine aerosol density, optical properties, shape, number concentrations, and size distributions (Murphy et al., 2004; Moffet and Prather, 2005; Spencer et al., 2007; Zelenyuk et al., 2008; Zelenyuk and Imre, 2009a; Vaden et al., 2011b) as well as combining data from other sources (or acquired while within clouds) to determine composition as a function of hygroscopicity and CCN activity
(Bu-5
zorius et al., 2002; Herich et al., 2009; Kamphus et al., 2010; Zelenyuk et al., 2010; Hiranuma et al., 2011). Furthermore, offline analyses of field-collected aerosol sam-ples can provide additional details on the composition, mixing state, and morphology of individual particles. These offline analytical techniques range from scanning elec-tron microscopy (SEM) and micro-spectroscopy (STXM/NEXAFS) studies of individual
10
particles (Laskin, 2010, Moffet et al., 2010b) to ultra-high resolution mass spectrometry analysis of individual components in OA material (Nizkorodov et al., 2011).
The CARES campaign included SP2 and SP-MS instruments as well as particle samplers (for offline analyses) at both ground sites and onboard the G-1 to charac-terize the evolution of aerosol mixing states in the Sacramento plume. The resulting
15
composite picture of different particle types, size, composition, and morphology will be useful for constraining the particle-resolved aerosol model to evaluating the roles of condensation and coagulation in the evolution of aerosol mixing state, with a focus on BC-containing particles.
2.3 Aerosol optical properties
20
As already discussed, the optical properties of freshly emitted and aged BC-containing particles can differ significantly. The mass absorption cross-section (MAC) of uncoated, pure BC is estimated to be 7.5±1.2 m2g−1 for radiation of wavelength λ=550 nm (Bond and Bergstrom, 2006). Laboratory studies and the “core-shell” Mie theory cal-culations show that ensemble average MAC of coated BC particles is amplified by
25
ACPD
12, 1299–1400, 2012Carbonaceous Aerosols and Radiative Effects
Study
R. A. Zaveri et al.
Title Page
Abstract Introduction
Conclusions References
Tables Figures
◭ ◮
◭ ◮
Back Close
Full Screen / Esc
Printer-friendly Version
Interactive Discussion
Discussion
P
a
per
|
Dis
cussion
P
a
per
|
Discussion
P
a
per
|
Discussio
n
P
a
per
|
particle diameters>150 nm) (Fuller et al., 1999). In addition to BC, organic compounds such as humic-like substances (HULIS) present in biomass burning aerosols also con-tribute to light absorption in the atmosphere (Mukai and Ambe, 1986; Havers et al., 1998; Hoffer et al., 2006; Lukacs et al., 2007). While light absorption by BC parti-cles from diesel and motor vehicle soot typically displays an inverse dependence on
5
wavelength, light absorbing organic carbon (LAOC) typically displays much stronger wavelength dependence. This increased absorption of light at wavelengths shorter than 600 nm causes the LAOC particles to appear brown (or yellow) (Bergstrom et al., 2002; Kirchstetter et al., 2004; Andreae and Gelencs ´er, 2006; Barnard et al., 2008; Gyawali et al., 2011). Furthermore, biomass burning particles composed of a small
10
BC core (∼50 nm) and a thick coating of LAOC species may experience even larger
enhancements in the absorption of light at wavelengths shorter than 600 nm (Gyawali et al., 2009).
Recent field measurements also indicate secondary sources of LAOC particulate matter that exhibit some chemical similarities to HULIS (Duarte et al., 2005; Marley et
15
al., 2009; Hecobian et al., 2010). While the exact mechanisms for secondary LAOC formation in the ambient atmosphere are not fully understood, laboratory studies show that chromophores (components of molecules that absorb light) can form via a variety of heterogeneous chemical reactions, including ozonolysis of terpenes in the pres-ence of ammonium ions (Bones et al., 2010) and isoprene oxidation in the prespres-ence of
20
acidic solutions (Limbeck et al., 2003). Carbonyls such as glyoxal and methylglyoxal, produced from gas-phase photooxidation of many anthropogenic and biogenic VOCs, can also lead to the formation of LAOC material via heterogeneous reactions in acidic solutions (Noziere et al., 2007; Noziere and Esteve, 2005; Sareen et al., 2010), with amino acids (de Haan et al., 2009a; Noziere et al., 2007), methyl amines (de Haan et
25
al., 2009b), and ammonium salts (Noziere et al., 2009; Sareen et al., 2010; Shapiro et al., 2009). Nighttime oxidation of biogenic VOCs via nitrate radical chemistry may also lead to secondary LAOC material (Brown et al., 2009; Zaveri et al., 2010a).
ACPD
12, 1299–1400, 2012Carbonaceous Aerosols and Radiative Effects
Study
R. A. Zaveri et al.
Title Page
Abstract Introduction
Conclusions References
Tables Figures
◭ ◮
◭ ◮
Back Close
Full Screen / Esc
Printer-friendly Version
Interactive Discussion
Discussion
P
a
per
|
Dis
cussion
P
a
per
|
Discussion
P
a
per
|
Discussio
n
P
a
per
|
the Sacramento urban plume, a major objective of CARES was to observe the evolution of aerosol light absorption and scattering in the near-UV and visible spectral regions as SOA of both anthropogenic and biogenic origin condensed (or formed via heteroge-neous reactions) on urban BC particles and other, non-BC containing particles. Recent studies (Lack et al., 2008; Cappa et al., 2008) suggest that absorption measurements
5
from filter-based instruments such as the Particle/Soot Absorption Photometer (PSAP) are suspect in the presence of OA. Photoacoustic and cavity ring-down spectroscopy instruments that bypass the filter problems and are useful for determining absorption coefficients in the visible region (Lewis et al., 2008; Radney et al., 2009). During CARES, the spectral ranges of these instruments were extended down toλ=355 nm
10
to specifically examine the absorption and scattering properties of OA.
3 Design and measurements
3.1 Campaign venue and geography
The CARES campaign was based in Sacramento, CA, and took place from 2 through 28 June 2010. Sacramento is located in California’s expansive Central Valley, and is
15
the sixth most populous city in California with a 2009 estimated population of 490 000. The seven-county Sacramento Metropolitan Area is the largest in the Central Valley, with an estimated population of 2.46 million. The western half of Greater Sacramento is agricultural area while the eastern portion of the region consists of the Sierra Nevada and its foothills, which are dominated by coniferous and oak forests. Figure 2 shows
20
the spatial distribution of total anthropogenic VOCs and biogenic isoprene emissions in central California along with the locations of the T0 and T1 measurement supersites. The anthropogenic VOC emissions are from California Air Resources Board (CARB) emission inventory and the biogenic emissions are calculated online using MEGAN (Model of Emissions of Gases and Aerosols from Nature; Guenther et al., 2006).
25
ACPD
12, 1299–1400, 2012Carbonaceous Aerosols and Radiative Effects
Study
R. A. Zaveri et al.
Title Page
Abstract Introduction
Conclusions References
Tables Figures
◭ ◮
◭ ◮
Back Close
Full Screen / Esc
Printer-friendly Version
Interactive Discussion
Discussion
P
a
per
|
Dis
cussion
P
a
per
|
Discussion
P
a
per
|
Discussio
n
P
a
per
|
winters (October through April) and hot, dry summers (June through August). Sum-mer heat is often moderated by a sea breeze, locally known as the “delta breeze”, which comes from the San Francisco Bay through the Carquinez Strait (a narrow gap in the Coast Range) into the Sacramento-San Joaquin River Delta. While transport processes over the entire Central Valley can be complex (Bao et al., 2008), the local
5
transport of the Sacramento urban plume during the summer is controlled by consis-tent, terrain-driven upslope winds that draw polluted air northeast over oak and pine trees in the Blodgett Forest area in the Sierra Nevada Mountains by late afternoon. The Sacramento-Blodgett Forest corridor effectively serves as a mesoscale flow reac-tor where the daily evolution of the Sacramento urban plume can be characterized as a
10
Lagrangian air mass transported from the urban core into the sparsely populated Sierra Nevada Mountains (Dillon et al., 2002; Murphy et al., 2007). The CARES campaign observational strategy was designed to take advantage of this natural flow pattern by setting up the two observation sites – one located within the Sacramento urban area (T0) and another located about 40 km to the northeast in Cool (T1), a small town in the
15
forested foothills of the Sierra Nevada Mountains.
3.2 Ground sites and instruments
The T0 site (altitude approximately 30 m MSL) was located in the campus of Ameri-can River College, about 14 km northeast of the Sacramento downtown area. The T1 site (altitude approximately 450 m MSL) was located on the property of the Northside
20
School in Cool, California, situated amidst a forested area rich in biogenic emissions. The aged urban plume typically arrived at the T1 site around mid- to late-afternoon when ozone and SOA from urban and biogenic precursors were near their peak con-centrations. The T0 and T1 ground sites thus characterized the diurnal evolution of meteorological variables, trace gases, aerosol precursors, and aerosol composition
25
and properties in freshly polluted and aged urban air, respectively.
ACPD
12, 1299–1400, 2012Carbonaceous Aerosols and Radiative Effects
Study
R. A. Zaveri et al.
Title Page
Abstract Introduction
Conclusions References
Tables Figures
◭ ◮
◭ ◮
Back Close
Full Screen / Esc
Printer-friendly Version
Interactive Discussion
Discussion
P
a
per
|
Dis
cussion
P
a
per
|
Discussion
P
a
per
|
Discussio
n
P
a
per
|
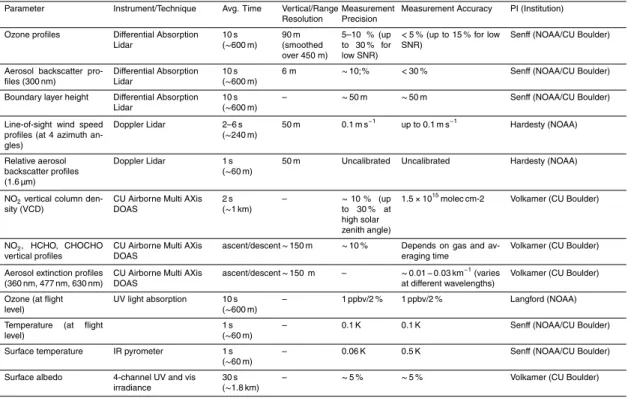
particle concentration and chemical composition, particle physical properties (morphol-ogy, density, optical properties, hygroscopicity, and CCN activation), solar radiation measurements, and meteorological measurements. The measurement techniques, uncertainties, and time resolutions are summarized in Table 1. Two 40×10 ft trailers
were set up at each site to house the instruments. The trailers were placed side by
5
side, with the aerosol stack (∼8 m high) erected between them, and inlet lines going
into both trailers from the same stack. The trailer aerosol inlet system was based on the NOAA Global Monitoring Division (GMD) Aerosol Observing System (AOS) tower and inlet design (Delene and Ogren, 2002). The sample air was pulled through the stack and split into 2 components – an overall stack flow of∼1000 l min−1 and an aerosol
10
flow (∼120 l min−1) through an internal concentric stainless steel tube (∼5 cm OD). The
lower end of the 5-cm tube terminated in a 5-port manifold, four of which were 3/4 -in stainless tubes and the fifth a 1/2-in tube (central flow for temperature and relative hu-midity measurements, as well as an auxiliary aerosol port for an Aerosol Particle Sizer, APS). Flow through the system was provided by a stand-alone pump box external to
15
the trailers. Separate inlet lines were provided for trace gas and particle instruments. The trace gas inlet lines were Teflon and the particle inlet lines were made of stainless steel. One of the ports was connected to the AOS rack in one of the trailers. Two of the ports were used to provide aerosol flow to each of the trailers, respectively. Each inlet line coming into the trailer was further split (by a 3/4-in “Y”) into lines that were wrapped
20
around the internal walls of the trailer with 1/2-in pick-offports strategically placed for the instrument configuration of each trailer. The return lines from these sampling man-ifolds were also attached to the pump box. The AOS rack had special return lines going to a carbon-vane pump and a diaphragm pump, respectively (also contained in the pump box).
25
ACPD
12, 1299–1400, 2012Carbonaceous Aerosols and Radiative Effects
Study
R. A. Zaveri et al.
Title Page
Abstract Introduction
Conclusions References
Tables Figures
◭ ◮
◭ ◮
Back Close
Full Screen / Esc
Printer-friendly Version
Interactive Discussion
Discussion
P
a
per
|
Dis
cussion
P
a
per
|
Discussion
P
a
per
|
Discussio
n
P
a
per
|
tower. Approximately 0.5 m below the weather station was the main inlet. Approxi-mately 32 l min−1of air was pulled through the inlet by a diaphragm pump with the flow measured by a TSI inline flow meter. Each instrument inside the trailer subsampled from this main inlet line. The NOxyinstrument had a dedicated NOyconverter inlet that was mounted about 1 m below the main inlet line.
5
The trace gas measurements included carbon monoxide (CO), nitric oxide (NO), to-tal reactive odd nitrogen species (NOy), and ozone (O3). Nitrogen dioxide (NO2) and sulfur dioxide (SO2) analyzers were deployed at the T0 site (and on the G-1). Near sur-face NO2mixing ratios and partial vertical column densities (VCD, integral over bound-ary layer height) were measured at T1 by the University of Colorado Ground Multi
10
AXis DOAS instrument (CU GMAX-DOAS, Volkamer et al., 2009). Proton-Transfer Reaction Mass Spectrometers (PTR-MS) were used to measure mixing ratios of se-lected volatile organic compounds (VOC) of both anthropogenic and biogenic origin. The PTR-MS at T0 was modified to also characterize the total concentration of semi-volatile long chain alkanes (>C10) and heavier monoaromatics associated with diesel
15
exhaust vapor emissions. The modification was to add a second inlet to the PTR-MS to allow in-situ thermal desorption sampling from a dedicated heat traced inlet. PTR-MS sampling alternated between thermal desorption analysis for diesel exhaust species and continuous de-humidified VOC sampling as described in Erickson et al. (2011). In addition, a gas chromatograph ion trap mass spectrometer (GC-ITMS) was used at
20
T0 to measure selected C6-C10VOCs to determine the abundance of SOA precursors such as monoaromatics emitted in vehicle exhaust and monoterpene compounds emit-ted from biogenic sources. Finally, near-surface concentrations of formaldehyde and glyoxal and VCDs were measured by CU GMAX-DOAS at T1 (Sinreich et al., 2010).
Condensation particle counters (CPC) were used to measure total particle number
25
ACPD
12, 1299–1400, 2012Carbonaceous Aerosols and Radiative Effects
Study
R. A. Zaveri et al.
Title Page
Abstract Introduction
Conclusions References
Tables Figures
◭ ◮
◭ ◮
Back Close
Full Screen / Esc
Printer-friendly Version
Interactive Discussion
Discussion
P
a
per
|
Dis
cussion
P
a
per
|
Discussion
P
a
per
|
Discussio
n
P
a
per
|
2007), was deployed at each ground site to measure aerosol composition and volatility distributions of submicron inorganic and organic aerosols. The HR-ToF-AMS uses an aerodynamic lens to sample submicron particles (∼50–1000 nm) into vacuum where
they are aerodynamically sized, thermally vaporized on a heated surface (∼600◦C),
and chemically analyzed via 70 eV electron impact ionization time-of-flight mass
spec-5
trometry (Canagaratna et al., 2007). Since aerosol species must be vaporized to be detected, the HR-ToF-AMS does not measure refractory materials such as elemental carbon and dust particles. However, non-refractory (NR) materials internally mixed with refractory substances can be determined by the AMS and the presence of significant quantities of refractory particles can be detected via comparison between aerosol size
10
distributions (from the SMPS or the AMS) and total mass detected, with appropriate assumptions about the particle density.
A Particle-Into-Liquid Sampler (PILS, Sooroshian et al., 2006) with an autosampler was deployed at each site to collect vials every hour for offline analysis of water soluble aerosol species. A PM1 impactor (BMI) was used upstream of the PILS, CCN, and
15
HR-ToF-AMS. Droplet Measurement Technologies (DMT) Single Particle Soot Pho-tometers (SP2, Stephens et al., 2003; Schwarz et al., 2006) were used to measure single particle and ensemble black carbon mass loadings along with information on the amount of the particles’ coatings and cores. Single particle mass spectrometers SPLAT II (Zelenyuk et al., 2009) and PALMS (Murphy and Thomson, 1997) were
de-20
ployed at the T0 and T1 sites, respectively. A number of different impactors were also deployed at both sites to collect aerosol samples for offline analysis of particulate matter, ranging from electron microscopy and micro-spectroscopy studies of individual particles (Laskin, 2010, Moffet et al., 2010b) to ultra high resolution mass spectrometry analysis of individual components in OA material (Nizkorodov et al., 2011).
25
ACPD
12, 1299–1400, 2012Carbonaceous Aerosols and Radiative Effects
Study
R. A. Zaveri et al.
Title Page
Abstract Introduction
Conclusions References
Tables Figures
◭ ◮
◭ ◮
Back Close
Full Screen / Esc
Printer-friendly Version
Interactive Discussion
Discussion
P
a
per
|
Dis
cussion
P
a
per
|
Discussion
P
a
per
|
Discussio
n
P
a
per
|
June and at the T1 site from 16 to 28 June to collect particles of aerodynamic diame-ter≤2.5 µm (PM2.5) to study distribution of organic reactive species, particularly acids and aldehydes with respect to total organic carbon. Samples were collected for 12 h periods, from 08:00 a.m. to 08:00 p.m., and from 08:00 p.m. to 08:00 a.m. Half of each filter was spiked with recovery standards consisting of deuterated acids and aldehyde,
5
derivatized using pentafluorobenzyl hydroxyl amine (PFBHA) in methanol to stabilize aldehydes, and stored at−20◦C in vials closed with Teflon stopper until the analysis.
The other half of the filter was also stored at−20◦C without any modifications.
Aerosol optical properties were measured at multiple wavelengths with several tech-niques, including cavity ring-down spectroscopy for light extinction (CRDS, Smith and
10
Atkinson, 2001; Radney et al., 2009; Langridge et al., 2011), photoacoustic spec-troscopy for light absorption (PAS, Arnott et al., 1999; Lack et al., 2006), nephelometer for light scattering (Anderson et al., 1996), and particle soot absorption photometer (PSAP, Ogren, 2010). These measurements provide the absorption, scattering, and extinction coefficients as well as intensive (not dependent on aerosol concentration)
15
properties such as the single scattering albedo and ˚Angstr ¨om exponents, and depend-ing on the particular operatdepend-ing procedures, their response to heatdepend-ing and changes in relative humidity. Radiation observations at the ground sites included broadband so-lar fluxes as well as Multi-Filter Rotating Shadowband Radiometer (MFRSR, Harrison et al., 1994) measurements of downwelling visible and near-IR solar irradiance at six
20
discrete wavelengths, which provide information needed to estimate aerosol optical depth and intensive properties. Partial column integrals over boundary layer height of aerosol extinction were observed at three wavelengths (360 nm, 477 nm, 630 nm) as in-ferred from solar stray light column observations of oxygen dimer by CU GMAX-DOAS (Volkamer et al., 2009; Sinreich et al., 2010).
25
ACPD
12, 1299–1400, 2012Carbonaceous Aerosols and Radiative Effects
Study
R. A. Zaveri et al.
Title Page
Abstract Introduction
Conclusions References
Tables Figures
◭ ◮
◭ ◮
Back Close
Full Screen / Esc
Printer-friendly Version
Interactive Discussion
Discussion
P
a
per
|
Dis
cussion
P
a
per
|
Discussion
P
a
per
|
Discussio
n
P
a
per
|
f(RH) measurement). Finally, atmospheric state observations were made at the sur-face and aloft including wind speed and direction, pressure, temperature, and relative humidity at both sites using several instruments.
3.3 Aircraft payloads
The aircraft component of the CARES field campaign was based out of McClellan
Air-5
field, located about 4 km northwest of the T0 ground site. The trace gas and aerosol measurements onboard the G-1 aircraft were similar to those deployed at the ground sites. The techniques, uncertainties, and time resolutions of all the G-1 measurements are summarized in Table 2. Trace gas measurements included CO, NO, NO2, NOy, O3, and SO2(references?). An Ionicon high-sensitivity quadrupole PTR-MS was used
10
to measure VOCs. Condensation particle counters CPC-3025 and CPC-3010 (Sem et al., 2002) were deployed to measure particle number concentrations for optical di-ameter (Dp) greater than 3 and 10 nm, respectively. A combination of Fast Integrating Mobility Spectrometer (FIMS) (Kulkarni and Wang, 2006; Olfert et al., 2008), Ultra-High Sensitivity Aerosol Spectrometer-Airborne (UHSAS-A, Cai et al., 2008), and the Cloud
15
Aerosol Spectrometer (CAS) portion of the Cloud Aerosol Precipitation Spectrometer (CAPS) probe (Baumgardner et al., 2001) were used to measure the particle size dis-tribution for mobility diameters (Dm) between 30 and 70 nm, and geometric diameters (Dg) between 60 and 1000 nm, and 500 and 50 000 nm, respectively.
An Aerodyne HR-ToF-AMS was deployed to measure non-refractory aerosol
com-20
ponents, a DMT SP2 was used to measure BC number and mass concentrations, and the A-ATOFMS was used to measure single-particle composition and mixing state. A PILS with an autosampler was deployed to collect vials every 3 minutes for offline anal-ysis of water soluble aerosol species. Automated sampling of aerosol particles for microscopy and spectromicroscopy analyses was carried out using a Time-Resolved
25
ACPD
12, 1299–1400, 2012Carbonaceous Aerosols and Radiative Effects
Study
R. A. Zaveri et al.
Title Page
Abstract Introduction
Conclusions References
Tables Figures
◭ ◮
◭ ◮
Back Close
Full Screen / Esc
Printer-friendly Version
Interactive Discussion
Discussion
P
a
per
|
Dis
cussion
P
a
per
|
Discussion
P
a
per
|
Discussio
n
P
a
per
|
3563 nephelometer (Anderson et al., 1996), and a Radiance Research PSAP (Ogren, 2010). The aerosol inlet on the G-1 allowed particles up to 5 µm aerodynamic diame-ter wit close to 100 % transmission efficiency. Meteorological measurements included temperature, dew point, static pressure, and wind speed and direction.
The NASA B-200 King Air (B-200) aircraft deployed a High Spectral Resolution
Li-5
dar (HSRL) (Hair et al., 2008; Rogers et al., 2009) that measures aerosol backscat-ter ratio, backscatbackscat-ter and extinction coefficients, and depolarization. It also carried a digital camera and the GISS Research Scanning Polarimeter (RSP). The latter in-strument measures total and polarized reflectances in nine spectral bands across the visible and short-wave infrared portion of the electromagnetic spectrum. From these
10
measurements, column-averaged aerosol optical (e.g. optical depth) and microphysi-cal (e.g. refractive index and size distribution) parameters can be derived. The HSRL and RSP have been deployed together in several major field campaigns since 2008, in an effort to assess the potential of the synergistic exploitation of active and passive sensors in aerosol research (Waquet et al., 2009; Knobelspiesse et al., 2011; Ottaviani
15
et al., 2011). The uncertainties and time resolutions of the B-200 measurements are summarized in Table 3.
As part of the CalNex field program, the NOAA Twin Otter aircraft moved its operation from Southern California to Sacramento (McClellan Airfield) to collaborate with CARES from 14–28 June. The NOAA Twin Otter was configured as a remote sensing platform
20
carrying an ozone/aerosol lidar, a Doppler wind lidar, a scanning DOAS system, and several radiometers. The nadir-pointing Tunable Ozone Profiler for Aerosol and oZone (TOPAZ) lidar (Alvarez et al, 2011; Langford et al., 2011) measured ozone and aerosol backscatter profiles below the aircraft while the downward-looking, conically-scanned Doppler lidar (Pearson et al., 2009) provided measurements of horizontal and
verti-25
ACPD
12, 1299–1400, 2012Carbonaceous Aerosols and Radiative Effects
Study
R. A. Zaveri et al.
Title Page
Abstract Introduction
Conclusions References
Tables Figures
◭ ◮
◭ ◮
Back Close
Full Screen / Esc
Printer-friendly Version
Interactive Discussion
Discussion
P
a
per
|
Dis
cussion
P
a
per
|
Discussion
P
a
per
|
Discussio
n
P
a
per
|
temperature. These remote sensors were complemented by in situ measurements of ozone mixing ratio and temperature at flight level. The specifications for all instruments onboard the NOAA Twin Otter are listed in Table 4. This unique instrument package enabled the characterization of the horizontal and vertical structure of chemically and radiatively important trace gases and particulates within the boundary layer and lower
5
free troposphere. The primary objectives of the NOAA Twin Otter deployment during CARES were the investigation of NOx emission inventories, and the mapping of the 3-D distribution and transport processes of ozone and aerosols in the Central Valley.
3.4 Aircraft flights
The Weather Research and Forecasting (WRF) model (Grell et al., 2005) was run daily
10
at PNNL to provide 72-h forecasts of tracer plumes, which were used to guide aircraft operations and flight planning. The tracer plumes were based on CO emissions as well as meteorological parameters, using a horizontal grid spacing of 4 km. The trac-ers were categorized into 20 sub-regions based on anthropogenic emissions source region that could impact the CARES sampling domain. Each forecast was made
us-15
ing the National Centers for Environmental Prediction’s 00:00 UTC North American Mesoscale analysis and corresponding forecasts as initial and boundary conditions. Tracers were initialized with the previous day’s forecasted tracer fields at 00:00 UTC. After the WRF forecast was completed, graphics depicting tracer positions at the sur-face and at select altitudes were generated automatically and made available on the
20
CARES website (http://campaign.arm.gov/cares/forecast). Figure 3 shows examples of tracer forecasts (at 16:00 PDT) under southwesterly and northwesterly flows, which respectively occurred for 15 and 9 days out of the total 27 days from 2 through 28 June. More detailed analysis of the CO tracer forecasts and an analysis of them to categorize dominant transport scenarios during CARES can be found in Fast et al. (2011).
25
ACPD
12, 1299–1400, 2012Carbonaceous Aerosols and Radiative Effects
Study
R. A. Zaveri et al.
Title Page
Abstract Introduction
Conclusions References
Tables Figures
◭ ◮
◭ ◮
Back Close
Full Screen / Esc
Printer-friendly Version
Interactive Discussion
Discussion
P
a
per
|
Dis
cussion
P
a
per
|
Discussion
P
a
per
|
Discussio
n
P
a
per
|
The G-1 flight plans included several patterns that were designed for a specific pur-pose or the given wind flow condition. These patterns can be grouped into 3 basic types of missions: (1) morning or afternoon flight plan designed to characterize the inflow from the Bay Area under southwesterly flow; (2) morning and afternoon flight plans designed to characterize the evolution of the Sacramento urban plume under
5
southwesterly flow; (3) morning and afternoon flight plans designed to characterize the evolution of the Sacramento urban plume under northwesterly flow. A late morning flight was also conducted on 27 June to characterize isoprene emission flux over the Sierra Nevada foothills region.
The B-200 flew at an altitude of approximately 7 km above ground, with most flights
10
coordinated with the G-1 to characterize the vertical and horizontal distribution of aerosol optical properties and provide the vertical context for the G-1 and ground mea-surements. B-200 also sampled over a larger area than the G-1 so that the G-1 ob-servations could be interpreted within the larger spatial context. Figure 4 shows the G-1 and B-200 flight tracks grouped according to the type of the mission based on the
15
expected transport scenario from WRF tracer forecast. Additional missions flown by the G-1 and B-200, not shown here, included coordination with R/V Atlantis that moved along the Sacramento Deep Water Channel from San Francisco Bay on 3 June and an intercomparison flight with the NOAA WP-3D on 18 June in the San Joaquin Valley, from Fresno to Bakersfield, CA.
20
While the NOAA Twin Otter flights were not closely coordinated with the G-1 or the B-200, they were mostly in the same general area, with some flights extending over a larger domain (Fig. 4). The main objective was to sample the greater Sacramento area extensively, including regular overpasses over the T1 site. The Twin Otter flew morn-ing and afternoon missions, typically lastmorn-ing 3–4 h. The mornmorn-ing flights were generally
25
ACPD
12, 1299–1400, 2012Carbonaceous Aerosols and Radiative Effects
Study
R. A. Zaveri et al.
Title Page
Abstract Introduction
Conclusions References
Tables Figures
◭ ◮
◭ ◮
Back Close
Full Screen / Esc
Printer-friendly Version
Interactive Discussion
Discussion
P
a
per
|
Dis
cussion
P
a
per
|
Discussion
P
a
per
|
Discussio
n
P
a
per
|
4 Overview of observations
4.1 Meteorological context of CARES
An overview of meteorology during CARES is provided by Fast et al. (2011). Here we give a brief summary of the meteorological conditions that prevailed during the study period. During late May the Central Valley experienced strong northwesterly flow and
5
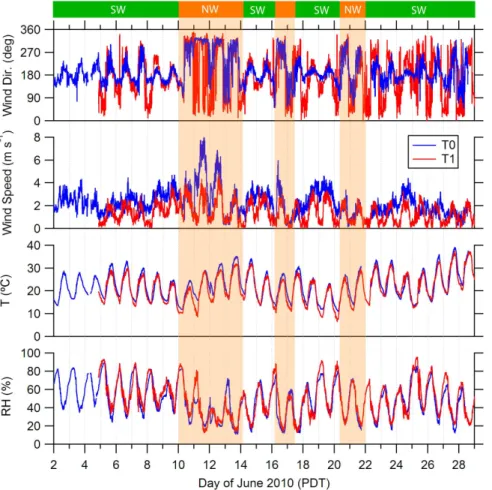
precipitation events, which were likely due to the lingering effects of the moderate El Nino that occurred in early 2010. The campaign thus began with cooler than normal temperatures and intermittent cloudiness through 6 June, followed by mostly sunny days for the remainder of the campaign. Figure 5 displays the time series of wind direction, wind speed, temperature (T), and relative humidity (RH) at the T0 and T1
10
sites. The wind direction at both sites during the daytime was typically southwesterly to westerly, favoring transport of the Sacramento urban plume to the T1 site area by late afternoon or early evening. For the days labeled SW, the wind direction at T0 typically shifted to southerly by 18:00 PDT and to southeasterly by midnight, bringing relatively cleaner background air into the urban area. In contrast, the wind direction at the T1 site
15
typically experienced a reversal from westerly (upslope) in the afternoon to easterly or northeasterly (downslope) at night, gradually recirculating the air mass in the foothills region back into the valley in the residual layer by next morning.
Days with synoptic southwesterly (SW) flow were generally favorable for transport-ing the urban plume from Sacramento to the T1 site and vicinity. These days include:
20
2–4, 6–9, 14–15, 17–19, and 23–28 June. The period from 22 to 28 June also expe-rienced a steady buildup of aged pollutants (particularly of organic aerosols as shown in Sect. 4.3) due to more pronounced recirculation of pollutants coupled with warmer temperatures toward the end of June. These conditions resulted in the highest pollu-tion days (25 through 28 June) at the end of the campaign. Observapollu-tions across the
25
ACPD
12, 1299–1400, 2012Carbonaceous Aerosols and Radiative Effects
Study
R. A. Zaveri et al.
Title Page
Abstract Introduction
Conclusions References
Tables Figures
◭ ◮
◭ ◮
Back Close
Full Screen / Esc
Printer-friendly Version
Interactive Discussion
Discussion
P
a
per
|
Dis
cussion
P
a
per
|
Discussion
P
a
per
|
Discussio
n
P
a
per
|
conditions.
The SW wind pattern was interrupted by northwesterly (NW) flows three times dur-ing the campaign: 10–13, 16–17, and 20–21 June. Durdur-ing these NW flow events the Sacramento urban plume was transported to the southeast along San Joaquin Val-ley, with relatively less mixing with biogenic emissions when compared to SW flow
5
events. Conversely, the biogenic emissions at and around the T1 site were not sig-nificantly influenced by urban emissions during the NW flow periods. This contrasting feature between the SW and NW flow events will be valuable in investigating the role of anthropogenic-biogenic interactions in SOA formation from each source type. The SW and NW flow periods are respectively identified with green and orange bars at
10
the top in Fig. 5 (and subsequent figures showing time series of other variables), with semi-transparent orange shading shown through all the plots for the NW flow periods.
The wind speeds at both T0 and T1 sites were generally small (<4 m s−1), with large values occurring around noon and the smallest values around midnight. Diurnal varia-tions in surface temperatures at the T0 and T1 sites were similar, with highs between
15
25 and 35◦C occurring around 18:00 PDT and lows between 10 and 15◦C occurring around 06:00 PDT. Due to the higher elevation of the T1 site, the air was usually a few degrees (0 to 5◦C) cooler at T1 than at T0. The last three days (26–28 June) were the warmest of the entire campaign, with temperatures at T0 reaching a maximum of 39◦C on 27 June. Relative humidity displayed an opposite diurnal behavior compared
20
to temperature, with highs between 70 and 90 % occurring at 06:00 PDT and lows of about 20 % occurring around 18:00 PDT.
4.2 Trace gases observations
Figure 6 shows comparisons of the time series of key trace gases (SO2, CO, NOy, O3, toluene, and isoprene) observed at the T0 and T1 sites (SO2 was not measured at
25
ACPD
12, 1299–1400, 2012Carbonaceous Aerosols and Radiative Effects
Study
R. A. Zaveri et al.
Title Page
Abstract Introduction
Conclusions References
Tables Figures
◭ ◮
◭ ◮
Back Close
Full Screen / Esc
Printer-friendly Version
Interactive Discussion
Discussion
P
a
per
|
Dis
cussion
P
a
per
|
Discussion
P
a
per
|
Discussio
n
P
a
per
|
routinely transported to the Sacramento area and into the Central Valley during SW flow and SO2 mixing ratios of 1.5 to 2 ppbv were observed at T0 during the daytime under these conditions. In contrast, SO2mixing ratios were nearly zero at the T0 site at night or during NW flow. SO2 mixing ratios measured onboard the G-1 during overpasses at T0 were typically equal to or up to 50 % higher than those measured at the T0 site.
5
Such differences between ground and airborne observations could be expected as the SO2plume was quite narrow with sharp gradients.
As expected, the T0 urban site experienced significantly higher CO mixing ratios compared to the T1 site in the rural foothills area. The minimum values at T0 were generally around 100 ppbv while they were as low as 80 ppbv at the T1 site. The highs
10
at T0 were typically about 400 ppbv around noon, with occasional spikes reaching up to 1000 ppbv, likely due to local vehicular traffic at the site. During the NW flow periods CO mixing ratios ranging from 400 to 1000 ppbv were observed around midnight, likely due to transport of pollution from Interstate I-80 just 2 miles north of the T0 site. The highs at T1 were typically around 200 ppbv, which occurred in the evening after 18:00 PDT when
15
the diluted Sacramento plume was transported to the site under SW winds. CO mixing ratios measured onboard the G-1 were in very good agreement with those measured at the respective ground sites during the overpasses, except when the ground sites experienced spikes due to local emissions. Diurnal behavior of NOy mixing ratios at T0 was similar to that of CO, with lows around 3 ppbv and highs ranging between 20
20
and 40 ppbv. During the NW flow periods, NOy mixing ratios ranged between 40 and 80 ppbv at midnight. The G-1 based NOy observations were also in good agreement with the ground sites.
The diurnal behavior of O3mixing ratios at the T0 and T1 sites were quite similar de-spite the marked differences in the precursor trace gas composition and concentrations
25