ACPD
9, 20309–20347, 2009Evidence of the impact of deep convection on reactive VOC
J. Bechara et al.
Title Page
Abstract Introduction
Conclusions References
Tables Figures
◭ ◮
◭ ◮
Back Close
Full Screen / Esc
Printer-friendly Version
Interactive Discussion Atmos. Chem. Phys. Discuss., 9, 20309–20347, 2009
www.atmos-chem-phys-discuss.net/9/20309/2009/ © Author(s) 2009. This work is distributed under the Creative Commons Attribution 3.0 License.
Atmospheric Chemistry and Physics Discussions
This discussion paper is/has been under review for the journalAtmospheric Chemistry and Physics (ACP). Please refer to the corresponding final paper inACPif available.
Evidence of the impact of deep
convection on reactive volatile organic
compounds in the upper tropical
troposphere during the AMMA experiment
in West Africa
J. Bechara1, A. Borbon1, C. Jambert1, A. Colomb1,*, and P. E. Perros1
1
Laboratoire Interuniversitaire des Syst `emes Atmosph ´eriques (LISA), Universit ´es Paris 12 et Paris 7, CNRS, 61, avenue du G ´en ´eral de Gaulle, Cr ´eteil, France
*
now at: Laboratoire d’A ´erologie (LA), Universit ´e Paul Sabatier, CNRS, Toulouse, France Received: 18 July 2009 – Accepted: 12 August 2009 – Published: 29 September 2009 Correspondence to: J. Bechara ([email protected])
ACPD
9, 20309–20347, 2009Evidence of the impact of deep convection on reactive VOC
J. Bechara et al.
Title Page
Abstract Introduction
Conclusions References
Tables Figures
◭ ◮
◭ ◮
Back Close
Full Screen / Esc
Printer-friendly Version
Interactive Discussion
Abstract
A large dataset of reactive trace gases was collected for the first time over West Africa during the African Monsoon Multidisciplinary Analysis (AMMA) field experiment in Au-gust 2006. Volatile Organic Compounds (VOC from C5–C9) were measured onboard the two French aircrafts the ATR-42 and the Falcon-20 by a new instrument AMOVOC. 5
The goal of this study is (i) to characterize VOC distribution in the tropical region of West Africa (ii) to determine the impact of deep convection on VOC distribution and chemistry in the tropical upper troposphere (UT) and (iii) to characterize its spatial and temporal extensions. Experimental strategy consisted in sampling at altitudes be-tween 0 and 12 km downwind of Mesoscale Convective Systems (MCS) and at cloud 10
base. Biogenic and anthropogenic VOC distribution in West Africa is clearly affected by North to South emission gradient. Isoprene, the most abundant VOC, is at max-imum level over the forest (1.26 ppb) while benzene reaches its maxmax-imum over the urban areas (0.11 ppb). First, a multiple physical and chemical tracers approach using CO, O3and relative humidity was implemented to distinguish between convective and
15
non-convective air masses. Then, additional tools based on VOC observations (tracer ratios, proxy of emissions and photochemical clocks) were adapted to characterize deep convection on a chemical, spatial and temporal basis. VOC vertical profiles show a “C-shaped” trend indicating that VOC-rich air masses are transported from the sur-face to the UT by deep convective systems. VOC mixing ratios in convective outflow 20
are up to two times higher than background levels even for reactive and short-lived VOC (e.g. isoprene up to 0.19 ppb at 12 km-altitude) and are dependent on surface emission type. As a consequence, UT air mass reactivity increases from 0.52 s−1 in non-convective conditions to 0.95 s−1 in convective conditions. Fractions of boundary layer air contained in convective outflow are estimated to be 40±15%. Vertical trans-25
ACPD
9, 20309–20347, 2009Evidence of the impact of deep convection on reactive VOC
J. Bechara et al.
Title Page
Abstract Introduction
Conclusions References
Tables Figures
◭ ◮
◭ ◮
Back Close
Full Screen / Esc
Printer-friendly Version
Interactive Discussion
1 Introduction
Tropospheric ozone (O3) plays an essential role in determining the oxidizing capacity
of the atmosphere and contributes largely to the global greenhouse effect. It is a major tropospheric oxidant and controls global atmospheric chemistry. Tropospheric ozone production is considered to be mainly driven by carbon monoxide (CO) and volatile 5
organic compounds (VOC) oxidation in presence of nitrogen oxides (NOx) and
sun-light. Trace gases originate from both biogenic and anthropogenic emissions. Tropical regions are major sources of these ozone precursors and undergo intensive solar ra-diation. This induces highly active photochemistry leading to high ozone formation (Kesselmeier et al., 2000; Guenther et al., 2006; Saxton et al., 2007). Nevertheless, 10
the ozone budget is not well established yet over these regions due to complex cou-pling between chemical processes and dynamics. Indeed, significant deviations exist between observed and modeled global distribution of ozone in tropical regions (Martin et al., 2002; Stevenson et al., 2006). Moreover, modeling studies show discrepan-cies in ozone budgets when air masses are subject to deep convective events. Some 15
studies show an increase of up to 12% in the global ozone burden due to convective transport of gaseous precursors (Lawrence et al., 2003) while others show a decrease of 13 to 20% (Doherty et al., 2005; Lelieveld and Crutzen, 1994). In fact, all these stud-ies highlight that convective transport of gaseous precursors exhibit a critical impact on tropospheric ozone budget. In the last two decades, some observational campaigns 20
have been conducted worldwide to better understand the role of deep convection and its efficiency to transport gaseous species from the boundary layer to the upper tropo-sphere (UT). Many studies over mid-latitudes (Dickerson et al., 1987; Hauf et al., 1995; Pickering et al., 1988) showed that deep convection could pump low tropospheric air to the tropopause region and proved effective transport of trace gases (e.g. CO, O3; 25
ACPD
9, 20309–20347, 2009Evidence of the impact of deep convection on reactive VOC
J. Bechara et al.
Title Page
Abstract Introduction
Conclusions References
Tables Figures
◭ ◮
◭ ◮
Back Close
Full Screen / Esc
Printer-friendly Version
Interactive Discussion 2007) showed important influence of deep convection on VOC such as isoprene and
formaldehyde. All these field observations reported that UT trace gas levels related to convective events were significantly higher than background levels. Generally, up-drafts in deep convective systems have vertical speeds of 5 to 15 m s−1transporting air masses from low troposphere (LT) to the UT in about 30 min (Thompson et al., 1997; 5
Houze, 2004). Mixing, chemical loss and deposition appear negligible during vertical transport for major species like CO, NOx and VOC (methane, alkanes, alkenes, aro-matics . . . ). Finally, deep convection acts as an additional source of reactive trace gases in the middle and upper troposphere by fast injections at various levels including cloud top, e.g. 10–15 km or more. Indeed, when rapidly transported to the UT, atmo-10
spheric lifetimes of reactive trace gases are longer (Dickerson et al., 1987; Poisson et al., 2000) due to temperature decrease and lower OH concentrations. As a conse-quence, trace gases will persist longer, leading to delayed O3formation (Dickerson et
al., 1987). Gases with longer lifetimes (e.g. CO) can also travel far from source region due to higher wind speeds expanding the spatial scale of their influence on O3 and
15
HOx radicals production. But, models to observations deviations have highlighted the
lack of understanding of chemical and dynamical processes in tropical regions and the paucity of observations in these areas (Lelieveld and Crutzen, 1994; Lawrence et al., 2003; Doherty et al., 2005). Therefore, it is essential to collect new in-situ observation on atmospheric composition in tropical regions in order to better characterize on-going 20
chemical and dynamical processes.
West Africa has never been exhaustively explored up to now. It is a particularly sen-sitive region because of its location in the tropical belt and its contrasted land-surface characteristics (from bare soils in the Sahel to dense vegetation in the tropical forest) as well as dynamical, chemical and human interactions that modulate significantly trace 25
ACPD
9, 20309–20347, 2009Evidence of the impact of deep convection on reactive VOC
J. Bechara et al.
Title Page
Abstract Introduction
Conclusions References
Tables Figures
◭ ◮
◭ ◮
Back Close
Full Screen / Esc
Printer-friendly Version
Interactive Discussion solar heating of the equatorial zone. In the low layers (up to 3 km), a continental
north-easterly wind (Harmattan), warm and dry, converges with a south-westerly wet and colder wind (monsoon flow). In the middle troposphere, a distinct layer is established between 3 and 4 km by the African Easterly Jet (AEJ) around 15◦N which is an intense current reaching its utmost during the wet season. The AEJ allows westward air mass 5
transport. In the UT, another westward current, the Tropical Easterly Jet (TEJ), flows above the Sahel at about 16 km altitude during the wet season (Lafore and Moncrieff, 1989; Nicholson, 2009).
The African Monsoon Multidisciplinary Analysis (AMMA) is an international program that aims to improve our knowledge and understanding of the West African monsoon 10
and its variability. One of AMMA objectives is to determine the chemical composition of the middle and upper troposphere connected to deep convection events and to as-sess the ozone budget over West Africa (Mari and Prospero, 2005; Redelsperger et al., 2006). A Special Observation Period (SOP 2a2) took place in July and August 2006 during the monsoon season to fulfill these objectives. An overall review of the SOP 15
is related in Reeves et al., 2009). Within this framework, the purpose of our study is (i) to characterize VOC vertical and latitudinal distribution in the tropical troposphere over West Africa (ii) to determine the impact of deep convection on VOC distribution and chemistry in the tropical UT and (iii) to characterize its spatial and temporal exten-sions. This work is based on airborne observations of trace gases and reactive VOC, 20
collected on board the two French aircrafts, the ATR-42 and the Falcon-20 in August 2006. Various diagnostic tools (dynamical and chemical tracers, VOC tracer ratios, emission proxy, photochemical clocks) are set up and used together to investigate the impact of deep convection and its spatial and temporal characteristics. Section 2 il-lustrates briefly the campaign. Section 3 describes the instrumental set up. Section 4 25
reports VOC observations and their spatial distribution over the domain. Section 5 es-tablishes a set of conditions by using CO, O3and relative humidity (RH) as convection
ACPD
9, 20309–20347, 2009Evidence of the impact of deep convection on reactive VOC
J. Bechara et al.
Title Page
Abstract Introduction
Conclusions References
Tables Figures
◭ ◮
◭ ◮
Back Close
Full Screen / Esc
Printer-friendly Version
Interactive Discussion characteristics on the basis of VOC observations.
2 Field campaign and experimental strategy
SOP 2a2 took place in August 2006 during the monsoon season in West Africa. Mea-surements were performed by both French research aircraft ATR-42 and F-F20 based in Niamey (Niger) and operated by the French Service of Instrumented Aircraft for Envi-5
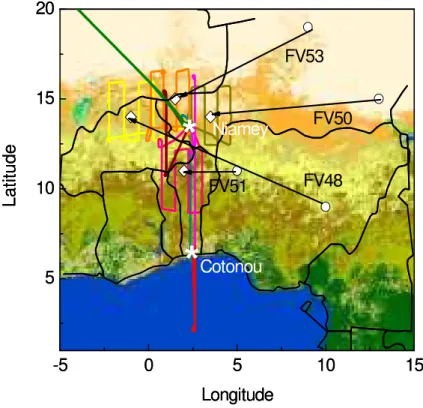
ronmental Research (SAFIRE). Flights were carried out between 2 and 21 August. The ATR-42 and F-F20 conducted 18 and 10 research flights, respectively, of 3 to 4 h each, from surface to 12 km. Flight details are reported in Table 1 and F-F20 flight tracks are shown in Fig. 1. Observations cover the region from 2 to 21◦N and from 10◦W to 7◦E. The domain displays different surface types with a strong North-to-South vegetation 10
gradient around 12◦N. Above these latitudes, the surface presents almost bare soils to a sahelian type. Below 12◦N, the surface presents an important tree coverage and vegetated surface. Main urban sites are Niamey (13.5◦N, 2.1◦E) in Niger and Cotonou (6.3◦N, 2.4◦E) in south Benin.
Flights fulfilled two objectives: (1) determination of the horizontal and vertical distri-15
bution of trace gases and (2) characterization of the air composition affected by MCS. Deploying two aircraft aimed at maximizing the horizontal and vertical geographical coverage of the region. The ATR-42 platform was set up to sample the LT up to 6 km and to perform flights before and after the passage of MCS. The F-F20 platform was used to sample the middle and upper troposphere up to 12 km and to explore MCS 20
outflow undertaking several flight tracks at increasing distances from the cloud anvil. Flights were planned according to meteorological forecast reports carried out by AC-MAD (African Centre of Meteorological Application for Development) as well as MCS tracking using Meteosat-IR images. On the 11, 14, 15 and 17 August, four MCS passed over Niamey and were explored by the F-F20. On the 18 August, an MCS passed over 25
con-ACPD
9, 20309–20347, 2009Evidence of the impact of deep convection on reactive VOC
J. Bechara et al.
Title Page
Abstract Introduction
Conclusions References
Tables Figures
◭ ◮
◭ ◮
Back Close
Full Screen / Esc
Printer-friendly Version
Interactive Discussion ditions as reference cases. Other flights by both aircrafts performed horizontal tracks
down to Cotonou and over Gulf of Guinea.
3 Aircraft instrumentation
The French aircraft were both equipped with instrumentation to measure major trace gases: CO, O3, NOx, and VOC (formaldehyde and non-methane hydrocarbons
5
(NMHC) from C5–C9 including alkanes, alkenes and aromatic compounds). Table 2 describes the instrumentation characteristics. NMHC were collected on cartridges us-ing a new offline automatic sampler AMOVOC (Airborne Measurement Of Volatile Or-ganic Compounds) developed at LISA (Bechara et al., 2008). AMOVOC was deployed simultaneously on both aircrafts. About 200 cartridges were collected using AMOVOC 10
during SOP 2a2. AMOVOC performs 10 min integrated in-situ sampling on solid ad-sorbents (Carbosieve SIII, Carbopack B, Carbotrap C) at pre-selected times intervals. Sampling is performed during horizontal flight tracks at 200 mL min−1 flow rate. Sam-ples were shipped to the laboratory in Creteil, France and analyzed by TDAS/GC-MS (Chromtech/Varian). Details of analytical procedures are also given by Bechara et al., 15
2008). In addition, state parameters of temperature, pressure and aircraft position (alti-tude, latitude and longitude), irradiance and relative humidity were measured using the standard Safire aircraft instrument package. For most of the instruments, signals were recorded at 1 Hz frequency.
4 NMHC distribution
20
ACPD
9, 20309–20347, 2009Evidence of the impact of deep convection on reactive VOC
J. Bechara et al.
Title Page
Abstract Introduction
Conclusions References
Tables Figures
◭ ◮
◭ ◮
Back Close
Full Screen / Esc
Printer-friendly Version
Interactive Discussion lifetime <1 day are isoprene, pentenes, xylenes and trimethylbenzenes. Lifetime of
these compounds is especially governed by photochemistry. Compounds with inter-mediate lifetimes of 1 to 3 days are C5–C8 alkanes, toluene and ethylbenzene. These compounds can undergo photochemistry and transport concurrently. The least reac-tive compound with relareac-tively long lifetime >3 days is benzene (lifetime ∼9 days). Its 5
concentration is primarily controlled by mixing and transport. Observed C5–C9 hydro-carbon concentrations ranged from 1.26 ppb (for isoprene) near the surface to values below detection limits (DL) (1–5 ppt). The most abundant NMHC and their mean val-ues are: isoprene (0.17 ppb), toluene (0.16 ppb) and hexane (0.13 ppb) in the LT and ethylbenzene (0.18 ppb), hexane (0.13 ppb) and toluene (0.13 ppb) in the UT. Only 5% 10
of the collected samples have values below DL.
4.1 NMHC latitudinal patterns
Figure 2 illustrates the north to south variability of some representative biogenic (iso-prene) and anthropogenic NMHC (trans-2-pentene being the most reactive NMHC and benzene being the least reactive one; Carter, 1994). Land surface impact on 15
NMHC mixing ratio variability is determined by considering data at altitudes below 2 km-altitude. Average mixing ratios and corresponding standard deviations over 1◦ latitudinal bins are reported in Fig. 2 using the log-normal distribution for statistical treatment. The number of samples in each latitude bin varies between 1 (at 7◦N) and 32 (at 12◦N). Standard deviation will then reflect the variability as well as the number of 20
samples collected. Biogenic and anthropogenic compounds show an opposite pattern due to surface characteristics.
Isoprene concentrations are at constant level (about 0.20 ppb) between 14 and 11◦N. Then, they show a clear increase between 11 and 7◦N to about 0.40 ppb over the forest areas. At lower latitude, around Cotonou (6.3◦N) and over the ocean, isoprene 25
levels decrease to less than 0.10 ppb between 7 and 5◦N. This trend clearly shows that biogenic isoprene is modulated by the vegetation gradient observed in West Africa.
ACPD
9, 20309–20347, 2009Evidence of the impact of deep convection on reactive VOC
J. Bechara et al.
Title Page
Abstract Introduction
Conclusions References
Tables Figures
◭ ◮
◭ ◮
Back Close
Full Screen / Esc
Printer-friendly Version
Interactive Discussion 0.11 ppb for benzene and 0.05 ppb for trans-2-pentene) near urban sites (Cotonou at
6.3◦N and Niamey at 13.5◦N). Mean levels decrease above the forest between 11 and 7◦N reaching about 0.06 ppb for benzene and 0.02 ppb for 2-pentene. The trans-2-pentene decrease is more pronounced than benzene due to its higher reactivity.
Finally, LT content is tightly related to surface coverage. The contrasted surface 5
coverage is a key factor influencing NMHC concentration gradients in West Africa.
4.2 NMHC vertical patterns
Vertical profiles for a selection of representative NMHC are plotted in Fig. 3. All ob-servations as well as mean values in 1 km altitudinal bins are reported. The number of samples in each altitude bin varies between 4 and 51. Average mixing ratios and 10
corresponding standard deviation in each altitude bin are calculated using log-normal distribution. The magnitude of standard deviation reflects the variability and the num-ber of samples collected in each bin. Mixing ratios in air masses below 2 km-altitude show a large variability depicting the influence of surface emissions (Sect. 4.1). In the mid troposphere, mixing ratios tend to decrease with altitude. But, the vertical gradient 15
is not of similar magnitude and shape for the different species.
Short-lived compounds exhibit a decrease with altitude (e.g. isoprene, trans-2-pentene). Relatively long-lived compounds (few days) show a homogeneous vertical profile (e.g. pentane, benzene, toluene, hexane in Fig. 3) attesting of the well-mixed column and the redistribution of surface emission in the higher layers.
20
A distinct layer is detected between 3 and 4 km. In this layer significant concen-trations are measured. At this level, air masses are attributed to AEJ transporting air masses from the East (e.g. from Chad, Soudan). Another marked layer is met at about 9 km with high concentrations of pentane, benzene, toluene, hexane, octane, xylenes, ethylbenzene and trimethylbenzenes. These compounds that could originate 25
ACPD
9, 20309–20347, 2009Evidence of the impact of deep convection on reactive VOC
J. Bechara et al.
Title Page
Abstract Introduction
Conclusions References
Tables Figures
◭ ◮
◭ ◮
Back Close
Full Screen / Esc
Printer-friendly Version
Interactive Discussion Southern Hemisphere where biomass burning is intense during this period.
In the UT (10–12 km), samples with high mixing ratios even for short-lived NMHC are encountered conferring a “C”-shaped profile to the NMHC vertical distribution. For in-stance, the reactive isoprene is detected at a maximum of 0.20 ppb on-board the F-F20 at 12 km-height even though it was thought to be present only near the surface where 5
biogenic sources are important (Sect. 4.1). Moreover, short-lived aromatic compounds (1,2,3-trimethylbenzene, Fig. 3), show high concentrations in the UT compared to LT levels. Additional enrichment by long range transport from eastern countries is sus-pected as seen from back trajectories calculations by Ancellet et al. (2009). Such sig-nificant levels reveal that MCS might have influenced the free troposphere by uplifting 10
NMHC from the lower troposphere. Although concentration levels generally decrease with altitude, significant levels were observed during this campaign, in the middle and upper troposphere. In fact, the tropical troposphere is thought to be frequently influ-enced by recent convective activity, transporting important levels of these species to the upper layers.
15
Finally, NMHC profile analysis highlights factors that concurrently influence NMHC distribution over West Africa: chemical loss, long range transport of polluted air masses, deep convection and biomass burning intrusion in the region.
5 Indicators used for classification of MCS impacted air masses
Sampled air masses in the UT have different origins (convective transport, biomass 20
burning or long range transport) that could impact trace gases variability as revealed by NMHC observations in Sect. 4. Air masses classification is essential in order to distinguish between conditions perturbed by convection from those non-perturbed by convection. For that purpose, a multiple chemical and physical tracers approach has been taken using CO, O3and RH as indicators. Apart from their properties that will be
25
ACPD
9, 20309–20347, 2009Evidence of the impact of deep convection on reactive VOC
J. Bechara et al.
Title Page
Abstract Introduction
Conclusions References
Tables Figures
◭ ◮
◭ ◮
Back Close
Full Screen / Esc
Printer-friendly Version
Interactive Discussion days for O3) (Dickerson et al., 1987; Dessler, 2002; Folkins et al., 2002; Lawrence and
Salzmann, 2008).
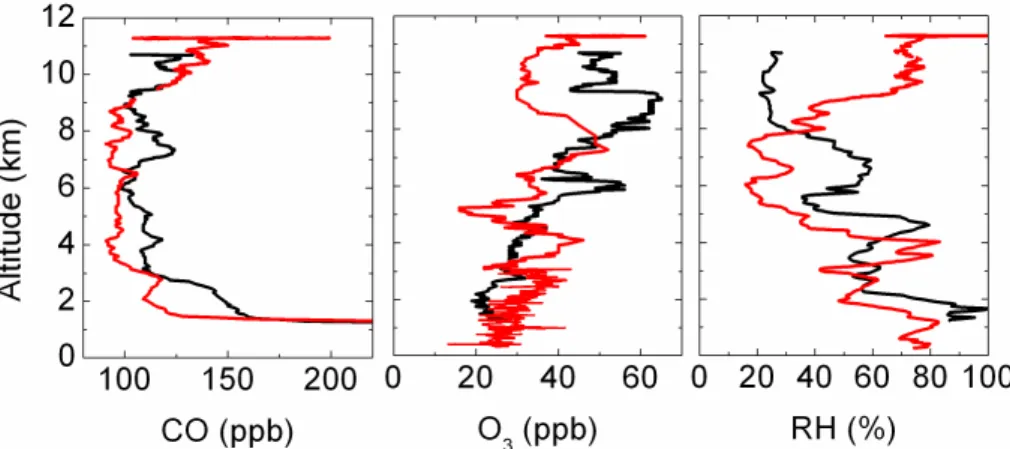
Convective conditions are characterized by concurrent high CO, low O3and high RH
in the air masses (Fig. 4, red lines). CO concentrations might reach 200 ppb, almost as large as those observed in LT, giving a “C”-shaped profile to CO vertical distribution. 5
O3 values are lower in MCS outflow (30 ppb) than outside it (50 ppb) because of the
input of low-O3 air masses from near the surface. O3 follows an “S-shaped” profile in convective situations. RH is enhanced in the UT reaching values up to 80% as a signature of cloud presence as well as uplift of humid air masses from surface layers. These concomitant alterations in tracer levels point out important uplift of LT air by the 10
MCS up to the UT and characterize convective air masses.
Average CO, O3 and RH vertical patterns collected during all deployments of the
ATR-42 and the F-F20 are discussed in details in Reeves et al. (2009) and Ancellet et al. (2009). Here, only average features are described. CO is produced primarily by incomplete combustion through urban areas and biomass burning emissions. Its 15
major sink is the reaction with OH, followed by surface deposition (Hauglustaine et al., 1998; Granier et al., 2000). Because CO is destroyed through the troposphere, its concentrations are expected to decrease with altitude. In typical average background conditions during SOP 2a2, CO shows values of about 120±18 ppb in LT increasing to 200 ppb over the two main cities (Niamey, Cotonou) (Fig. 4). In upper layers (4–12 km), 20
CO gradually decreases to 100±10 ppb.
Tropospheric O3is in situ produced in situ through NOx, VOC and CO
photochem-istry and, to a lesser extent, due to stratospheric intrusions. The major O3 sink is surface deposition. As a consequence, O3 is expected to increase with altitude.
Dur-ing SOP 2a2, average LT O3concentrations show relatively little variation with values
25
of 30±10 ppb. The lowest values (20 ppb) were detected above the forest region (7– 11◦N) where O3 deposition is enhanced by vegetation. Highest values (70 ppb) were
detected near the urban sites of Niamey and Cotonou. In upper layers (2–12 km), O3
ACPD
9, 20309–20347, 2009Evidence of the impact of deep convection on reactive VOC
J. Bechara et al.
Title Page
Abstract Introduction
Conclusions References
Tables Figures
◭ ◮
◭ ◮
Back Close
Full Screen / Esc
Printer-friendly Version
Interactive Discussion Water vapor as indicated by RH gives valuable information on cloud location. In
average conditions, RH shows high values (70%) in LT particularly above the tropical forest influenced by the wet monsoon flow at latitudes south of 13◦N. North of these latitudes, air masses are dryer (30%) due to the arid surface and the influence of the warm and dry Harmattan flow. With altitude, air mass layers get dryer up to 20% RH. 5
Non-convective conditions showing profiles as described above were encountered on 13 and 20 August 2006 (Fig. 4, black lines). Any shape deviation from average profiles can be considered as conditions perturbed by convection or other causes but concomitant variations of tracer vertical shapes are considered as a situation perturbed by convection (Fig. 4, red lines). A summary of the variation of convection indicators for 10
each F-F20 flight is given in Table 3. Four cases were identified on 11, 14, 15 and 17 August 2006 corresponding to outflow explorations where the F-F20 flew in the active MCS. Air masses influenced by biomass burning intrusions have been also detected on the vertical profiles with high CO levels up to 180 ppb at 9 km on 19 August near Cotonou (Ancellet et al., 2009). These enhancements are associated with increased 15
O3levels and lower RH showing that the use of a single tracer (e.g. CO) is not sufficient
for convective case distinction.
Finally, the successful use of multiple chemical and physical indicators made possi-ble a fine distinction between air masses in the cloud outflow perturbed by convection from those outside the outflow and not perturbed by convection (Table 3).
20
6 NMHC in the upper troposphere under convective and non-convective condi-tions
6.1 Evidence of deep convection impact on NMHC in the UT
To address impact of convective injections on NMHC distribution in the UT, we exam-ined: (i) horizontal NMHC distribution, (ii) total NMHC content and (iii) surface NMHC 25
ACPD
9, 20309–20347, 2009Evidence of the impact of deep convection on reactive VOC
J. Bechara et al.
Title Page
Abstract Introduction
Conclusions References
Tables Figures
◭ ◮
◭ ◮
Back Close
Full Screen / Esc
Printer-friendly Version
Interactive Discussion (i) Horizontal NMHC distribution was examined in the UT along F-F20 MCS flight
tracks (e.g. MCS of the 15 August 2006 in Fig. 5 for benzene, toluene and isoprene). NMHC observations are sparse and 10-min-integrated. We overlaid NMHC sampling points on CO, O3 and RH data because of their higher measurement frequency (1 s). First, CO shows an important longitudinal positive gradient through the outflow with an 5
increasing trend going up by 30%. Mean CO longitudinal gradient for the four MCS is 13±3 ppb.◦E (e.g. 20 ppb.◦E on the 15 August flight described in Fig. 5). Gradient calculations are based on observations on the 4 parallel legs made when exploring the MCS. Secondly, no O3 gradient is observed in the outflow but O3 concentrations are
sensitive to cloud position. They are smaller inside the outflow (about 45 ppb) than out-10
side it (about 60 ppb) because of the injection of low-O3and humid air masses from LT. The absence of trend in O3observations points out the dual nature of tropical
convec-tion. Convection impact on O3distribution almost shows a negative trend locally but fills
the UT with O3precursors that will potentially lead to delayed O3production downwind the MCS (Folkins et al., 2002). Finally, RH values are also sensitive to MCS inflow and 15
outflow position with higher values close to saturation inside the MCS (>80%). Com-pared to convection tracers, NMHC observations do not exhibit any meaningful trend. Values show great variability without any horizontal gradient.
(ii) While NMHC longitudinal distribution do not show a clear trend, total NMHC con-tent is clearly affected by convection compared to non perturbed conditions. Box plots 20
are reported for selected NMHC in Fig. 6 and sorted by non-convective, convective UT and LT observations. For all NMHC, mixing ratio distributions are more scattered in convective cases and similar to LT distribution. In non-convective cases, distribution is tighter. Average UT mixing ratios can double in convective outflow compared to non-perturbed air masses. Mixing ratios variability is different from one NMHC to another 25
as well as from an MCS to another illustrating the heterogeneity of these systems. Nevertheless, NMHC concentrations are significantly enhanced by convective injection in the UT. Moreover these injections are dissimilar all over the convective cloud anvil.
ACPD
9, 20309–20347, 2009Evidence of the impact of deep convection on reactive VOC
J. Bechara et al.
Title Page
Abstract Introduction
Conclusions References
Tables Figures
◭ ◮
◭ ◮
Back Close
Full Screen / Esc
Printer-friendly Version
Interactive Discussion emissions. Since vegetation gradient and surface coverage are critical factors
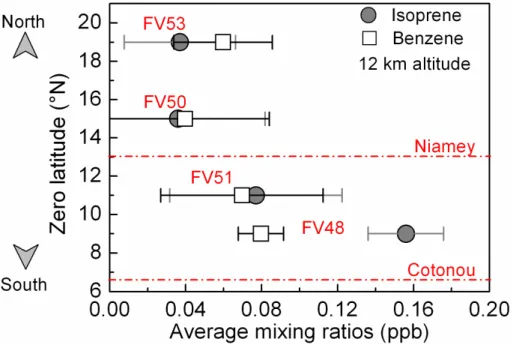
govern-ing NMHC latitudinal composition (see Sect. 4.1), we investigated surface emissions influence on NMHC outflow composition. Satellite MCS tracking images provide infor-mation on the region where the MCS started to develop as well as its trajectory before being sampled. As MCS have westward motion, the latitude where they started to 5
develop (called latitude zero here after) indicates the nature of the surface it passed through and is used as a proxy of emissions (Fig. 1). On 11 August, the MCS started to develop above Nigeria over a forested region and passed over Benin before being sampled around Niamey (FV48). On 14 August, the MCS started to develop east of Niamey above Sahel and moved westward to Niamey where it was explored (FV50). 10
On 15 August, the MCS developed over a forested region in Benin and was explored south of Niamey (FV51). On 17 August, the MCS started to develop in the A¨ır region north of Niamey above Sahel (FV53). Mean NMHC levels for isoprene and benzene in the MCS outflow are reported according to latitude zero in Fig. 7. Isoprene levels show exponential dependence on surface characteristics. Both MCS that developed 15
over forested regions (FV48 and FV51) have isoprene content up to three times higher than the MCS that developed over the Sahel (FV50 and FV53). A different trend is ob-served for anthropogenic compounds such as benzene. Average benzene contents are rather homogeneous regarding the 4 MCS. Indeed, urban areas, which are benzene main sources in the domain, are limited and located at specific spots (Niamey 13◦51 N– 20
2.11◦E, Cotonou 6.3◦N–2.4◦E, Lagos 6.4◦N–3.4◦E) while vegetation coverage follows a smooth north to south gradient. These observations highlight the influence of surface sources on the UT NMHC content mediated by convection.
The investigation of NMHC content in non-convective vs. convective conditions and its dependence on surface coverage reveals that deep convection increases NMHC 25
ACPD
9, 20309–20347, 2009Evidence of the impact of deep convection on reactive VOC
J. Bechara et al.
Title Page
Abstract Introduction
Conclusions References
Tables Figures
◭ ◮
◭ ◮
Back Close
Full Screen / Esc
Printer-friendly Version
Interactive Discussion
6.2 Photochemistry vs. transport regimes in West Africa UT for NMHC
Being reactive species, NMHC can be used as tracers of photochemical and transport processes governing trace gases variability. In particular, NMHC ratios with common sources and different atmospheric lifetimes provide further information on the degree of atmospheric processing in sampled air masses. NMHC ratios are then useful pho-5
tochemical clocks to follow transport and ageing of air masses (Borbon et al., 2004). We examined trans-2-pentene to benzene and toluene vs. benzene ratios from UT observations to differentiate regimes controlling NMHC distribution. Natural logarithms of trans-2-pentene/benzene vs. toluene/benzene ratios are plotted in Fig. 8. Trans-2-pentene is one of the most reactive measured NMHC (lifetime of few hours), toluene 10
is of medium reactivity (lifetime of 2 days) and benzene is the least reactive NMHC (lifetime of 9 days). The least reactive NMHC (benzene) being at the denominator, the fresher air masses are, the greater the ratios are. Clearly, two sets of points are distinguished depending on non-convective situations (black) and convective situations (red). Each data set shows a linear relationship with correlation factor of 0.60 and 0.77, 15
respectively. Data in non-convective situations are scattered along toluene/benzene axis and have a slope of 1.16. This agrees well with aged air masses composition with low trans-2-pentene mixing ratios close to DL after several days of photochemical processing. The scatter plot in the convective situation is more diffuse with greater data variability along toluene/benzene axis as well as along trans-2-pentene/benzene axis. 20
Ratios display the highest ratios values and the slope exhibits a greater value (2.87) illustrating the freshness of sampled convective outflow enriched with reactive species such as trans-2-pentene. UT NMHC concentrations are thus governed by two distinct regimes that are affected by convective injections. Even with the complexity of the different processes in the upper tropospheric region, NMHC ratio enables a qualitative 25
ACPD
9, 20309–20347, 2009Evidence of the impact of deep convection on reactive VOC
J. Bechara et al.
Title Page
Abstract Introduction
Conclusions References
Tables Figures
◭ ◮
◭ ◮
Back Close
Full Screen / Esc
Printer-friendly Version
Interactive Discussion
6.3 Impact of deep convection on air mass reactivity
OH reactivity is used to evaluate the contribution of measured NMHC to photochemical activity. OH reactivity is also an indicator of the O3 chemical production contribution.
Here, estimated reactivity is based on NMHC measurements on board the ATR-42 and the F-F20. Individual NMHC reactivity (ROH,i) is calculated using Eq. (1):
5
ROH,i=kOH,i[NMHCi] (1)
whereki,OH is the OH reaction rate coefficients for every NMHC taken from Atkinson
(2003); Atkinson et al. (2006) and calculated for LT and UT temperatures; [NMHCi] is
the mixing ratio of the target observed NMHC.
Total NMHC reactivity (ROH,total) is derived from the sum of individual Ri,OH using
10
Eq. (2).
ROH,total= X
ROH,i (2)
While this approach gives a practical estimate of the contribution of measured NMHC to the atmospheric photochemistry; it does not explain the full atmospheric chemistry of the considered compounds.
15
UT air mass reactivity calculated for convective cases is compared to air masses reactivity for non-convective cases and for the LT (Fig. 10). In non-convective con-ditions, UT ROH,total is 0.52±0.21 s
−1
while it raises in convective conditions up to 0.95±0.66 s−1. Thus, air masses reactivity is enhanced by 40% in the UT due to injec-tion of reactive NMHC. During convective events, UTROH,total is a similar value to the
20
LT one which equals 0.82±0.53 s−1.
The relative contribution of each NMHC, CO and O3toROH,totalis evaluated
ACPD
9, 20309–20347, 2009Evidence of the impact of deep convection on reactive VOC
J. Bechara et al.
Title Page
Abstract Introduction
Conclusions References
Tables Figures
◭ ◮
◭ ◮
Back Close
Full Screen / Esc
Printer-friendly Version
Interactive Discussion other NMHC contributions is 30% in LT and 50% in the UT. As expected, O3 and CO
exhibit a negligible contribution of a few percent (<5%).
These results show that NMHC play an important role in air masses reactivity and UT photochemical potential which is expected to induce changes in ozone chemistry.
6.4 Fraction of low tropospheric air in fresh convective outflow
5
To obtain a quantitative evaluation on vertical transport impact and to assess to the extent to which the LT air affects the UT; we calculated the fraction f of LT air in the fresh convective outflow. To calculate f, we applied NMHC observations to Eq. (3) adapted from Bertram et al., 2007).
f = [UT]outflow−[UT]bckgrd [LT]−[UT]bckgrd
(3) 10
where [UT]outflowis the mean mixing ratio of a selected specie in fresh convective
out-flow, [UT]bckgrdis the mean mixing ratio in non-convective UT and [LT] is near-surface
mean mixing ratio (below 2 km) according to the latitudinal gradient and MCS trajec-tory using “latitude zero” (cf. Sect. 6.1). The method presumes that photochemical loss is negligible during vertical transport, chemical lifetimes of species being longer 15
or equivalent to vertical transport timescales (∼30 min). First, we calculatedf for each individual NMHC. Then we averagedf combining all the individual results for each of the 4 MCS (Fig. 11, left). The overall mean off is about 40±15% (Fig. 11). Results are consistent regarding the 4 MCS explored during SOP 2a2 as well as with other studies at mid-latitude (10 to 40% by Ray et al., 2004; 17% by Bertram et al., 2007) and in 20
ACPD
9, 20309–20347, 2009Evidence of the impact of deep convection on reactive VOC
J. Bechara et al.
Title Page
Abstract Introduction
Conclusions References
Tables Figures
◭ ◮
◭ ◮
Back Close
Full Screen / Esc
Printer-friendly Version
Interactive Discussion
6.5 Vertical transport timescale during convective events
Vertical transport timescale estimation is based on an original approach using the pho-tochemical processing equation with isoprene and benzene observations. Here, we assume that photochemical loss of isoprene is of similar timescale to that of a convec-tive event. Therefore, isoprene (lifetime of few hours) is considered to be an efficient 5
tracer of vertical transport. Consequently, a calculated time based on the photochemi-cal processing equation can be attributed to the vertiphotochemi-cal pumping timesphotochemi-cale. Depending on the reactivity of the species relative to OH, the photochemical age∆tcan be deter-mined by Eq. (4),
∆t= ln
"
IsopreneBenzene
PBL
IsopreneBenzene
UT
#
(ki−kb) [OH]
(4) 10
where [isoprene] and [benzene] are the mixing ratio of isoprene and benzene in LT and in the convective outflow, ki and kb are the OH reaction rate
constants for isoprene and benzene, respectively (ki=1.0×10
−10
cm3molec−1s−1; kb=1.2×10
−12
cm3molec−1s−1; taken from Atkinson, 2003; Atkinson et al., 2006) and [OH] is OH radical mean concentration assumed to be 2×10⁶molecules cm−3 15
(Lawrence et al., 2003).∆t ranges from 12 to 36 min for the 4 MCS with an average of 25±10 min (Fig. 11, right). Results are consistent with the expected timescale of ver-tical transport by deep convection (15–20 min) derived from typical verver-tical velocities (5–15 m s−1) (Fig. 11) and with modeling studies by Thompson et al. (1997) (30 min). The use of photochemical processing equation based on isoprene and benzene ratios 20
ACPD
9, 20309–20347, 2009Evidence of the impact of deep convection on reactive VOC
J. Bechara et al.
Title Page
Abstract Introduction
Conclusions References
Tables Figures
◭ ◮
◭ ◮
Back Close
Full Screen / Esc
Printer-friendly Version
Interactive Discussion
7 Conclusions
Airborne measurements of tropospheric trace gases species collected by the two French aircrafts during AMMA SOP 2a2 in August 2006 are presented in this paper. These observations constitute a unique data set combining lower and upper tropo-spheric measurements over a large domain in West Africa. In particular, VOC (NMHC 5
from C5 to C9) are reported from the boundary layer to the UT.
First, NMHC distributions were investigated. NMHC latitudinal distribution is closely connected to land surface characteristics over West Africa with an important north-to-south gradient going from bare soils over Sahel (North) to the tropical forest (South) with limited urban sites (Niamey and Cotonou). Biogenic compound concentrations 10
(isoprene) exhibit an important north-to-south gradient following vegetation densifica-tion. Anthropogenic species concentrations are at maximum levels over urban sites and decrease over the forest. Vertical NMHC distributions show a “C-shaped” profile with significant UT concentrations due to convective injections and comparable to those observed near the surface, even for the most reactive NMHC.
15
Then, various diagnostics tools were set up and successfully applied to highlight the impact and characteristics of deep convection on NMHC. CO, O3 and RH were used
as simultaneous deep convection indicators to isolate convection impacted air masses. UT NMHC concentrations in WA appear to be controlled by two regimes: photochem-istry and fast convective vertical transport. NMHC UT concentrations double when 20
subject to convection and are dependent on MCS geographical origin, used as a proxy of surface type, indicating the vertical transport of near-surface air masses. As a con-sequence, UT total air masses reactivity regarding OH radical doubles in convective conditions (0.95 s−1) compared to non-convective conditions (0.52 s−1) and reaches values similar to LT reactivity (0.82 s−1). Furthermore, isoprene plays an important role 25
in total reactivity throughout the vertical tropospheric column, especially in convective outflow explaining 27% of UT total reactivity.
ACPD
9, 20309–20347, 2009Evidence of the impact of deep convection on reactive VOC
J. Bechara et al.
Title Page
Abstract Introduction
Conclusions References
Tables Figures
◭ ◮
◭ ◮
Back Close
Full Screen / Esc
Printer-friendly Version
Interactive Discussion derived from NMHC observations were estimated to be 40±15% and 25±10 min,
re-spectively.
NMHC observations during AMMA reveal the potential impact of deep convection on UT chemistry. Even though ozone production was not directly observed because no flight was performed in aged outflow, post convective ozone formation is expected 5
due to injection of reactive ozone precursors in the UT. Andr ´es-Hern ´andez et al. (2009) show this ozone formation in MCS outflow during flights performed on-board the DLR-F20 within AMMA campaign and estimate O3production rates around 1 ppb h
−1
in the MCS outflow.
Observations like those related in this paper are essential in order to assess the 10
global impact of deep convection on ozone and other photooxidant production. Beyond characterizing local chemical effects, such observations build a database that can be used for relevant parameterization of mesoscale and global CTM models. In particular, deep convection spatial and temporal characteristics derived from NMHC observation in WA will be useful indicators for guiding model parameterizations.
15
Acknowledgement. This work is supported by the AMMA project. Based on a French initia-tive, AMMA was built by an international scientific group and is currently funded by a large number of agencies, especially from France, UK, US and Africa. It has been the beneficiary of a major financial contribution from the European Community’s Sixth Framework Research Program. Detailed information on scientific coordination and funding is available on the AMMA
20
International web site http://www.amma-international.org. We would like also to thank SAFIRE (Service des Avions Franc¸ais Instrument ´es pour la Recherche en Environnement) for deploying the research aircrafts.
References
Ancellet, G., Leclair de Bellevue, J., Mari, C., Nedelec, P., Kukui, A., Borbon, A., and Perros, P.:
25
ACPD
9, 20309–20347, 2009Evidence of the impact of deep convection on reactive VOC
J. Bechara et al.
Title Page
Abstract Introduction
Conclusions References
Tables Figures
◭ ◮
◭ ◮
Back Close
Full Screen / Esc
Printer-friendly Version
Interactive Discussion Andr ´es-Hern ´andez, M. D., Kartal, D., Reichert, L., Burrows, J. P., Meyer Arnek, J., et al.:
Per-oxy radical observations overWest Africa during AMMA 2006: Photochemical activity in the outflow of convective systems, Atmos. Chem. Phys., 9, 3681–3695, 2009,
http://www.atmos-chem-phys.net/9/3681/2009/.
5
Atkinson, R.: Kinetics of the gas-phase reactions of OH radicals with alkanes and cycloalkanes, Atmos. Chem. Phys., 3, 2233–2307, 2003, http://www.atmos-chem-phys.net/3/2233/2003/. Atkinson, R., Baulch, D. L., Cox, R. A., Crowley, J. N., Hampson, R. F., et al.: Evaluated
kinetic and photochemical data for atmospheric chemistry: Volume II – gas phase reac-tions of organic species, Atmos. Chem. Phys., 6, 3625–4055, 2006,
http://www.atmos-chem-10
phys.net/6/3625/2006/.
Bechara, J., Borbon, A., Jambert, C., and Perros, P. E.: New off-line aircraft instrumentation for non-methane hydrocarbon measurements, Anal. Bioanal. Chem., 392, 865–876, 2008. Bertram, T. H., Perring, A. E., Wooldridge, P. J., Crounse, J. D., Kwan, A. J., et al.: Direct
measurements of the convective recycling of the upper troposphere, Science, 315, 816–820,
15
2007.
Borbon, A., Coddeville, P., Locoge, N., and Galloo, J. C.: Characterising sources and sinks of rural VOC in eastern France, Chemosphere, 57, 931–942, 2004.
Carter, W. P. L.: Development of ozone reactivity scales for volatile organic-compounds, J. Air Waste Manag. Assoc., 44, 881–899, 1994.
20
Cohan, D. S., Schultz, M. G., Jacob, D. J., Heikes, B. G., and Blake, D. R.: Convective injection and photochemical decay of peroxides in the tropical upper troposphere: Methyl iodide as a tracer of marine convection, J. Geophys. Res.-Atmos., 104(D4), 5717–5724, 1999. Colomb, A., Williams, J., Crowley, J., Gros, V., Hofmann, R., et al.: Airborne measurements of
trace organic species in the upper troposphere over Europe: the impact of deep convection,
25
Environ. Chem., 3, 244–259, 2006.
Dessler, A. E.: The effect of deep, tropical convection on the tropical tropopause layer, J. Geo-phys. Res., 107(D3), 4033, doi:10.1029/2001JD000511, 2002.
Dickerson, R. R., Huffman, G. J., Luke, W. T., Nunnermacker, L. J., Pickering, K. E., et al.: Thunderstorms – an important mechanism in the transport of air-pollutants, Science, 235,
30
460–464, 1987.
ACPD
9, 20309–20347, 2009Evidence of the impact of deep convection on reactive VOC
J. Bechara et al.
Title Page
Abstract Introduction
Conclusions References
Tables Figures
◭ ◮
◭ ◮
Back Close
Full Screen / Esc
Printer-friendly Version
Interactive Discussion Fischer, H., de Reus, M., Traub, M., Williams, J., Lelieveld, J., et al.: Deep convective injection
of boundary layer air into the lowermost stratosphere at midlatitudes, Atmos. Chem. Phys., 3, 739–745, 2003, http://www.atmos-chem-phys.net/3/739/2003/.
Folkins, I., Braun, C., Thompson, A. M., and Witte, J.: Tropical ozone as an indicator of deep
5
convection, J. Geophys. Res.-Atmos., 107(D13), 4184, doi:10.1029/2001JD001178, 2002. Ganzeveld, L., Eerdekens, G., Feig, G., Fischer, H., Harder, H., et al.: Surface and
bound-ary layer exchanges of volatile organic compounds, nitrogen oxides and ozone during the GABRIEL campaign, Atmos. Chem. Phys., 8, 6223–6243, 2008,
http://www.atmos-chem-phys.net/8/6223/2008/.
10
Granier, C., P ´etron, G., M ¨uller, J.-F., and Brasseur, G.: The impact of natural and anthropogenic hydrocarbons on the tropospheric budget of carbon monoxide, Atmos. Environ., 34, 5255– 5270, 2000.
Guenther, A., Karl, T., Harley, P., Wiedinmyer, C., Palmer, P. I., and Geron, C.: Estimates of global terrestrial isoprene emissions using MEGAN (Model of Emissions of Gases and
15
Aerosols from Nature), Atmos. Chem. Phys., 6, 3181–3210, 2006, http://www.atmos-chem-phys.net/6/3181/2006/.
Hao, W. M., Ward, D. E., Olbu, G., and Baker, S. P.: Emissions of CO2, CO, and hydrocar-bons from fires in diverse African savanna ecosystems, J. Geophys. Res., 101(D19), 23577– 23584, 1996.
20
Hauf, T., Schulte, P., Alheit, R., and Schlager, H.: Rapid vertical trace gas transport by an isolated midlatitude thunderstorm, J. Geophys. Res., 100, 22957–22970, 1995.
Hauglustaine, D. A., Brasseur, G. P., Walters, S., Rasch, P. J., Muller, J. F., Emmons, L. K., and Carroll, C. A.: MOZART, a global chemical transport model for ozone and related chemical tracers 2. Model results and evaluation, J. Geophys. Res., 103(D21), 28291–28335, 1998.
25
Houze, R. A.: Mesoscale convective systems, Rev. Geophys., 42, RG4003, doi:10.1029/2004RG000150, 2004.
Karl, T. G., Christian, T. J., Yokelson, R. J., Artaxo, P., Hao, W. M., and Guenther, A.: The tropical forest and fire emissions experiment: method evaluation of volatile organic compound emis-sions measured by PTR-MS, FTIR, and GC from tropical biomass burning, Atmos. Chem.
30
Phys., 7, 5883–5897, 2007, http://www.atmos-chem-phys.net/7/5883/2007/.
ACPD
9, 20309–20347, 2009Evidence of the impact of deep convection on reactive VOC
J. Bechara et al.
Title Page
Abstract Introduction
Conclusions References
Tables Figures
◭ ◮
◭ ◮
Back Close
Full Screen / Esc
Printer-friendly Version
Interactive Discussion Lafore, J. P., and Moncrieff, M. W.: A numerical investigation of the organization and interaction
of the convective and stratiform regions of tropical squall lines, J. Atmos. Sci., 46, 521–544, 1989.
Lawrence, M. G., and Salzmann, M.: On interpreting studies of tracer transport by deep
cumu-5
lus convection and its effects on atmospheric chemistry, Atmos. Chem. Phys., 8, 6037–6050, 2008, http://www.atmos-chem-phys.net/8/6037/2008/.
Lawrence, M. G., von Kuhlmann, R., Salzmann, M., and Rasch, P. J.: The balance of ef-fects of deep convective mixing on tropospheric ozone, Geophys. Res. Lett., 30, 1940, doi:10.1029/2003GL017644, 2003.
10
Lelieveld, J., and Crutzen, P. J.: Role of deep cloud convection in the ozone budget of the troposphere, Science, 264, 1759–1761, 1994.
Mari, C. H., Cailley, G., Corre, L., Saunois, M., Attie, J. L., Thouret, V., and Stohl, A.: Tracing biomass burning plumes from the Southern Hemisphere during the AMMA 2006 wet season experiment, Atmos. Chem. Phys., 8, 3951–3961, 2008,
15
http://www.atmos-chem-phys.net/8/3951/2008/.
Martin, R. V., Jacob, D. J., Logan, J. A., Bey, I., Yantosca, R. M., et al.: Interpretation of TOMS observations of tropical tropospheric ozone with a global model and in situ observations, J. Geophys. Res.-Atmos., 107, 4351, doi:10.1029/2001JD001480, 2002.
Nedelec, P., Cammas, J. P., Thouret, V., Athier, G., Cousin, J. M., et al.: An improved
in-20
frared carbon monoxide analyser for routine measurements aboard commercial Airbus air-craft: technical validation and first scientific results of the MOZAIC III programme, Atmos. Chem. Phys., 3, 1551–1564, 2003, http://www.atmos-chem-phys.net/3/1551/2003/.
Nicholson, S. E.: A revised picture of the structure of the “monsoon” and land ITCZ over West Africa, Clim. Dynam., 32, 1155–1171, 2009.
25
Pickering, K. E., Dickerson, R. R., Huffman, G. J., Boatman, J. F., and Schanot, A.: Trace Gas-Transport in the Vicinity of Frontal Convective Clouds, J. Geophys. Res., 93(D1), 759–773, 1988.
Poisson, N., Kanakidou, M., and Crutzen, P. J.: Impact of non-methane hydrocarbons on tro-pospheric chemistry and the oxidizing power of the global troposphere: 3-dimensional
mod-30
elling results, J. Atmos. Chem., 36, 157–230, 2000.
ACPD
9, 20309–20347, 2009Evidence of the impact of deep convection on reactive VOC
J. Bechara et al.
Title Page
Abstract Introduction
Conclusions References
Tables Figures
◭ ◮
◭ ◮
Back Close
Full Screen / Esc
Printer-friendly Version
Interactive Discussion doi:10.1029/2004JD004655, 2004.
Redelsperger, J. L., Thorncroft, C. D., Diedhiou, A., Lebel, T., Parker, D. J., and Polcher, J.: African monsoon multidisciplinary analysis – An international research project and field cam-paign, B. Am. Meteor. Soc., 87, 1739–1746, 2006.
5
Reeves, C. E., Ancellet, G., Attie, J.-L., Bechara, J., Borbon, A., et al.: Chemical characterisa-tion of the West Africa Monsoon during AMMA, Atmos. Chem. Phys. Discuss., 9, 1585–1619, 2009, http://www.atmos-chem-phys-discuss.net/9/1585/2009/.
Saxton, J. E., Lewis, A. C., Kettlewell, J. H., Ozel, M. Z., Gogus, F., et al.: Isoprene and monoter-pene measurements in a secondary forest in northern Benin, Atmos. Chem. Phys., 7, 4095–
10
4106, 2007, http://www.atmos-chem-phys.net/7/4095/2007/.
Stevenson, D. S., Dentener, F. J., Schultz, M. G., Ellingsen, K., van Noije, T. P. C., et al.: Multi-model ensemble simulations of present-day and near-future tropospheric ozone, J. Geophys. Res.-Atmos., 111(D8), D08301, doi:10.1029/2005JD006338, 2006.
Stickler, A., Fischer, H., Bozem, H., Gurk, C., Schiller, C., et al.: Chemistry, transport and dry
15
deposition of trace gases in the boundary layer over the tropical Atlantic Ocean and the Guyanas during the GABRIEL field campaign, Atmos. Chem. Phys., 7, 3933–3956, 2007, http://www.atmos-chem-phys.net/7/3933/2007/.
Stickler, A., Fischer, H., Williams, J., de Reus, M., Sander, R., et al.: Influence of summer-time deep convection on formaldehyde in the middle and upper troposphere over Europe,
20
J. Geophys. Res.-Atmos., 111, D14308, doi:10.1029/2005JD007001, 2006.
Str ¨om, J., Fischer, H., Lelieveld, J., and Schr ¨oder, F.: In situ measurements of microphysical properties and trace gases in two cumulonimbus anvils over western Europe, J. Geophys. Res., 104, 12221–12226, 1999.
Thompson, A. M., Tao, W. K., Pickering, K. E., Scala, J. R., and Simpson, J.: Tropical deep
25
convection and ozone formation, B. Am. Meteor. Soc., 78, 1043–1054, 1997.
Warneke, C., Holzinger, R., Hansel, A., Jordan, A., Lindinger, W., et al.: Isoprene and its oxida-tion products methyl vinyl ketone, methacrolein, and isoprene related peroxides measured online over the tropical rain forest of Surinam in March 1998, J. Atmos. Chem., 38, 167–185, 2001.
30
ACPD
9, 20309–20347, 2009Evidence of the impact of deep convection on reactive VOC
J. Bechara et al.
Title Page
Abstract Introduction
Conclusions References
Tables Figures
◭ ◮
◭ ◮
Back Close
Full Screen / Esc
Printer-friendly Version
Interactive Discussion
Table 1.Details on ATR-42 and F-F20.
Date ATR F-F20
Flight no. Objective No. of VOC Flight no. Objective No. of VOC samples samples collected collected 2 August 2006 AV38 Test flight
AV39 Test flight 4 August 2006 AV40 Test flight
5 August 2006 AV41 Pre-MCS 11 6 August 2006 AV42 Post-MCS 6 7 August 2006 AV43 Post-MCS
8 August 2006 AV44 North-to-south exploration 6 AV45 North-to-south exploration 6 9 August 2006 AV46 North-to-south exploration 3 AV47 North-to-south exploration 3
11 August 2006 AV48 North-to-south exploration FV48 MCS outflow exploration 4 AV49 North-to-south exploration
12 August 2006 AV50 Pre-MCS 4
13 August 2006 AV51 North-to-south exploration 8 FV49 North-to-south exploration 12 14 August 2006 AV52 Pre-MCS 3 FV50 MCS outflow exploration 7 15 August 2006 AV53 Post-MCS 7 FV51 MCS outflow exploration 4 16 August 2006 AV54 North-to-south exploration 10
17 August 2006 AV56 North-to-south exploration 10 FV53 MCS outflow exploration 7 17 August 2006 AV57 Post-MCS
19 August 2006 AV58 Post-MCS 12 FV54 North-to-south exploration 4 FV55 Post day+1 exploration 7
ACPD
9, 20309–20347, 2009Evidence of the impact of deep convection on reactive VOC
J. Bechara et al.
Title Page
Abstract Introduction
Conclusions References
Tables Figures
◭ ◮
◭ ◮
Back Close
Full Screen / Esc
Printer-friendly Version
Interactive Discussion
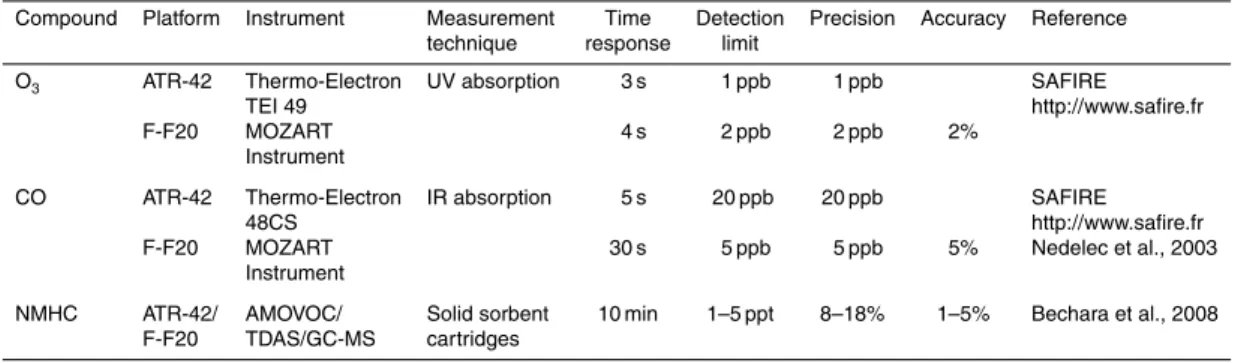
Table 2.Aircraft instrumentation.
Compound Platform Instrument Measurement Time Detection Precision Accuracy Reference technique response limit
O3 ATR-42 Thermo-Electron UV absorption 3 s 1 ppb 1 ppb SAFIRE
TEI 49 http://www.safire.fr F-F20 MOZART 4 s 2 ppb 2 ppb 2%
Instrument
CO ATR-42 Thermo-Electron IR absorption 5 s 20 ppb 20 ppb SAFIRE 48CS http://www.safire.fr F-F20 MOZART 30 s 5 ppb 5 ppb 5% Nedelec et al., 2003
Instrument
ACPD
9, 20309–20347, 2009Evidence of the impact of deep convection on reactive VOC
J. Bechara et al.
Title Page
Abstract Introduction
Conclusions References
Tables Figures
◭ ◮
◭ ◮
Back Close
Full Screen / Esc
Printer-friendly Version
Interactive Discussion
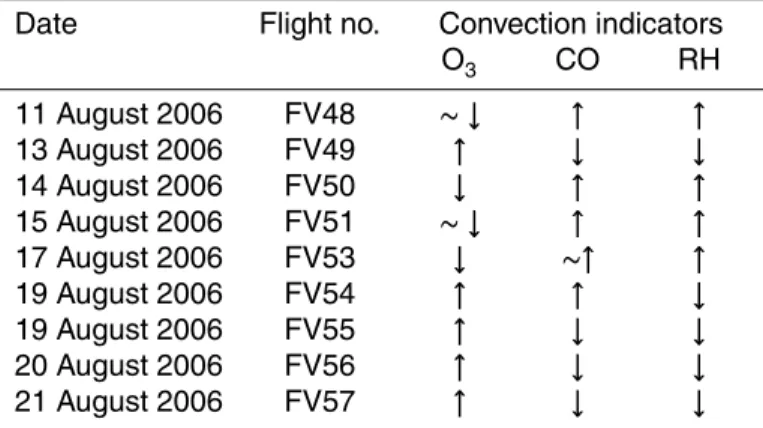
Table 3. Convection indicators variations for F-F20 flights. ↓: decreasing mixing ratios,↑:
in-creasing mixing ratios.
Date Flight no. Convection indicators
O3 CO RH
11 August 2006 FV48 ∼ ↓ ↑ ↑
13 August 2006 FV49 ↑ ↓ ↓
14 August 2006 FV50 ↓ ↑ ↑
15 August 2006 FV51 ∼ ↓ ↑ ↑
17 August 2006 FV53 ↓ ∼↑ ↑
19 August 2006 FV54 ↑ ↑ ↓
19 August 2006 FV55 ↑ ↓ ↓
20 August 2006 FV56 ↑ ↓ ↓
ACPD
9, 20309–20347, 2009Evidence of the impact of deep convection on reactive VOC
J. Bechara et al.
Title Page
Abstract Introduction
Conclusions References
Tables Figures
◭ ◮
◭ ◮
Back Close
Full Screen / Esc
Printer-friendly Version
Interactive Discussion
-5 0 5 10 15
5 10 15 20
Niamey
Cotonou
FV51 FV48
FV50 FV53
L
a
ti
tu
d
e
Longitude
*
*
-5 0 5 10 15
5 10 15 20
Niamey
Cotonou
FV51 FV48
FV50 FV53
L
a
ti
tu
d
e
Longitude
*
*
Fig. 1. Explored area during AMMA SOP 2a2. The map reflects the land-surface
ACPD
9, 20309–20347, 2009Evidence of the impact of deep convection on reactive VOC
J. Bechara et al.
Title Page
Abstract Introduction
Conclusions References
Tables Figures
◭ ◮
◭ ◮
Back Close
Full Screen / Esc
Printer-friendly Version
Interactive Discussion
Fig. 2. North-to-South variability profiles of biogenic and anthropogenic NMHC in the low
ACPD
9, 20309–20347, 2009Evidence of the impact of deep convection on reactive VOC
J. Bechara et al.
Title Page
Abstract Introduction
Conclusions References
Tables Figures
◭ ◮
◭ ◮
Back Close
Full Screen / Esc
Printer-friendly Version
Interactive Discussion
Fig. 3. Vertical profiles of a selection of NMHC collected on both aircrafts during SOP 2a2.
ACPD
9, 20309–20347, 2009Evidence of the impact of deep convection on reactive VOC
J. Bechara et al.
Title Page
Abstract Introduction
Conclusions References
Tables Figures
◭ ◮
◭ ◮
Back Close
Full Screen / Esc
Printer-friendly Version
Interactive Discussion
Fig. 4. Vertical profiles of CO, O3 and RH used as convection indicators. Black lines (13
ACPD
9, 20309–20347, 2009Evidence of the impact of deep convection on reactive VOC
J. Bechara et al.
Title Page
Abstract Introduction
Conclusions References
Tables Figures
◭ ◮
◭ ◮
Back Close
Full Screen / Esc
Printer-friendly Version
Interactive Discussion
Fig. 5. Latitude vs. longitude distribution at UT level for CO (top left panel), O3 (top right
ACPD
9, 20309–20347, 2009Evidence of the impact of deep convection on reactive VOC
J. Bechara et al.
Title Page
Abstract Introduction
Conclusions References
Tables Figures
◭ ◮
◭ ◮
Back Close
Full Screen / Esc
Printer-friendly Version
Interactive Discussion
Fig. 6. Selected NMHC variability in the low troposphere (LT), in non-convective UT (NC-UT)
ACPD
9, 20309–20347, 2009Evidence of the impact of deep convection on reactive VOC
J. Bechara et al.
Title Page
Abstract Introduction
Conclusions References
Tables Figures
◭ ◮
◭ ◮
Back Close
Full Screen / Esc
Printer-friendly Version
Interactive Discussion
Fig. 7.Average UT content of isoprene (round marker) and benzene (squared marker)
ACPD
9, 20309–20347, 2009Evidence of the impact of deep convection on reactive VOC
J. Bechara et al.
Title Page
Abstract Introduction
Conclusions References
Tables Figures
◭ ◮
◭ ◮
Back Close
Full Screen / Esc
Printer-friendly Version
Interactive Discussion
UT Conv
R = 0.77
-1.0
-1.0
-0.5
-0.5
0.0
0.0
0.5
0.5
1.0
1.0
1.5
1.5
2.0
2.0
-6
-4
-2
0
2
4
UT N-conv
R = 0.60
ln (Toluene/Benzene)
ln
(
T
ra
n
s
-2
-p
e
n
te
n
e
/B
e
n
z
e
n
e
)
Fig. 8. Natural logarithms of trans-2-pentene to benzene vs. toluene to benzene ratios for
ACPD
9, 20309–20347, 2009Evidence of the impact of deep convection on reactive VOC
J. Bechara et al.
Title Page
Abstract Introduction
Conclusions References
Tables Figures
◭ ◮
◭ ◮
Back Close
Full Screen / Esc
Printer-friendly Version
Interactive Discussion 1
2 3 4 5 6 7 8 9 10 11 12
0.0 0.2 0.4 0.6 0.8 1.0 1.2 1.4 1.6 1.8
R
OH (s -1
)
A
lt
it
u
d
e
(
k
m
)
124TMB 135TMB oXylene mpXylene Ethylbenzene Octane 224TMP Toluene Heptane Hexane Benzene Pentane Trans2pentene Isoprene CO O3
ACPD
9, 20309–20347, 2009Evidence of the impact of deep convection on reactive VOC
J. Bechara et al.
Title Page
Abstract Introduction
Conclusions References
Tables Figures
◭ ◮
◭ ◮
Back Close
Full Screen / Esc
Printer-friendly Version
Interactive Discussion
Fig. 10.Total NMHC reactivity according to OH radical in the boundary layer (LT, in red) and in
ACPD
9, 20309–20347, 2009Evidence of the impact of deep convection on reactive VOC
J. Bechara et al.
Title Page
Abstract Introduction
Conclusions References
Tables Figures
◭ ◮
◭ ◮
Back Close
Full Screen / Esc
Printer-friendly Version
Interactive Discussion
Fig. 11.Deep convection characteristics in West Africa. Left plot: Fraction of low tropospheric