CHAPTER
5
*
Validity of Air-Displacement Plethysmography in the
Assessment of Body Composition Changes in a 16-Month Weight Loss
Program
Cláudia S. Minderico1, Analiza M. Silva1, Pedro J. Teixeira1, Luis B. Sardinha1, Holly
R. Hull2, and David A. Fields3*
Address: 1 Exercise and Health Laboratory, Faculty of Human Movement, Technical
University of Lisbon, Portugal, Health and Exercise Science, 2University of Oklahoma,
Norman, OK, and 3 Department of Pediatrics, Children’s Medical Research Institute’s
Metabolic Research Center, University of Oklahoma Health Science Center, OK, USA
E-mail:
Cláudia Minderico: [email protected] Analiza M. Silva: [email protected] Pedro J. Teixeira: [email protected] Luis B. Sardinha: [email protected] Holly H. Hull: [email protected]
David A. Fields: [email protected]
*
Corresponding Author Address
David A Fields Ph.D.
Assistant Professor, University of Oklahoma Health Science Center, School of Medicine Department of Pediatrics, OUCP Diabetes & Endocrinology
940 NE 13th Street, CH 2B2426 OKC, OK 73104
Phone: 405-271-8001 ext: 43083 Fax: 405-271-3093
*Minderico,C., Silva, A.M., Rocha, P.M., Vieira, P.N., Teixeira, P.J. & Sardinha, L.B. (2005). Exercício e Composição Corporal. Endocrinologia, Metabolismo & Nutrição,
A
BSTRACTObjective: To compare the accuracy of air displacement plethysmography (ADP) and
dual energy x-ray absorptionmetry (DXA) in tracking changes in body composition
after a 16 month weight loss intervention in overweight and obese females.
Methods: 93 healthy female subjects (38.9 ± 5.7 yr, 159.8 ± 5.6 cm, 76.7 ± 9.9 kg, 30.0
± 3.4 kg/m2) completed a 16 month weight loss intervention. Eligible subjects attended
15 treatment sessions occurring over the course of 4 months with educational content
including topics relating to physical activity and exercise, diet and eating behavior, and
behavior modification. In the remaining 12 month subjects underwent a lifestyle
program designed to increase physical activity and improve eating habits. Before and
after the intervention, subjects had their percent body fat (%fat), fat mass (FM), and
fat-free mass (FFM)) assessed by DXA and ADP.
Results: Significant differences (p 0.001) were found between DXA and ADP at
baseline %fat (46.0 % fat vs. 42.0 % fat), FM (35.3 kg vs. 32.5 kg) and FFM (40.8 kg
vs. 44.2 kg) as well as at post intervention for %fat (42.1% fat vs. 38.3 % fat), FM (30.9
kg vs. 28.4 kg) and FFM (41.7 kg vs. 44.7 kg). At each time point, ADP %fat and total
FM was significantly lower (p < 0.001) than DXA while FFM was significantly higher
(p < 0.001). However, both techniques tracked %fat changes similarly considering that
there were no differences between the two means. Furthermore, a Bland-Altman
analysis was performed and no significant bias was observed, thus demonstrating the
ability of ADP to measure body fat across a wide range of fatness.
Conclusion: At baseline and post weight loss, a significant difference was found
between ADP and DXA. However, the results indicate both methods are highly related
and track changes in %fat similarly after a weight loss program in overweight and obese
techniques, suggesting that ADP can be translated to its use in clinical practice and
research studies as DXA currently is used.
I
NTRODUCTIONIt has been widely documented and reported the rise in obesity rates across the
globe in all ethnicities and genders (1,2). The link between obesity and its related
co-morbidities and death is the concomitant increase in fat mass observed as body weight
increases (3). Accordingly, weight loss programs should not solely focus on decreasing
body weight, but in addition to, focus on decreasing fat mass. Consequently, the need
has arisen for accurate assessment tools in the management of obesity and in the
evaluation and efficacy of weight loss programs. One such tool has been
air-displacement plethysmography (ADP), in part because of its ability to accommodate
large persons but also because of its ease on both the patient and operator (4,5,6,7).
Several studies have validated ADP with hydrostatic weighing, dual energy X-ray
absorptiometry (DXA), bioelectric impedance, and multi-comportment models in a
wide range of populations (children, elderly, athletes, morbid obesity, paraplegics) with
the overall consensus showing good agreement (6,8,9,10). Though warranted and
needed, few studies have assessed the ability of ADP to track changes in body
composition over time in persons engaged in a weight loss program (11,12). Recently,
Frisard et al. (11) concluded that ADP was relatively accurate in assessing body
composition compared to DXA in a group of overweight males and females who
engaged in a six month weight loss program, although ADP showed bias (i.e. it
overestimated fat mass at body fat ranges <40%). This is in agreement with Weyers et
al. (12) who reported similar sensitivity between ADP and DXA in twenty-two subjects
Weyers studies analyzed a combined sample of men (22 and 10, respectively) and
women (34 and 12, respectively) during a short period of weight loss (6 months and 8
weeks, respectively). Therefore, the purpose of this study was to determine the ability
of ADP to track changes in percent fat (%fat), total fat (FM) and fat-free mass (FFM) in
a 16 month weight loss program relative to DXA in a cohort of females.
M
ETHODSSubjects
Subjects were recruited from the Lisbon community for a 16 month weight
management program through newspaper advertisements, email messages, and study
flyers. Inclusion criteria were the following: 1) female, 2) > 24 years old, 3)
pre-menopausal, 4) currently not pregnant nor trying to become pregnant, 5) body mass
index (BMI) >24.9 kg/m2, and 6) free from any major diseases. After several orientation
sessions, 152 females signed up for the weight loss program. During the run-in phase,
four females decided not to participate (reporting time and scheduling conflicts), four
did not comply with testing requirements, three females became pregnant or were
attempting to become pregnant, and one subject was diagnosed with hyperthyroidism,
leaving a total of 140 females who started the intervention. However, only 95 subjects
completed ADP and DXA testing before and after weight-loss. An initial visit with the
study physician ensured that subjects met all medical inclusion criteria. All participants
agreed to refrain from participating in any other weight loss program and gave written
informed consent prior to participation in the study. The Institutional Review Board of
the Faculty of Human Movement approved the study.
Weight Loss Intervention
in groups of 32 to 35 women, for 4 months {Teixeira, 2004 #1709}. Average attendance
to the treatment sessions was 83%. Sessions lasted 120 minutes and included
educational content and practical application classroom exercises in the areas of
physical activity and exercise, diet and eating behavior, and behavior modification.
Physical activity topics included learning the energy cost associated with typical
activities, increasing daily walking and lifestyle physical activity, planning and
implementing a structured exercise plan, setting appropriate goals, using logs and
pedometers for self-monitoring, and choosing the right type of exercises. Examples of
covered nutrition topics are the caloric, fat, and fiber content, and the energy density of
common foods, the role of breakfast and meal frequency for weight control, reducing
portion size, strategies to reduce fat content in the diet, preventing binge and emotional
eating, planning for special occasions, and reducing hunger by increasing meal satiety
(e.g., increasing fiber content). Cognitive and behavioral skills such as self-monitoring,
self-efficacy enhancement, dealing with lapses and relapses, enhancing body image,
using contingency management strategies, and eliciting social support were also part of
the curriculum. Subjects were instructed and encouraged to make small but enduring
reductions in caloric intake and to increase energy expenditure to induce a daily energy
deficit of approximately 300 kcal. Although weight was monitored weekly, subjects
were advised that long-term (i.e., after 1-2 years), not necessarily rapid weight reduction
was the primary target. In the first session, participants were informed that reaching a
minimum of 5% weight loss at 6 months was an appropriate goal in this program and
were subsequently instructed to individually calculate the number of kilograms that
corresponded to their specific body weight. In the second phase subjects were involved
in a lifestyle intervention through 12 month. Briefly, participants were asked to
Compliance was monitored on the basis of daily logs of physical activity. Monthly
group sessions were used, with a minimum duration of 120 minutes. These group
meetings were designed to support participants with positive experiences and to
overcome individual and specific roadblocks to increase physical activity and improve
nutrition.
Body Composition Measurements
DXA was chosen as the criterion method which has been considered a reasonable
alternative to a multi-compartment approach (11,14,15,16). All subjects arrived for
testing in the morning after a 12-hour fast. Additionally, subjects were asked to refrain
from exercise, alcohol and stimulant consumption 24 h prior to testing.
Dual energy X-ray absorptiometry (DXA)
Each subject had %fat, FM, and FFM evaluated by DXA utilizing a whole body
(QDR-1500, Hologic, Waltham, USA, pencil beam mode, software version 5.67
enhanced whole-body analyses) system. Prior to testing, the system was calibrated
according to the manufactures recommendations. Following the protocol for DXA
described by the manufacturer, a step phantom with six fields of acrylic and aluminium
of varying thickness and known absorptive properties was scanned alongside each
subject to serve as an external standard for the analysis of different tissue composition.
The same lab technician positioned the subjects, performed the scans and executed the
analysis according to the operator’s manual using the standard analysis protocol. Based
on ten subjects, the coefficient of variation (CV) and technical error of measurement
(TEM) in our laboratory for %fat is 2% and 0.4% respectively.
Air-Displacement Plethysmography (ADP)
Each subject also had %fat, FM, and FFM evaluated by ADP (e.g. BOD POD,
to manufacturer testing recommendations and guidelines. The system was calibrated
every day according to the manufactures recommendations. Details regarding the
physical concepts and operational principles of ADP are reported elsewhere (7,17).
Briefly, each subject wore a swimsuit and cap provided by the laboratory while body
mass was measured to the nearest 100 g by an electronic scale connected to the ADP
computer. Next, the measured thoracic gas volume was calculated where:
Thoracic gas volume = functional residual capacity + 0.5 tidal volume
The measured thoracic gas volume was obtained in all subjects. Body density (Bd)
was then calculated as body mass divided by body volume. Percent body fat was
estimated from body density based on a two-compartment model using Siri’s equation
(18):
ADP %fat = [(4.95/Bd) – 4.50] x 100
Based on ten subjects, the CV and TEM in our laboratory for %fat is 3% and 1%
respectively.
Data analysis
Accuracy and bias were examined in ADP using DXA as the criterion method.
Regression analysis was utilized to determine the accuracy of ADP. With ADP
considered accurate if the regression between DXA and ADP did not have a slope
significantly different from one and an intercept significantly different from zero.
Additionally, R2 and the standard error of the estimate (SEE) were assessed. Potential
bias between ADP and DXA were examined using Bland-Altman analysis (19). The
Bland-Altman examined the difference between ADP and the criterion method (i.e.
DXA) with a non-significant correlation indicating no bias in ADP across the degree of
Data was analysed with SPSS for Windows version 14.0 (SPSS Inc, Chicago) and
sstatistical significance was set at (p < 0.05).
R
ESULTSThe physical characteristics of all subjects who completed the study along with
changes in body composition variables by both ADP and DXA before and after
weight-loss are presented in Table 1. Of note, two subjects were considered outliers (>3SD),
therefore the final sample for data analysis was 93 subjects.
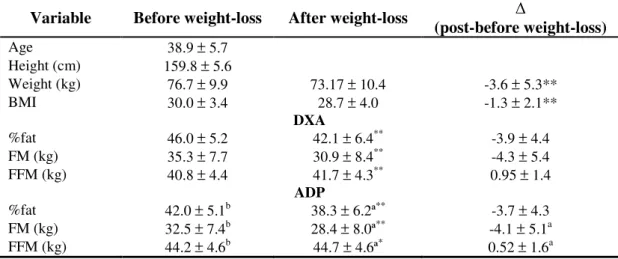
Table 1: Subjects characteristic and body composition (n=93).
Variable Before weight-loss After weight-loss
(post-before weight-loss)
Age 38.9 ± 5.7
Height (cm) 159.8 ± 5.6
Weight (kg) 76.7 ± 9.9 73.17 ± 10.4 -3.6 ± 5.3**
BMI 30.0 ± 3.4 28.7 ± 4.0 -1.3 ± 2.1**
DXA
%fat 46.0 ± 5.2 42.1 ± 6.4** -3.9 ± 4.4 FM (kg) 35.3 ± 7.7 30.9 ± 8.4** -4.3 ± 5.4 FFM (kg) 40.8 ± 4.4 41.7 ± 4.3** 0.95 ± 1.4
ADP
%fat 42.0 ± 5.1b 38.3 ± 6.2ª** -3.7 ± 4.3 FM (kg) 32.5 ± 7.4b 28.4 ± 8.0ª** -4.1 ± 5.1a FFM (kg) 44.2 ± 4.6b 44.7 ± 4.6ª* 0.52 ± 1.6a Data reported as mean ± standard deviation
* Significantly different from baseline (p < 0.05) ** Significantly different from baseline (p ≤ 0.001) ª Significantly different from DXA (p < 0.05)
b
Significantly different from DXA (p < 0.001)
Before and after weight-loss
ADP %fat was highly correlated with DXA %fat before weight-loss (r = 0.92) and
after weight-loss (r = 0.94) (Table 2). There were significant differences in body
composition variables between ADP and DXA before and after weight-loss (Table 1).
FM was significantly lower (p < 0.001) than DXA while FFM was significantly higher
(p < 0.001).
Accuracy of %fat was examined by the regression of %fat by DXA against %fat
by ADP at each time point. A summary of the regression analyses between the
relationship between %fat by DXA and ADP are presented in Table 2. The regression
for %fat by ADP vs. %fat by DXA was significant only for the intercept (p<0.05) for
each time point (Table 2). Regression coefficients were above (R2 > 0.85) and the SEE
was low (< 2.2 %fat) for each time point as well (Table 2).
Table 2. Summary of regression and Bland-Altman analysis before and after weight-loss compared to DXA
Regression Bland-Altman
Intercept Slope R2 SEE Bias 95% Limits p Value
Before weight-loss
ADP %fat 6.6671 0.937 0.845 2.056 -4.0123 0.128 to 8.152 0.648
After weight-loss (16 months)
ADP %fat 4.9561 0.969 0.884 2.183 -3.7603 0.600 to 8.120 0.408
(before – after weight-loss)
ADP %fat -0.6181 0.902 0.763 2.182 0.252 -4.168 to 4.672 0.665
1
Significantly different from 0 (p < 0.05)
2
Significantly different from 1 (p < 0.001)
3
Bland-Altman analysis bias is the mean difference between ADP and DXA (p < 0.001)
with the trend between DXA and ADP not significant at any time point (i.e. no bias between techniques was observed)
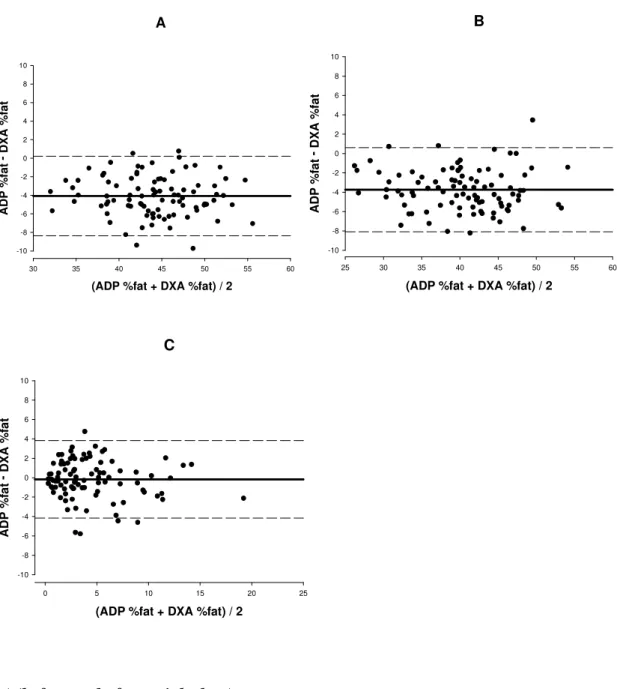
Bland-Altman analysis was performed for each time point to determine if bias
existed between ADP and DXA with plots shown in Figure 1 (panels A and B). A
non-significant trend was observed for each time point, thus indicating no bias across the
Figure 1 The Bland-Altman analysis at baseline (panel A), after weight-loss (panel B) and for the (before – after weight-loss) (panel C). The middle solid line represents the mean difference between %fat from ADP – %fat from DXA and the upper and lower dashed line represents ± 2 SD from the mean i.e. 95% limits of agreement (±1.96 SD). Bias between the techniques for each time point was not observed, as indicated by a non-significant p value (p = 0.648, p = 0.408 and p = 0.665, respectively).
A
(ADP %fat + DXA %fat) / 2
30 35 40 45 50 55 60
A D P % fa t
- D
X A % fa t -10 -8 -6 -4 -2 0 2 4 6 8 10 B
(ADP %fat + DXA %fat) / 2
25 30 35 40 45 50 55 60
A D P % fa t
- D
X A % fa t -10 -8 -6 -4 -2 0 2 4 6 8 10 C
(ADP %fat + DXA %fat) / 2
0 5 10 15 20 25
A D P % fa t
- D
X A % fa t -10 -8 -6 -4 -2 0 2 4 6 8 10
(before and after weight-loss)
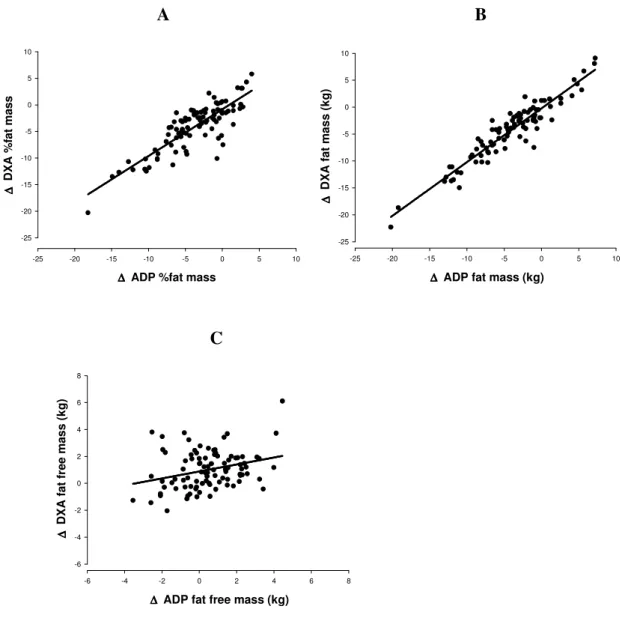
The in %fat before and after weight-loss for ADP was highly correlated with
DXA (r = 0.87) with a significant difference in the in FM and FFM being observed
As depicted in Figure 2 a high association between ADP and DXA relative and
absolute fat mass changes was present while a lower relation was found for tracking
FFM changes.
Figure 2 Regression of: ∆ fat mass (%) DXA vs ADP (panel A), ∆ fat mass (kg) DXA vs ADP (panel B) and, ∆ fat free mass (kg) DXA vs ADP (panel C).
A B
∆ ∆ ∆
∆ ADP %fat mass
-25 -20 -15 -10 -5 0 5 10
∆ ∆ ∆ ∆ D X A % fa t m a s s -25 -20 -15 -10 -5 0 5 10 ∆ ∆ ∆
∆ ADP fat mass (kg)
-25 -20 -15 -10 -5 0 5 10
∆ ∆ ∆ ∆ D X A f a t m a s s ( k g ) -25 -20 -15 -10 -5 0 5 10 C ∆ ∆ ∆
∆ ADP fat free mass (kg)
-6 -4 -2 0 2 4 6 8
∆ ∆ ∆ ∆ D X A f a t fr e e m a s s ( k g ) -6 -4 -2 0 2 4 6 8
The regression in the %fat by ADP vs. %fat by DXA significantly deviated from
the line of identity (Table 2). The regression coefficient was (R2 = 0.76) and the SEE
thus indicating no bias across the range of fatness (Table 2).
D
ISCUSSIONWith the rapid rise in obesity worldwide, the focus has shifted to treatment of
obesity which magnifies the necessity to assess changes in body mass accurately.
Solely using body weight to evaluate weight loss outcomes could be misleading. It is
imperative that methods to assess changes during weight loss have the ability to
quantify changes in body weight such as changes in FM and FFM. ADP has emerged
as a technique valid in several different populations and has the ability to accommodate
larger subjects (4,5,6,7). To date only two studies have examined the reliability of ADP
over the course of a weight loss intervention (11,12).
This study examined the accuracy and bias of %fat assessed by ADP relative to
DXA before and after a sixteen month weight loss program. To our knowledge, this
paper is unique due to its research design using a long-term weight loss program with a
large sample of overweight and obese women.
Discussion of techniques before and after weight-loss findings
The findings of our study indicate that there was a difference between ADP and
DXA before and after weight loss for %fat, FM and FFM. ADP %fat and total FM was
significantly lower than DXA while FFM by ADP was significantly higher than DXA
FFM. Even though, pre and post weight loss measurements for %fat were significantly
different, ADP %fat was highly correlated with DXA %fat and the SEE was low.
Additionally, no bias was indicated by the Bland-Altman analysis demonstrating the
ability of ADP relative to DXA to assess %fat across a wide range of fatness.
Two studies have investigated the ability of ADP to detect changes in body
changes in 12 overweight women and 10 overweight men after an 8 week moderate
energy restricted diet (12). In line with our study, Weyers et al. (12) found ADP to
underestimate %fat and FM and overestimate FFM relative to DXA, at both time points.
However, the study of Frisard et al. (11) reported the opposite. They randomized 56
overweight subjects into a self help group or a commercially available weight loss
program (11). Before and after weight loss, DXA results of %fat and FM were lower
and FFM greater than ADP (11).
It is worth noting that our study used pencil-beam DXA technology (QDR-1500,
Hologic, Waltham, USA), in which a single detector is used to measure the transmission
of X-rays from a highly collimated source. Even though the difference between the
pencil beam DXA and the multi-compartment model are relatively small, DXA slightly
overestimates FM and underestimates FFM (20). When compared to the new generation
of fan-beam DXA with a slit collimator X-ray source and multiple detectors, and a
different algorithm, the pencil-beam DXA gave a higher reading of FM and a lower
value of FFM (21,22).Differences in DXA instruments made by other manufacturers or
differences in DXA instruments that use different scan mode and software is not known,
though a few studies have shown a lack of interchangeability in DXA systems to assess
soft tissue (21,24,23,25).
Considering that Frisard et al used a fan-beam DXA (QDR 2000 Hologic), this
may explain the lower cross sectional values for DXA %fat and FM before and after the
intervention. Therefore, the different DXA technology utilized (pencil beam vs. fan
beam) and the different algorithm used due to a new software version (1500 vs. 2000)
might explain the discrepant results between the two studies. Although, Weyers et al,
used different DXA equipment (ProdigyTM, Lunar Corporation, Madison, WI) and
Discussion of (before and after weight-loss) between techniques
This study was specifically designed to determine if ADP tracked changes
similarly to DXA. As assessed with a paired t-test, % fat changes were tracked
similarly by both techniques because there were no differences between the two means,
while FM changes were borderline significant (p=0.049). Furthermore, a Bland-Altman
analysis was completed and no significant bias was observed, thus demonstrating the
ability of ADP to measure body fat across a wide range of fatness and that the
techniques tracked body composition changes similarly.
Mentioned previously, two weight loss intervention studies have validated ADP
with DXA in tracking body composition changes and have found similar results as this
study (11,12). After a 4.3 kg weight loss, data by Weyers et al. (12) found no significant
differences in changes in %fat, FM or FFM between methods. Further, significant
correlations between techniques were found for changes %fat and FM and no patterns in
changes in %fat between ADP and DXA were detected. Frisard et al. (11) calculated
regression coefficients comparing DXA and ADP after a 6.5 kg change in weight and
found a high accuracy (r2 >0.80) between the two techniques for %fat, FM and FFM.
In the current investigation, DXA was considered the reference method to validate
ADP. However, DXA may not be accurate enough to detect changes in fat free mass
components, due to the underlying assumption of the hydration of FFM for DXA.
Moreover, our DXA-Hologic equipment performs whole-body scans using a
pencil-beam mode which yields different results from other Hologic fan pencil-beam whole-body
scans. In addition, the results of using this early software version compared to the new
generation of Hologic DXA machines can be different. Therefore, the accuracy of ADP
using this DXA equipment should not be generalized to other scan modes, software
This study has several strengths including the large sample size, the length of
intervention and the specific population studied. A total of 140 subjects started the
intervention with 95 completing both the pre and post DXA and ADP measurements
representing a 68% retention rate. A high retention rate is important because it
strengthens the ability to identify the true relationship between ADP and DXA for
detecting changes in body weight. Subjects were females greater than 24 years old,
pre-menopausal with a BMI >24.9 kg/m2. The intervention lasted for a total of 16 months
which is significant given that other studies have only assessed weight changes over a
course of 8 week (12) or a 6 month intervention (11).
This study is not without limitations. First, the study population involved only
females and may not be generalized to other populations such as children, males or the
elderly. Second, the changes in body weight and body composition after the 16 month
intervention were small (3.6 kg).
C
ONCLUSIONSThe results of this study indicate that DXA and ADP are highly related and track
changes in %fat similarly after a weight loss intervention in females. The mean changes
in %fat were similar between the two techniques. However, before and after
weight-loss, a significant difference was found between methods where ADP underestimated
%fat and FM while overestimating FFM compared to DXA. DXA is a 3 compartment
model where ADP is a 2 compartment model therefore methods of derivation of body
fat are different which could contribute to the differences found between techniques.
Both methods are relatively easy to complete with high subject compliance and both
methods tracked changes in %fat similarly, therefore either could be used to track
R
EFERENCES1. James PT, Leach R, Kalamara E, Shayeghi M: The worldwide obesity epidemic.Obes Res 2001, 9 Suppl 4:228S-233S.
2. Obesity: preventing and managing the global epidemic. Report of a WHO consultation. World Health Organ Tech Rep Ser 2000, 894:i-xii, 1-253. 3. Heitmann BL, Erikson H, Ellsinger BM, Mikkelsen KL, Larsson B: Mortality
associated with body fat, fat-free mass and body mass index among 60-year-old swedish men-a 22-year follow-up. The study of men born in 1913. Int J
Obes Relat Metab Disord 2000, 24:33-37.
4. Das SK: Body composition measurement in severe obesity. Curr Opin Clin
NutrMetab Care 2005, 8:602-606.
5. Ginde SR, Geliebter A, Rubiano F, Silva AM, Wang J, Heshka S, Heymsfield SB:Air displacement plethysmography: validation in overweight and obese subjects.Obes Res 2005, 13:1232-1237.
6. Fields DA, Goran MI, McCory MA: Body-composition assessment via airdisplacement plethysmography in adults and children: a review. Am J
Clin Nutr 2002, 75:453-467.
7. McCrory MA, Gomez TD, Bernauer EM, Molé PA: Evaluation of a new air displacement plethysmograph for measuring human body composition. Med
Sci Sports Exerc 1995, 27:1686-1691.
8. Clasey JL, Gater DR, Jr.: A comparison of hydrostatic weighing and air displacement plethysmography in adults with spinal cord injury. Arch Phys
Med Rehabil 2005, 86:2106-2113.
9. Fields DA, Hunter GR: Monitoring body fat in the elderly: application of airdisplacement plethysmography. Curr Opin Clin Nutr Metab Care 2004, 7:11-14.
10. Sardinha LB, Lohman TG, Teixeira P, Guedes DP, Going SB: Comparison of air displacement plethysmography with dual-energy X-ray absorptiometry and 3 field methods for estimating body composition in middle-aged men.
Am J Clin Nutr 1998, 68:786-793.
11. Frisard MI, Greenway FL, Delany JP: Comparison of methods to assess body composition changes during a period of weight loss. Obes Res 2005, 13:845-854.
12. Weyers AM, Mazzetti SA, Love DM, Gomez AL, Kraemer WJ, Volek JS:
Comparison of methods for assessing body composition changes during weight loss. Med Sci Sports Exerc 2002, 34:497-502.
13. Teixeira PJ, Palmeira AL, Branco TL, Martins SS, Minderico CS, Barata JT, Silva AM, Sardinha LB: Who will lose weight? A reexamination of predictors of weight loss in women. Int J Behav Nutr Phys Act 2004, 1:12.
14. Lohman TG, Chen Z: Dual-Energy X-ray Absorptiometry. In Human Body
Composition; Champaign, IL. Edited by Heymsfield SB, Lohman TG, Wang
Z,Going SB. Human Kinetics; 2005: 63-77.
15. Podenphant J, Gotfredsen A, Engelhart M, Andersen V, Heitmann BL, Kondrup J: Comparison of body composition by dual energy X-ray absorptiometry to other estimates of body composition during weight loss in obese patients with rheumatoid arthritis. Scand J Clin Lab Invest 1996, 56:615-625. 16. Lohman TG: Dual Energy X-ray Absorptiometry. In Human Body
Composition. Edited by Roche AF, Heymsfield SB, Lohman TG. Champaign, Il:
17. Dempster P, Aitkens S: A new air displacement method for the
determination of human body composition. Med Sci Sports Exerc 1995, 27:1692-1697.
18. Siri WE: Body composition from fluid spaces and density: analysis of methods. In Techniques for Measuring Body Composition. Edited by Brozek J, Hencshel A. Washington, D.C.: Natl Acad Sciences/Natl Res Council; 1961: 223-224
19. Bland JM, Altman DG: Statistical methods for assessing agreement between two methods of clinical measurement. Lancet 1986, 8:307-310.
20. Modlesky CM, Lewis RD, Yetman KA, Rose B, Rosskopf LB, Sparling PB:
Comparison of body composition and bone mineral measurements from two DXA instruments in young men. Am J Clin Nutr 1996, 64:669-676. 21. Tothill P, Hannan WJ: Comparisons between Hologic QDR 1000W, QDR
4500A, and Lunar Expert dual-energy X-ray absorptiometry scanners used for measuring total body bone and soft tissue. Ann N Y Acad Sci 2000,
904:63-71.
22. Prior BM, Cureton KJ, Modlesky CM, Evans EM, Sloninger MA, Saudnders MS, Lewis RD: In vivo validation of whole body composition estimamites from dualenergy X-ray absorptiometry. J Appl Physiol 1997, 83:623-630. 23. Economos CD, Nelson ME, Fiatarone MA, Dallal GE, Heymsfield SB, Wang J,
Yasumara S, Ma R, Vaswani AN, Russell-Aulet M, Pierson RN: A multi-center comparison of dual energy X-ray absorptiometers: in vivo and in vitro soft tissue measurement. Eur J Clin Nutr 1997, 51:312-317.
24. Paton NI, Macallan DC, Jebb SA, Pazianas M, Griffin GE: Dual-energy X-ray absorptiometry results differ between machines. Lancet 1995, 346:899-900. 25. Tothill P, Laskey MA, Orphanidou CI, van Wijk M: Anomalies in dual energy