DOI: http://dx.doi.org/10.1590/2446-4740.00216
*e-mail: borbaneves@hotmail.com
Received: 11 January 2016 / Accepted: 03 January 2017
Mathematical model for body fat percentage of children with
cerebral palsy
Eduardo Borba Neves*, Lucas Menghin Beraldo, Stéphani de Pol, Ana Cláudia Martins Szczypior Costin, Claudiana Renata Chiarello, Leandra Ulbricht
Abstract Introduction: The aim of this study was to develop a speciic mathematical model to estimate the body fat percentage (BF%) of children with cerebral palsy, based on a Brazilian population of patients with this condition. Method: This is a descriptive cross-sectional study. The study included 63 Caucasian children with cerebral palsy, both males and females, aged between three and ten-years-old. Participants were assessed for functional motor impairment using the Gross Motor Function Classiication System (GMFCS), dual energy x-ray absorptiometry (DXA) and skinfold thickness. Total body mass (TBM) and skinfolds thickness from: triceps (Tr), biceps (Bi), Suprailiac (Si), medium thigh (Th), abdominal (Ab), medial calf (Ca) and subscapular (Se) were collected. Fat mass (FM) was estimated by dual energy x-ray absorptiometry (gold standard). Results: The model was built from multivariate linear regression; FM was set as a dependent variable and other anthropometric variables, age and sex, were set as independent variables. The inal model was established as F%=((0.433xTBM + 0.063xTh + 0.167xSi - 6.768) ÷ TBM) × 100, the R2 value was 0.950, R2
adjusted=0.948 and the standard error of estimate was 1.039 kg. Conclusion: This method was shown to be valid to estimate body fat percentage of children with cerebral palsy. Also, the measurement of skinfolds on both sides of the body showed good results in this modelling.
Keywords: Body composition, Fat mass, Children, Cerebral palsy, Fat percentage.
Introduction
Children with Cerebral Palsy (CP) require constant monitoring of their nutritional status. Limited movements
of the upper limbs and dificulty in chewing require
time-consuming meals which, combined with the
presence of vomiting and relux, can lead to malnutrition
(Neves et al., 2014) while the most committed individuals who make use of gastric tube may have overweight and obesity (Stallings et al., 1995; Stallings et al., 1996).
A useful tool for this monitoring is anthropometry, especially estimated body fat percentage (BF%) by analysis of body composition (Stevenson et al., 2006). However, the use of models developed for healthy individuals provided inadequate results in children with CP (Gurka et al., 2010; Liu et al., 2005; Sproule et al., 2010; Stallings et al., 1995). Some CP conditions such as muscle atrophy, motor disturbances, altered growth pattern, increased body water, lower bone density and greater body fat concentration are seen as factors that block the assessment made by methods developed for healthy individuals (Gurka et al., 2010; Kuperminc et al., 2010; Liu et al., 2005; Stallings et al., 1995; Stevenson et al., 2006).
Indirect methods have been suggested as suitable for the evaluation of body composition, such as hydrogen dilution and oxygen isotopes (Van den Berg-Emons et al.,
1995) and, more recently, dual-energy X-ray absorptiometry (DXA) (Gurka et al., 2010; Kuperminc et al., 2010; Liu et al., 2005; Neves et al., 2014).
Considering the need for more affordable methods for assessing body composition, models that perform the evaluation through skinfold were proposed (Gurka et al., 2010; Stallings et al., 1995; Van den Berg-Emons et al., 1998). They were based on North American and Dutch populations and all the procedures were developed based on adaptations of their own models for healthy children, especially the one proposed by Slaughter et al. (1988). Although the study by Neves et al. (2014) proposed
a speciic equation for children with CP, the sample
was very small, limiting the applicability of the results. Therefore, the aim of this study was to develop a
mathematical speciic model to estimate the body fat
percentage of children with cerebral palsy, based on a Brazilian population of patients with this condition.
Methods
This is a descriptive cross-sectional study, whose main intent was to build predictive models from the associations of variables. The study included 63 Caucasian children with cerebral palsy, both males
and females, aged between three and ten-years-old, who participated in the physical therapy intensive program at Vitória Research Center, Curitiba, Brazil. Data collection occurred from 2012 to 2014. All patients with cerebral palsy and whose guardians agreed to their participation in the study were included in the sample. The study protocol was approved by the Human Research Ethics Committee of Campos de Andrade University Center under CAAE number 20058513.9.0000.5218. Informed consent was obtained from each participant’s parent or legal guardian.
Participants were assessed for functional motor
impairment using the Gross Motor Function Classiication
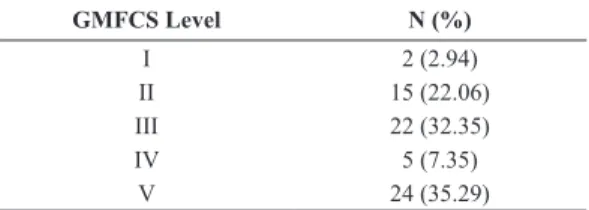
System (GMFCS), whose levels range from I to V, with individuals at level V having the greatest motor impairment. The sample was composed of children
classiied into all levels as shown in Table 1. Total body mass (TBM) was measured by digital scales (Wiso W801) with a capacity of 0-180 kg and graduation of 100g. A stadiometer (WCS Woody Compact) was used for height measurement. Skinfold
measurements were made with a scientiic caliper
(CESCORF) with precision of 0.1mm. All measures
were taken by only one experienced assessor (Certiicate
Level 2 by the International Society of Advancement of Kinanthropometry - ISAK) and carried out according to the recommendations by the American College of Sports Medicine (American…, 2013), The measures were taken on both sides of the body on: triceps (Tr), biceps (Bi), supra iliac (Si), medium thigh (Th), abdominal (Ab), medial calf (Ca) and subscapular (Se) folds. The skinfolds were measured in this order, and the procedure was performed three times. The average of the measurements for each fold in millimeters (mm) was used.
The assessment by DXA was performed with the device Lunar Prodigy Advance (GE Healthcare - General Electric Company) with Encore 2011 GE Healthcare software, which use NHANES III Table for body composition assessment of the CETAC laboratory, Curitiba, Brazil. This equipment has a
coeficient of variation less than 1%, as indicated in
the equipment’s user’s guide. The evaluated subjects were positioned supine with the legs kept in medial
rotation through an acrylic nib and remained immobile during the evaluation. Children who could not stand still were sedated for this assessment. From the DXA whole body evaluation, the gold-standard method (Giachetti et al., 2015; Gurka et al., 2010; Liu et al., 2005) was established; fat mass (FM) and fat-free mass (FFM) were both presented in kilograms. Another variable that was measured was body fat percentage (BF%).
Descriptive data are presented as mean and standard deviation (s). The model was built from multivariable linear regression. The data were entered into a single hierarchical level through the stepwise forward method, and FM was established as the output variable (dependent). For determination of
the predictor variables (independent), irst Pearson’s
correlation (R) was applied between the variables, and the ones most strongly correlated with FM were inserted in the model; the other variables were selected in descending order of correlation with FM, since they did not show a high correlation (R>0.900) with any variable already present in the model. This procedure was used to avoid multicollinearity. Sex was entered as a dichotomous variable as a result of the possible morphological differences between sexes.
Cook’s distance was used to verify inluential
values in the model, and those with value>1 were
established as inluential (Cook and Weisberg, 1982). The selection of outliers was performed by analysing the standardized residuals, with expected maximum of
three individuals (~5.0%) presented for>│1.96s│, one (~1.0%)>│2.58s│ and none for (~0.1%)>│3.29s│.
The validity of the model was tested through the square of the correlation between the predicted values and the FM (R2) in order to verify the relationship
between the model and the observed values by DXA; ANOVA was performed to test the relationship among the sums of squares; the standard error of estimate (SEE), to determine precision; and t-test, to check if
the predictor coeficients and the constant are different
from zero. The predictor variables are described by
regression coeficient (B); standard error for each
parameter (SE B); standardized values for each
coeficient (β); and the partial correlation coeficient
(PCC). The applicability of the model was assessed using the adjusted value of the correlation squared (R2
adjusted). The normal distribution of errors was
veriied by applying the Shapiro-Wilk test (Razali and Wah, 2011). The analyses were performed on the software Statistical Package for Social Sciences 21.0.
The conidence interval was 95.0%, and signiicant
results are indicated as levels *p<0.05; **p<0.01; ***p<0.001.
Table 1. Gross Motor Function Classiication of 63 Brazilian children,
from 3 to 10 years, with cerebral palsy.
GMFCS Level N (%)
I 2 (2.94)
II 15 (22.06)
III 22 (32.35)
IV 5 (7.35)
Results
The sample presented age of 5.6±1.8 years and was composed of 63 individuals; 65.1% (n=41) were male. As for body composition, FM sample ranged between 0.9 and 18.4 kg and BF% was 21.6±11.9 (Table 2).
Table 3 contains the correlation values between
the variables. All analyses were signiicant (p<0.001).
Based on these values, we selected the variables that would be included in the model. TBM had the highest correlation with FM (R=0.939) and was the
irst inserted variable. Then, we selected the folds Si
(R=0.915), Th (R=0.909) and Bi (R=0.873) and age (R=0.729). The variables Se and Ab were excluded
because they have a high correlation with Si (R=0.914 and 0.937, respectively); Tr and Ca were excluded because they have a high correlation with Bi (R=0.930 and 0.910, respectively).
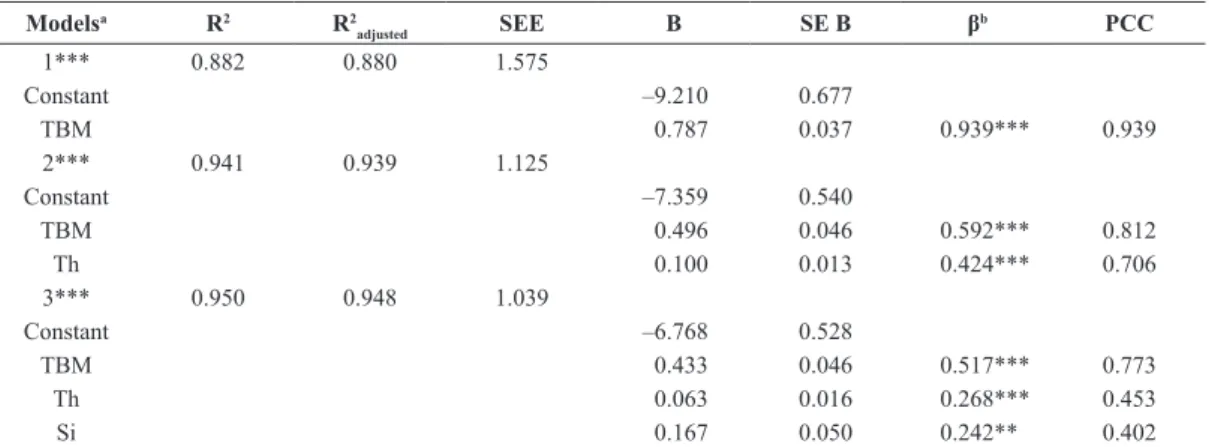
The stepwise regression yielded three models, according to the analysis by ANOVA, and all three
of them were signiicant (p<0.001). In the irst model,
only TBM was entered. Then, with the inclusion of
Th there was an increase of 0.059 in modiication of
R2 and F were signiicant (p<0.001). In the last model
Si was inserted, increasing R2 by 0.009 and promoting
another signiicant change in the F value (p=0.001).
This was the last generated model resulting in Equation 1 (Table 4). Based on this model (Equation 1), the inal equation was proposed to estimate BF% (Equation 2).
Table 2. Anthropometric characterization of 63 Brazilian children, from 3 to 10 years, with cerebral palsy.
Total Female Male
Age 5.6±1.8 (3.0-10.9) 6.4±2.4 (3.1-10.9) 5.2±1.2 (3.0-7.2)
TBM 17.6±5.4 (11.0-32.0) 21.5±6.7 (15.0-32.0) 15.4±3.0 (11.0-22.0)
FM 4.6±4.5 (0.9-18.4) 8.4±5.9 (3.2-18.4) 2.6±1.3 (0.9-5.8)
FFM 12.9±1.9 (9.4-17.4) 13.2±11.1 (11.1-16.7) 12.8±2.2 (9.4-17.4)
BF% 21.6±11.9 (6.7-51.6) 32.7±12.3 (20.2-51.6) 15.7±6.2 (6.7-29.3)
TBM: Total body mass; FM: Fat mass; FFM: Free fat mass and BF%: Body fat percentage.
Table 3. Correlation between the anthropometric variables of 63 Brazilian children, from 3 to 10 years, with cerebral palsy.
TBM Age Se Ca Ab Th Si Bi Tr
FM 0.939 0.729 0.897 0.814 0.862 0.909 0.915 0.873 0.852
Tr 0.765 0.479 0.916 0.857 0.895 0.900 0.887 0.930
-Bi 0.805 0.552 0.913 0.910 0.879 0.893 0.892 -
-Si 0.837 0.546 0.914 0.810 0.937 0.897 - -
-Th 0.820 0.569 0.892 0.830 0.872 - - -
-Ab 0.805 0.485 0.892 0.777 - - - -
-Ca 0.827 0.603 0.788 - - -
-Se 0.783 0.516 - - -
-Age 0.809 - - -
-TBM: Total body mass; FM: Fat mass; Tr: Triceps; Bi: Biceps; Si: Suprailiac; Th: Medium thigh; Ab: Abdominal; Ca: Medial calf and Se: Subscapular.
Table 4. Model parameters and variables inserted in a speciic mathematical model to estimate the body fat percentage (BF%) of children
with cerebral palsy, based on a Brazilian population.
Modelsa R2 R2
adjusted SEE B SE B β
b PCC
1*** 0.882 0.880 1.575
Constant –9.210 0.677
TBM 0.787 0.037 0.939*** 0.939
2*** 0.941 0.939 1.125
Constant –7.359 0.540
TBM 0.496 0.046 0.592*** 0.812
Th 0.100 0.013 0.424*** 0.706
3*** 0.950 0.948 1.039
Constant –6.768 0.528
TBM 0.433 0.046 0.517*** 0.773
Th 0.063 0.016 0.268*** 0.453
Si 0.167 0.050 0.242** 0.402
B: Slope; SE B: Standard error for the slope; β: Standardized slope; PCC: Partial correlation coeficient; SEE: Standard error of estimate; TBM: Total
All variables excluded from the inal model showed no β≠0; the signiicance values were p=0.548 for
gender, p=0.889 for Bi and p=0.096 for age.
0.433 0.063 0.167 6.768
FM= ×TBM+ × +Th × −Si (1)
0.433 0.063 0.167 6.768
% TBM Th Si 100
BF
TBM
× + × + × −
=× (2)
Cook’s distance range from 0.000 to 0.322 and
two cases (3.2%) had standard residue>│1.96s│ with the values –2.68 and 1.96, which justiies the non-exclusion of any individual. The inal R2
adjusted
value was 0.948, and the difference from R2 was 0.002.
The residuals were normally distributed (p=0.791).
Discussion
The determination of body composition through the use of equations developed with a basis on healthy children has been shown to be inadequate. Using the Slaughter equation (Slaughter et al., 1988) in
American children showed correlation ρ=0.588 to fat
mass in the study by Liu et al. (2005) and R=0.690 in the study by Stallings et al. (1995). By contrast, Van den Berg-Emons et al. (1998), compared the results obtained from this equation with BF% values of Dutch children obtained by the deuterium dilution technique
and found a correlation ρ=0.820. Other equations
achieved reasonable quality statistical parameters, but still lower than those obtained in the present study (R2=0.950). The Durnin and Rahaman (1967)
equation was developed from the body density values obtained by underwater weighing correlated by the
order ρ=0.406. Gurka et al. (2010) developed an adaptation to the Slaughter equation that presented a correlation of agreement with the BF% determined by DXA of R=0.910.
One of the error factors in the evaluation of children with CP may lie in determining the side to be evaluated. There is no consensus on the criteria to be used, but most researches do not adopt any
speciic protocol due to the imbalance in body
mass observed across hemibody (Liu et al., 2005; Stallings et al., 1995; Stevenson et al., 2006). Some protocols indicate the conclusion of the measure in the less affected side (Gurka et al., 2010) or in the non-dominant side (Tomoum et al., 2010; Van den Berg-Emons et al., 1998). The protocol developed in this study was adequate by performing the evaluation on both sides and taking the sum of the average of measures, and no study has been conducted performing the evaluation in this way.
The value of R2
adjusted=0.948 suggests that even
in other samples of children with CP the developed
model is appropriate. Still, the measures taken to avoid multicollinearity tend to avoid the presence of errors in the application of the elaborated equation.
Age and gender were not signiicant enough to
enter the equation. This suggests that the changes due to sexual maturation may already be represented in the variables present in the proposed equation.
The absence of age and gender in the inal model has
been observed in other models for children with CP (Gurka et al., 2010; Stallings et al., 1995; Van den Berg-Emons et al., 1998). Although these factors affect fat mass, these variables are already associated with total body mass and inserted into the folds in the model.
It should be noted that the BF% measurement has limitations, even in healthy individuals. The direct measurement of the amount of body fat is possible only on cadavers and this measurement is practiced indirectly, mainly by densitometry. In this sense, knowledge of the density of different body tissues to determine the BF% is required. Among healthy children, these benchmarks are not yet fully established and among children with CP, it is not known how the morphological differences alter these values. Thus, DXA is indicated as the best technique for the measurement of BF% in children with CP, since other indirect methods such as underwater weighing and air displacement plethysmography require apneas and individuals must remain immobile for a long time (Oeffinger et al., 2014; Silva et al., 2013a).
Regarding the DXA technique used in this study, it was included as a form of indirect assessment of body composition in the 80s (Toombs et al., 2012). Although exposing the subject to a source of X-rays, it can be used in people of all ages (Hussain et al., 2014). The DXA Technology has been tested and validated in several populations, in different age groups, becoming recognized as a reference method in the body composition analysis (Albanese et al., 2003; Prior et al., 1997; Toombs et al., 2012).
Williams et al. (2006) published a study in which they compared the accuracy of DXA, with a model of 4-C based on deuterium dilution to estimate fat mass and fat-free mass in 215 subjects aged from 5 to 21.3 years. The authors reported overestimation for fat mass in adult men and women, as well as for obese children and underestimation in non-obese children. The overestimation of fat mass was also detected by Svendsen et al. (1993), but the authors pointed out that the estimated standard error (EPE) was below 3% (1.9kg) associated with a correlation r>0.97, acceptable value for a reference method. Low EPE were also found by Prior et al. (1997) (SEE=2.8%) who evaluated 172 young people aged between 19 and 22 years and Van der Ploeg et al. (2003) (SEE=1.6%) that evaluated 152 individuals of both sexes, between 18 and 59 years.
Speciically in children and adolescents the
applicability of DXA has also been widely discussed in the literature, being considered as a great method for estimating body composition (Elberg et al., 2004; Hussain et al., 2014). However, Sopher et al. (2004) conducted a study with 411 children and adolescents aged six to 18, in order to compare the fat percentage measured by DXA and the model of 4-C, they found overestimated values for DXA in those with a high fat percentage and underestimated in individuals with low fat percentage. Similar results were reported by Williams et al. (2006) and Wells et al. (2010).
Wong et al. (2002) evaluated the agreement in predicting the fat percentage between DXA and the model of 4-C in girls with a mean age of 13±1.9 years. The results showed an average overestimated fat 3.9%. According to the authors, this error stems from the adoption of the value of 73% for the hydration of fat free tissue which is the reference used by DXA software. Such values can be adopted for adults, but have limitations for teens because this value can vary from 67% to 85% according to individual characteristics (Helba and Binkovitz, 2009).
Silva et al. (2013b) conducted a systematic review of 12 studies involving the assessment methods of body fat in children and adolescents. The authors report that the DXA tends to underestimate the fat mass when compared to other methods in this population. And yet, the method should be used with caution because variables such as moisture levels, gender, ethnicity
and type of equipment used may inluence the results.
Moreover, Testolin et al. (2000) argue that the errors
found in this method are small and without signiicant
impact on clinical practice or research. Even the 4C model which is admittedly the best gold standard for assessment of body composition according to Silva et al. (2013b), presents limitation on its use
in young people. The authors justify this restriction because most equations were developed in adults. This fact reinforces the relevance of this study, which proposes equations developed with children.
The devolved equation was: F%=((0.433xTBM + 0.063xTh + 0.167xSi - 6.768) ÷ TBM) × 100; the R2
obtained was 0.950, R 2
adjusted= 0.948 with standard error
estimated of 1.039kg. This appeared valid and proves to be suitable for application in different groups of children with cerebral palsy. Also, the measurement of skinfolds on both sides of the body showed good results in the construction of the model.
References
Albanese CV, Diessel E, Genant HK. Clinical applications of body composition measurements using DXA. Journal of Clinical Densitometry. 2003; 6(2):75-85. PMid:12794229. http://dx.doi.org/10.1385/JCD:6:2:75.
American College of Sports Medicine ACoSM. ACSM’s guidelines for exercise testing and prescription. Baltimore: Lippincott Williams & Wilkins; 2013.
Cook RD, Weisberg S. Residuals and influence in regression. New York: Chapman and Hall; 1982.
Durnin J, Rahaman M. The assessment of the amount of fat in the human body from measurements of skinfold thickness. British Journal of Nutrition. 1967; 21(3):681-9. PMid:6052883. http://dx.doi.org/10.1079/BJN19670070.
Elberg J, McDuffie JR, Sebring NG, Salaita C, Keil M, Robotham D, Reynolds JC, Yanovski JA. Comparison of methods to assess change in children’s body composition. The American Journal of Clinical Nutrition. 2004; 80(1):64-9. PMid:152130280(1):64-9.
Giachetti A, Lovato C, Piscitelli F, Milanese C, Zancanaro C. Robust automatic measurement of 3D scanned models for human body fat estimation. IEEE Journal of Biomedical and Health Informatics. 2015; 19(2):660-7. PMid:24691541. http://dx.doi.org/10.1109/JBHI.2014.2314360.
Gurka MJ, Kuperminc MN, Busby MG, Bennis JA, Grossberg RI, Houlihan CM, Stevenson RD, Henderson RC. Assessment and correction of skinfold thickness equations in estimating body fat in children with cerebral palsy. Developmental Medicine and Child Neurology. 2010; 52(2):e35-41. PMid:19811518. http://dx.doi.org/10.1111/ j.1469-8749.2009.03474.x.
Helba M, Binkovitz LA. Pediatric body composition analysis with dual-energy X-ray absorptiometry. Pediatric Radiology. 2009; 39(7):647-56. PMid:19415261. http:// dx.doi.org/10.1007/s00247-009-1247-0.
Hussain Z, Jafar T, Zaman MU, Parveen R, Saeed F. Correlations of skin fold thickness and validation of prediction equations using DEXA as the gold standard for estimation of body fat composition in Pakistani children. BMJ Open. 2014; 4(4):e004194. PMid:24755209. http:// dx.doi.org/10.1136/bmjopen-2013-004194.
Kuperminc MN, Gurka MJ, Bennis JA, Busby MG, Grossberg RI, Henderson RC, Stevenson RD. Anthropometric measures: Poor predictors of body fat in children with moderate to severe cerebral palsy. Developmental Medicine and Child Neurology. 2010; 52(9):824-30. PMid:20497455. http:// dx.doi.org/10.1111/j.1469-8749.2010.03694.x.
Kuriyan R, Thomas T, Ashok S, Jayakumar J, Kurpad AV. A 4-compartment model based validation of air displacement plethysmography, dual energy X-ray absorptiometry, skinfold technique & bio-electrical impedance for measuring body fat in Indian adults. The Indian Journal of Medical Research. 2014; 139(5):700-7. PMid:25027079.
Liu L-F, Roberts R, Moyer-Mileur L, Samson-Fang L. Determination of body composition in children with cerebral palsy: bioelectrical impedance analysis and anthropometry vs dual-energy x-ray absorptiometry. Journal of the American Dietetic Association. 2005; 105(5):794-7. PMid:15883558. http://dx.doi.org/10.1016/j.jada.2005.02.006.
Neves E, Krueger E, Rosário B, Oliveira M, Pol S, Ripka W. Fat percentage equation for children with cerebral palsy: a novel approach. In: XIII Mediterranean Conference on Medical and Biological Engineering and Computing; 2013; Seville, Spain. Cham: Springer International Publishing; 2014. p. 121-4.
Oeffinger DJ, Gurka MJ, Kuperminc M, Hassani S, Buhr N, Tylkowski C. Accuracy of skinfold and bioelectrical impedance assessments of body fat percentage in ambulatory individuals with cerebral palsy. Developmental Medicine and Child Neurology. 2014; 56(5):475-81. PMid:24344745. http://dx.doi.org/10.1111/dmcn.12342.
Prior BM, Cureton KJ, Modlesky CM, Evans EM, Sloniger MA, Saunders M, Lewis RD. In vivo validation of whole body composition estimates from dual-energy X-ray absorptiometry. Journal of Applied Physiology. 1997; 83(2):623-30. PMid:9262461.
Razali NM, Wah YB. Power comparisons of shapiro-wilk, kolmogorov-smirnov, lilliefors and anderson-darling tests. Journal of Statistical Modeling and Analytics. 2011; 2(1):21-33.
Silva AM, Fields DA, Sardinha LB. A PRISMA-driven systematic review of predictive equations for assessing fat and fat-free mass in healthy children and adolescents using multicomponent molecular models as the reference method. Journal of Obesity. 2013a; 2013:1-15.
Silva DR, Ribeiro AS, Pavão FH, Ronque ER, Avelar A, Silva AM, Cyrino ES. Validity of the methods to assess body fat in children and adolescents using multi-compartment models as the reference method: a systematic review. Revista da Associação Médica Brasileira. 2013b; 59(5):475-86. PMid:24119380. http://dx.doi.org/10.1016/j.ramb.2013.03.006.
Slaughter MH, Lohman T, Boileau R, Horswill C, Stillman R, Van Loan M, Bemben D. Skinfold equations for estimation
of body fatness in children and youth. Human Biology. 1988; 60(5):709-23. PMid:3224965.
Sopher AB, Thornton JC, Wang J, Pierson RN Jr, Heymsfield SB, Horlick M. Measurement of percentage of body fat in 411 children and adolescents: a comparison of dual-energy X-ray absorptiometry with a four-compartment model. Pediatrics. 2004; 113(5):1285-90. PMid:15121943. http:// dx.doi.org/10.1542/peds.113.5.1285.
Sproule DM, Montes J, Dunaway SL, Montgomery M, Battista V, Shen W, Punyanitya M, Darryl C, Kaufmann P. Bioelectrical impedance analysis can be a useful screen for excess adiposity in spinal muscular atrophy. Journal of Child Neurology. 2010; 25(11):1348-54. PMid:20388937. http://dx.doi.org/10.1177/0883073810365185.
Stallings VA, Cronk CE, Zemel BS, Charney EB. Body composition in children with spastic quadriplegic cerebral palsy. The Journal of Pediatrics. 1995; 126(5):833-9. PMid:7752019. http://dx.doi.org/10.1016/S0022-3476(95)70424-8.
Stallings VA, Zemel BS, Davies JC, Cronk CE, Charney EB. Energy expenditure of children and adolescents with severe disabilities: a cerebral palsy model. The American Journal of Clinical Nutrition. 1996; 64(4):627-34. PMid:8839510.
Stevenson RD, Conaway M, Chumlea WC, Rosenbaum P, Fung EB, Henderson RC, Worley G, Liptak G, O’Donnell M, Samson-Fang L, Stallings VA. Growth and health in children with moderate-to-severe cerebral palsy. Pediatrics. 2006; 118(3):1010-8. PMid:16950992. http://dx.doi.org/10.1542/ peds.2006-0298.
Svendsen OL, Haarbo J, Hassager C, Christiansen C. Accuracy of measurements of body composition by dual-energy x-ray absorptiometry in vivo. The American Journal of Clinical Nutrition. 1993; 57(5):605-8. PMid:8480673.
Testolin CG, Gore R, Rivkin T, Horlick M, Arbo J, Wang Z, Chiumello G, Heymsfield SB. Dual-energy X-ray absorptiometry: analysis of pediatric fat estimate errors due to tissue hydration effects. Journal of Applied Physiology. 2000; 89(6):2365-72. PMid:11090591.
Tomoum HY, Badawy NB, Hassan NE, Alian KM. Anthropometry and body composition analysis in children with cerebral palsy. Clinical Nutrition (Edinburgh, Lothian). 2010; 29(4):477-81. PMid:19926178. http://dx.doi. org/10.1016/j.clnu.2009.10.009.
Toombs RJ, Ducher G, Shepherd JA, Souza MJ. The impact of recent technological advances on the trueness and precision of DXA to assess body composition. Obesity (Silver Spring, Md.). 2012; 20(1):30-9. PMid:21760631. http://dx.doi.org/10.1038/oby.2011.211.
Van den Berg-Emons H, Saris W, Barbanson D, Westerterp K, Huson A, Van Baak M. Daily physical activity of schoolchildren with spastic diplegia and of healthy control subjects. The Journal of Pediatrics. 1995; 127(4):578-84. PMid:7562279. http://dx.doi.org/10.1016/S0022-3476(95)70115-X.
Van der Ploeg GE, Withers RT, Laforgia J. Percent body fat via DEXA: comparison with a four-compartment model. Journal of Applied Physiology. 2003; 94(2):499-506. PMid:12531910. http://dx.doi.org/10.1152/japplphysiol.00436.2002.
Wells JC, Haroun D, Williams JE, Wilson C, Darch T, Viner RM, Eaton S, Fewtrell MS. Evaluation of DXA against the four-component model of body composition in obese children and adolescents aged 5-21 years. International Journal of Obesity. 2010; 34(4):649-55. PMid:20065958. http://dx.doi.org/10.1038/ijo.2009.249.
Williams JE, Wells JC, Wilson CM, Haroun D, Lucas A, Fewtrell MS. Evaluation of Lunar Prodigy dual-energy X-ray absorptiometry for assessing body composition in healthy persons and patients by comparison with the criterion 4-component model. The American Journal of Clinical Nutrition. 2006; 83(5):1047-54. PMid:16685045.
Wong WW, Hergenroeder AC, Stuff JE, Butte NF, Smith EOB, Ellis KJ. Evaluating body fat in girls and female adolescents: advantages and disadvantages of dual-energy X-ray absorptiometry. The American Journal of Clinical Nutrition. 2002; 76(2):384-9. PMid:12145011.
Authors
Eduardo Borba Neves1,2,3*, Lucas Menghin Beraldo1, Stéphani de Pol1, Ana Cláudia Martins Szczypior Costin2,
Claudiana Renata Chiarello2, Leandra Ulbricht1
1 Graduate Program of Biomedical Engineering, Universidade Tecnológica Federal do Paraná – UTFPR, Curitiba, PR, Brazil.
2 Vitória Research Center, Centro Universitário Campos de Andrade – UNIANDRADE, Curitiba, PR, Brazil.