Reference Values from NHANES
Thomas L. Kelly1*, Kevin E. Wilson1, Steven B. Heymsfield2
1Hologic, Inc., Bedford, Massachusetts, United States of America,2Merck & Co., Rahway, New Jersey, United States of America
Abstract
In 2008 the National Center for Health Statistics released a dual energy x-ray absorptiometry (DXA) whole body dataset from the NHANES population-based sample acquired with modern fan beam scanners in 15 counties across the United States from 1999 through 2004. The NHANES dataset was partitioned by gender and ethnicity and DXA whole body measures of %fat, fat mass/height2, lean mass/height2, appendicular lean mass/height2, %fat trunk/%fat legs ratio, trunk/limb fat mass ratio of fat, bone mineral content (BMC) and bone mineral density (BMD) were analyzed to provide reference values for subjects 8 to 85 years old. DXA reference values for adults were normalized to age; reference values for children included total and sub-total whole body results and were normalized to age, height, or lean mass. We developed an obesity classification scheme by using estabbody mass index (BMI) classification thresholds and prevalences in young adults to generate matching classification thresholds for Fat Mass Index (FMI; fat mass/height2). These reference values should be helpful in the evaluation of a variety of adult and childhood abnormalities involving fat, lean, and bone, for establishing entry criteria into clinical trials, and for other medical, research, and epidemiological uses.
Citation:Kelly TL, Wilson KE, Heymsfield SB (2009) Dual Energy X-Ray Absorptiometry Body Composition Reference Values from NHANES. PLoS ONE 4(9): e7038. doi:10.1371/journal.pone.0007038
Editor:Adrian Vella, Mayo Clinic College of Medicine, United States of America
ReceivedApril 16, 2009;AcceptedJuly 31, 2009;PublishedSeptember 15, 2009
Copyright:ß2009 Kelly et al. This is an open-access article distributed under the terms of the Creative Commons Attribution License, which permits unrestricted use, distribution, and reproduction in any medium, provided the original author and source are credited.
Funding:The National Health and Nutrition Survey (NHANES) designed the study and collected the data used in the study in collaboration with the U.S. Center for Disease Control and the National Center for Health Statistics. The analysis of the data presented in the present manuscript was performed by Hologic employees Thomas L. Kelly and Kevin E. Wilson and these tasks were funded by Hologic, Inc. (http://www.hologic.com). The decision to publish and the preparation of the manuscript were performed by these same Hologic employees and Steven B. Heymsfield of Merck and Co., Inc.
Competing Interests:Thomas L. Kelly and Kevin E. Wilson are employees of Hologic, Inc., the DXA manufacturer used to acquire the reference data in the NHANES study. Steven B. Heymsfield is employed by Merck and Co., Inc. as the Executive Director of Clinical Sciences for the pharmaceutical company.
* E-mail: [email protected]
Introduction
The National Health and Nutrition Examination Survey (NHANES) is a program designed to assess the health and nutritional status of adults and children in the United States. NHANES performs a continuous, nationally representative health survey of the civilian, non-institutionalized United States popula-tion, collecting data on about 5000 persons each year from interviews, physical examinations, and medical tests including bone densitometry. Previous NHANES surveys provided a widely accepted DXA proximal femur BMD database [1]. In 1999 NHANES began performing DXA whole body measurements on survey subjects 8 years old and older in three mobile examination centers. DXA whole body data from the mobile exam centers was compiled by the NHANES study group and released on the Center for Disease Control (CDC) website. Previous studies used the data to investigate age, gender, and ethnic differences in whole body and regional BMD [2] or compared percent body fat to BMI, waist circumference, and waist-to-stature ratio in adults [3]. We report here on an age, gender, and ethnicity-specific DXA body composition and bone mineral reference database developed from the NHANES survey data collected from 1999 to 2004.
Additionally, we developed an obesity classification scheme by calculating the prevalences of well established BMI classification thresholds and generating similar thresholds for Fat Mass Index (FMI; fat mass/height2) [4]. These prevalence-matched FMI classifications should offer superior specificity because the index is
based on fat mass, not body weight, which is composed of both fat and lean constituents. The reference data reported here should be helpful in detecting abnormalities in whole body bone and body composition, for establishing reference ranges, for epidemiological considerations (e.g., to establish the prevalence of obesity or sarcopenia), and for entry criteria into clinical trials.
Methods
Subjects
Reference curves were developed for the following three major U.S. ethnic groups: Non-Hispanic Whites (hereafter referred to as White), Non-Hispanic Blacks (hereafter referred to as Black), and Mexican Americans. There were not enough observations to develop reference data for other ethnic minorities. Blacks, Mexican Americans, low-income Whites, adolescents between 12 and 19 years old, and subjects 60 years old and older were oversampled to provide more reliable estimates for these groups [3]. Females were excluded from the DXA examination if a pregnancy test was positive at exam time or if they said they were pregnant. Subjects were also excluded if their reported weight exceeded the DXA scan table weight limit of 136 kg or if their reported height was greater than the DXA scan table length of 196 cm’’.
DXA Measurements
on a QDR 4500A fan beam densitometer (Hologic, Inc., Bedford, MA). All subjects changed into paper gowns and were asked to remove all jewelry and other personal effects that could interfere with the DXA exam. The DXA exams were reviewed and analyzed by the University of California, San Francisco Depart-ment of Radiology Bone Density Group using industry standard techniques. Analysis of all exams was performed using Hologic Discovery software version 12.1 in its default configuration. Exams that contained artifacts which could affect the accuracy of the DXA results, such as prosthetic devices, implants or other extraneous objects had the regional and global DXA results for these exams set to missing in the dataset. The precision of the DXA instrument used in the NHANES study has been reported on elsewhere [5,6,7].
Body composition measurements are technology and calibration dependent and hence results provided by different instruments vary widely. The DXA instruments used in the NHANES survey employed the calibration proposed by Schoeller et al. [8], whereby DXA lean mass results were calibrated to lean mass measured in 7 independent studies utilizing total body water (4 studies), hydrodensitometry (1 study), and four compartment measures (2 studies). The seven independent studies involved a total of 1195 subjects (602 male, 593 female). The BMD and BMC results were calibrated by the DXA manufacturer and maintained by an internal reference system that periodically measures bone and soft tissue equivalent reference standards during the patient measure-ment.
The NHANES data sets contained whole body DXA measurements of bone mineral content (BMC, g), areal bone mineral density (BMD, g/cm2), fat mass (g) and lean mass including BMC (g) and percent fat, calculated as (fat mass divided by total mass)6100 along with demographic information for each subject. The above measurements were also available for a number of pre-defined anatomical regions, including the head, arms, legs, trunk, pelvic regions, sub-total whole body (excluding only the head) and whole body. From these whole body measures the following derivative values were calculated: FMI (fat mass/ height2), lean mass/height2, appendicular lean mass/height2. For adults, only total body reference values and the above derivative reference values were generated. For children, (subjects less than 20 years of age), total body and sub-total body reference values and selected derivative reference values were generated.
There is increasing realization that fat distribution may be as important as total fat mass, so two indices of fat mass distribution, %fat of the trunk divided by %fat of the legs and fat mass of the trunk divided by fat mass of the limbs (fat mass of arms plus legs) were included in this analysis for adults. These indices may have a role in defining metabolic syndrome or lipodystorphy [9,10].
Statistical Methods
Our analysis used the DXA data sets released by NHANES on the Center for Disease Control website http://www.cdc.gov/ nchs/about/major/nhanes/dxx/dxa.htm). To prevent bias in the survey due to the fact that the missing data was not completely random, missing data was multiply imputed at the National Center for Health Statistics as described in the technical documentation available on the above referenced website.
The data was partitioned into subgroups according to gender and ethnicity. Ethnicity was self-reported and adjudicated by NHANES into the three major ethnicity groups reported on here (White, Black, and Mexican American). To reduce the complexity of the reference curve fitting procedure, we further divided the data into adult (ages 20–85) and pediatric (ages 8–19+) groups.
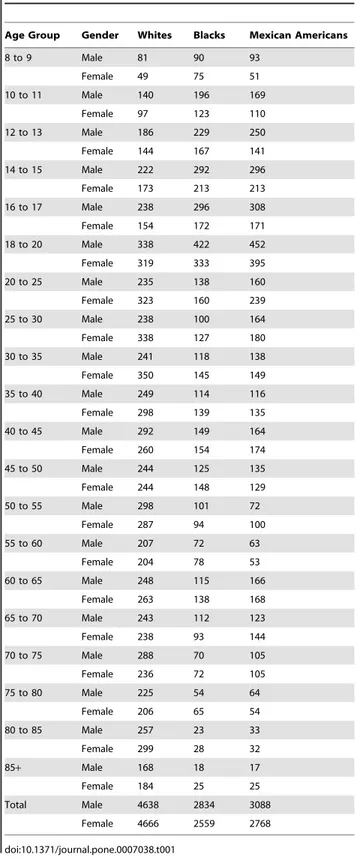
The number of observations in each subgroup is provided in
Table 1.
For adult subjects, DXA measures were modeled by gender and ethnicity using age as the independent variable. Whole body fat and lean mass measurements and appendicular lean mass were normalized to height2as suggested by Heymsfield et al. [11].
Table 1.Number of observations in the reference database by age, gender, and ethnicity.
Age Group Gender Whites Blacks Mexican Americans
8 to 9 Male 81 90 93
Female 49 75 51
10 to 11 Male 140 196 169
Female 97 123 110
12 to 13 Male 186 229 250
Female 144 167 141
14 to 15 Male 222 292 296
Female 173 213 213
16 to 17 Male 238 296 308
Female 154 172 171
18 to 20 Male 338 422 452
Female 319 333 395
20 to 25 Male 235 138 160
Female 323 160 239
25 to 30 Male 238 100 164
Female 338 127 180
30 to 35 Male 241 118 138
Female 350 145 149
35 to 40 Male 249 114 116
Female 298 139 135
40 to 45 Male 292 149 164
Female 260 154 174
45 to 50 Male 244 125 135
Female 244 148 129
50 to 55 Male 298 101 72
Female 287 94 100
55 to 60 Male 207 72 63
Female 204 78 53
60 to 65 Male 248 115 166
Female 263 138 168
65 to 70 Male 243 112 123
Female 238 93 144
70 to 75 Male 288 70 105
Female 236 72 105
75 to 80 Male 225 54 64
Female 206 65 54
80 to 85 Male 257 23 33
Female 299 28 32
85+ Male 168 18 17
Female 184 25 25
Total Male 4638 2834 3088
Female 4666 2559 2768
For pediatric subjects the DXA measures were modeled against age, height, or lean mass as the independent variable. The development of skeletal reference values were based on the recommendations of the ICSD task force for Pediatric Official Positions paper [12]. Additional soft tissue reference values generated in pediatric subjects included total body %fat and lean mass/height2(kg/m2).
A curve fitting procedure called LMS (lmsChartMaker Pro Version 2.3) [13] was used to generate the reference curves because it is capable of handling the relatively common situation where the underlying reference data are skew, i.e. the data are not normally distributed. It does so by normalizing the underlying reference data by dividing the independent measure (e.g. age) into groups and then applying a power transformation which extends one tail of the distribution and contracts the other, eliminating skewness in the variable under analysis. A smooth curve is fitted to the normalizing power transformation for each age group, generating an optimum ‘‘L’’ (power) curve that normalizes the dependent measure, e.g. %fat, over the entire age range. The procedure also fits Median (M) and coefficient of variation (S) curves, and these three curves (L, M, and S) fully describe the reference data. We report the more commonly used population standard deviation, s, which is S times M. The z-scores can be
calculated by the following equation:
Z~M X
=M ð ÞL{1
Ls
or
Z~MlnðX=MÞ=s,L~0
where X is the physical measurement (e.g. DXA Total Body BMD, DXA %fat, etc.), L is the power transformation, M is the median value, and sis the population standard deviation [13].
Percentiles can be obtained from z-scores, e.g. z-scores of21.881,
21.645, 20.674, 0, 0.674, 1.645, and 1.881 correspond to the 3rd, 5th, 25th, 50th, 75th, 95th, and 97th percentiles, respectively. As previously stated, the data were separated into pediatric and adult groups to simplify the curve fitting process and to lower the equivalent degrees of freedom required to fit a suitable curve to the reference data. For example, it was observed that very complex curves were required to produce a satisfactory model of BMC versus age in the entire population, due to the exponential BMC accrual observed in younger subjects combined with a consolida-tion phase of BMC in early adulthood and then a relatively modest decline in BMC that occurs during aging. When these two very different processes (growth and aging) were modeled indepen-dently, much simpler models could be employed with improved goodness of fit and decreased complexity.
During the curve fitting process, the weighted observations from the NHANES data sets were fitted by selecting more parsimonious models over more complex models so long as the goodness of fit was similar, i.e. we tried to avoid over fitting the curves. Further, we employed careful visual inspection of the Q statistic, a plot of standardized residuals in which the data are split into groups and the non-random between group variations in the estimated moments of the z-scores are plotted against the equivalent degrees of freedom used to fit the curve. The Q-statistic was considered satisfactory at or below a value of 2 for the L, M, and S curves and if the fitted curve was reasonably smooth and plausible for the data being fitted, as recommended by the developers of LMS [13].
An obesity classification scheme based on FMI was developed by first calculating the prevalences of established WHO BMI classification thresholds (e.g. normal, overweight, obese) in the present NHANES survey data using ‘‘young normal adults’’ at age of 25. From these prevalence values for BMI, we then generated classification thresholds for FMI that gave the same prevalences as BMI in this population at age 25. In effect we have translated the WHO BMI thresholds into FMI equivalent values by matching the prevalences of the two indices at each classification cut-off point. The FMI classifications should misclassify fewer individuals because FMI is based on fat mass, not body weight, which contains both fat and lean components and therefore misclassifies some muscular subjects as overweight or obese.
Results
The number of observations in the reference database by age group, gender, and ethnicity is provided in Table 1. The reference curves developed from the whole body DXA measures and derivative values from the 2008 NHANES data set are provided in Table 2. Reference values for each of the DXA measures in Table 2 are provided in supplementary Table S1 through Table S20 by sex and ethnicity. Scatter plots with the fits including the mean, the 3rd and 97th percentiles superimposed upon the raw data values are provided in the supplementary Figure S1 through Figure S20 for adults and children.
As expected, significant differences were observed between genders for the various measures and these differences varied with age. The median %fat increased monotonically with age from 17 to 85 in males, while in women it peaked at approximately age 65. Differences between ethnicities were more modest, and varied with gender. Black males had slightly less %fat than non-black males at all ages. Differences in %fat between non-black males and non-black females was about 11–12% and fairly constant with age; larger differences of 12–16% were observed between black males and black females and the differences were more variable with age. As can be seen from the scatter plots in the Supplementary Figures, some of the data were not only significantly skewed, but the degree of skewness and the standard deviation varied with the independent variable. The curve fitting method of LMS smoothly models both varying non-normal distributions and varying standard deviations to construct reference curves which accurately model the true distribution and variance of the underlying data. The LMS curve fitting procedure adjusts for skewness so that the percentile values and z-scores generated by the LMS values are robust when the data are not normally distributed. Statistical theory states that a properly fitted reference curve will generate z-scores very close to zero with a standard deviation very close to unity. Using the SAS system, we calculated z-scores for all subjects and all DXA measures in the NHANES dataset; average z-scores were very close to zero with standard deviations very close to unity for all fitted DXA measures, indicating that the LMS curve fitting procedure produced robust, unbiased fits to the underlying reference data.
genders, with women having higher FMI for all classification categories, requiring the use of gender-specific FMI thresholds. The final FMI classification thresholds in Table 4 were based on the values for White subjects in Table 3. Although the values for the three ethnic groups were similar, there were many more observations for White subjects and hence the use of these values should provide more robust classification estimates.
Discussion
The lack of representative body composition reference values has limited their potential application in clinical and research settings. The current report provides the first reference values on a nationally representative NHANES data set acquired using well established DXA technology. These reference values should prove useful for many applications previously limited by inadequate or unavailable reference data. The NHANES reference values reported here are only directly compatible with Hologic fan beam
DXA scanners operating software version 12.5 or higher utilizing the NHANES calibration. The NHANES reference data used in this study included multiply imputed data and this may be a limitation of the study. As with any reference database, the application of these data to generate diagnostic scores for a given patient or patient population should be performed with appropri-ate measure of forethought and caution.
The reference data presented here may be useful in detecting skeletal and body composition abnormalities in children arising from a wide variety of conditions and chronic diseases including anorexia nervosa, growth hormone deficiency, glucocorticoid use, immobilization, cystic fibrosis, hypogonadism, thalassemia, mal-nutrition, weight management, chronic inflammatory diseases, endocrine disturbances, childhood cancer, transplantation, and other disorders [16]. Increasing numbers of children are being referred for DXA whole body measurements because of its ability to evaluate global and regional bone mineral and body composition. Total body less head (sub-total) whole body results
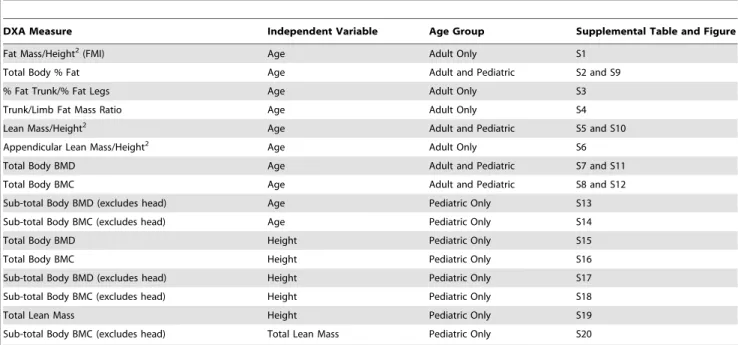
Table 2.List of reference curves generated from the 2008 NHANES DXA whole body data set.
DXA Measure Independent Variable Age Group Supplemental Table and Figure
Fat Mass/Height2(FMI) Age Adult Only S1
Total Body % Fat Age Adult and Pediatric S2 and S9
% Fat Trunk/% Fat Legs Age Adult Only S3
Trunk/Limb Fat Mass Ratio Age Adult Only S4
Lean Mass/Height2 Age Adult and Pediatric S5 and S10
Appendicular Lean Mass/Height2 Age Adult Only S6
Total Body BMD Age Adult and Pediatric S7 and S11
Total Body BMC Age Adult and Pediatric S8 and S12
Sub-total Body BMD (excludes head) Age Pediatric Only S13
Sub-total Body BMC (excludes head) Age Pediatric Only S14
Total Body BMD Height Pediatric Only S15
Total Body BMC Height Pediatric Only S16
Sub-total Body BMD (excludes head) Height Pediatric Only S17
Sub-total Body BMC (excludes head) Height Pediatric Only S18
Total Lean Mass Height Pediatric Only S19
Sub-total Body BMC (excludes head) Total Lean Mass Pediatric Only S20
For each whole body DXA measure in column 1, male and female reference curves for White, Black, and Mexican American subjects were modeled against the independent variable in column 2. Adult age range is 20 to 85 years; Pediatric age range is 8 to 20 years.
doi:10.1371/journal.pone.0007038.t002
Table 3.FMI (kg/m2) thresholds with the same prevalence as a given BMI threshold at age 25.
Sex Ethnicity
FMI matching BMI,16 (prevalence)
FMI matching BMI,17 (prevalence)
FMI matching BMI,18.5 (prevalence)
FMI matching BMI.25 (prevalence)
FMI matching BMI.30 (prevalence)
FMI matching BMI.35 (prevalence)
FMI matching BMI.40 (prevalence)
M White ,1.9 (0.1%) ,2.3 (0.5%) ,2.9 (2.6%) .6.0 (55%) .8.9 (22%) .11.9 (8%) .15.0 (2.6%)
M Black ,1.7 (0.2%) ,2.0 (0.7%) ,2.5 (3.3%) .5.4 (54%) .8.1 (24%) .11.2 (11%) .14.4 (3.3%)
M Mexican American ,2.0 (,0.1%) ,2.3 (0.1%) ,3.0 (0.6%) .6.3 (59%) .9.2 (20%) .12.3 (6%) .15.4 (1.7%)
F White ,3.5 (0.8%) ,4.0 (2.2%) ,4.9 (7%) .9.2 (47%) .12.9 (21%) .16.8 (9%) .20.6 (4.1%)
F Black ,3.4 (0.5%) ,3.9 (1.1%) ,4.7 (3.0%) .8.6 (70%) .11.9 (42%) .15.3 (22%) .18.7 (11%)
F Mexican American ,3.8 (0.1%) ,4.3 (0.5%) ,5.2 (2.2%) .9.4 (62%) .12.8 (29%) .16.1 (12%) .19.2 (4.6%)
The above FMI thresholds gave the same prevalence as BMI for each of the principal BMI classification cut-off points. FMI thresholds were similar among the ethnic groups even though their prevalences vary considerably.
are currently recommended by the ISCD for the evaluation of some childhood disorders [12]. Normalizing to height is appropriate in children with delayed growth and maturation. Furthermore, sub-total (whole body less head) BMD and BMC reference data are necessary because the head is disproportion-ately large in young children and may mask deficits at other skeletal sites. As a result, we developed whole body and sub-total BMD and BMC reference curves for subjects 8 to 20 years old normalized to both age and height. Height is an important body size adjustment in children because children mature at different rates and because many chronically ill children are small for their age. As a result, chronological age may not be the best indicator of a child’s growth and development and therefore age-matched comparisons may not be appropriate. The International Society for Clinical Densitometry (ISCD) also recommends the use of a sufficiently large sample of the general population that takes into consideration gender, age, and ethnicity [17]. The present database meets all of these conditions through the use of gender, and ethnicity specific reference data from NHANES including DXA sub-total body measures normalized to age and to body size (height). We also developed total lean mass versus height and sub-total BMC versus lean mass reference curves for children, as suggested by the ISCD in its latest Official Positions Statement for Pediatric DXA (see www.iscd.org). These two additional curves should allow for the detection of abnormalities in lean mass accrual, e.g. in growth hormone deficient children, and for the detection of abnormalities in the bone-muscle unit, respectively, as suggested by Schoenau et al. [18]. NHANES did not collect information on pubertal development and therefore no adjustment to the reference values to account for delayed maturation was possible. As a result, clinicians should use caution when interpreting DXA measures in subjects with delayed or advanced maturation.
In adults, we normalized both fat and lean mass by height2, just like BMI, which is simply weight divided by height2. Studies have shown that lean mass and weight scale with height to approximately the power of two, establishing an analytic framework for height-scaled indices [11]. The same study also found that fat mass scaled to height2, although the association was weaker. The present study confirmed this observation. We hypothesized that comparison of a subject’s FMI value to healthy young normal FMI values may be useful in the diagnosis and management of clinical obesity, for identifying subjects with high obesity-disease risks, and for enrolling high risk subjects in clinical trials. However, while these cross sectional data enable this definition, whether this definition is useful and appropriate will have to be investigated in future studies which look at obesity related morbidity and outcomes. Defining thresholds in compar-ison to a young adult population has been adopted in the field of osteoporosis research (e.g. the bone mineral density T-score) and has proven itself a useful tool.
Reference curves for appendicular lean mass divided by height2 were developed because this DXA measure is a good surrogate for
skeletal muscle mass and a possible index of sarcopenia [19]. DXA is the only widely available technology capable of providing regional measures of fat and lean mass, and it has been shown that fat and lean distribution may predict health outcomes. A study of elderly subjects [13] demonstrated that sarcopenia, defined as appendicular skeletal muscle mass (kg/height2) less than two standard deviations below the mean of a young reference group, predicted self-reported physical disability in elderly men and women independent of other covariates such as age, obesity, ethnicity, and income level.
In the present NHANES database fat comprises approximately 24% of body weight in males and 38% in females at age 25. Although these %fat values may seem quite high, they are consistent with the %fat reference ranges reported by NHANES in the 1988–1994 survey that utilized bioimpedence analysis. In the 1988–1994 survey, the average male and female %fat values at age 25 were 23% and 34%, respectively [20]. The slightly higher %fat values reported here are consistent with the secular trend of increasing weight and BMI in adult Americans. However, the two studies used different technologies to measure %fat, so direct comparisons between the two studies are difficult to interpret.
DXA is capable of separating body mass into fat and lean components, thereby permitting the evaluation of fat mass without the confounding influence of other tissue constituents. We propose the use of FMI (fat mass/height2) as a measure of abnormally low
or excess fat mass because FMI evaluates only the fat mass component of body weight. Using FMI, abnormalities in fat mass can be assessed without interference from other unrelated components such as excesses or deficits of muscle or water.
Our data reveal %fat and FMI increasing up until about age 80 in men and age 65 in women. Increasing adiposity is an unhealthy trend and hence comparing DXA measurements of %fat and FMI to age-matched peers may not be the most appropriate approach. We postulate that it may be better to compare adults to young normal gender and ethnicity-matched subjects at age 25. For example, using the median value of %fat for non-Hispanic white males at age 25 as an arbitrary ‘‘healthy target’’, only 25% of 45 year old non-Hispanic white males are at or below this target, and by age 69, the number falls to less than 10%. Though alarming, the low percentage of subjects at or below this healthy %fat target probably provides a more realistic assessment of %fat and FMI levels versus comparing subjects to age-matched controls, where by definition 50% of subjects would appear ‘‘normal’’.
We selected from the present data a young adult group with a BMI between 18.5 and 25 to establish reasonably robust reference values for ‘‘normal’’ FMI. Following this same methodology, we developed classifications for FMI by selecting values for FMI that matched the population prevalence of the WHO BMI classifica-tions [14] in young adults at age 25. For example, at age 25 a FMI value of greater than 6 kg/m2 for men and 9 kg/m2for women matches the same prevalence value of ‘‘overweight’’ obtained with a BMI of 25, the BMI cut-off point for ‘‘overweight’’. Similarly, FMI values of greater than or equal to 9 kg/m2 for men and
Table 4.Fat Mass Index (kg/m2) classification ranges.
FMI Class Severe Fat Deficit Moderate Fat Deficit Mild Fat Deficit Normal Excess Fat Obese Class I Obese Class II Obese Class III
M ,2 2 to,2.3 2.3 to,3 3–6 .6 to 9 .9 to 12 .12 to 15 .15
F ,3.5 3.5 to,4 4 to,5 5–9 .9 to 13 .13 to 17 .17 to 21 .21
Classification ranges for FMI that match the prevalences of the WHO BMI classifications (see Table 3). Unlike BMI, FMI is a gender specific measure of fat not confounded by lean tissue.
13 kg/m2 for women defines the same obesity prevalence as a BMI of 30 in this population. Kyle et al. [21] employed similar methodology to generate FMI classifications corresponding to low, normal, overweight, and obese BMI categories. Note that although the same prevalences were used for each classification, FMI and BMI actually classify different subjects into the various categories. Were this not so, it would not be possible for one method to have an advantage over the other. Gallagher et al. [22] used the same approach to generate guidelines for healthy percent fat ranges based on BMI.
A major shortcoming of BMI is that it provides a measure of excess weight, not excess fat. Another obvious limitation of BMI is that it does not account for gender or ethnicity. Table 3 clearly demonstrates that BMI prevalences are heavily influenced by both gender and ethnicity. At age 25, the FMI data in Table 3 indicates that there are substantial differences in adiposity between genders, with mean values for women ranging from 8.9 to 10.9 kg/m2and mean values for males between 5.6 to 6.8 kg/m2 for the three ethnic groups. From these data it appears likely that lacking gender or ethnicity adjustments, BMI may be overestimating obesity in some groups and underestimating it in others. Furthermore, subjects with a high degree of muscularity, e.g. body builders, are often misclassified as ‘‘overweight’’ or ‘‘obese’’ by BMI; these same subjects would probably not fall into an abnormal classification range with FMI because their excess weight is mostly lean mass. Percent body fat (%fat) measurements are also complicated by increased muscularity, but here the bias is in the opposite direction, as increases in muscle mass offset increases in fat mass, making a %fat measurement appear more or less normal.
We suggest that using these proposed FMI values for overweight and obese classifications will result in fewer misclassifications than either BMI or %fat. The FMI classifications in Table 4 should be considered guidelines that may misclassify fewer individuals than BMI because they are based on fat mass instead of weight. It is also worth noting that other technologies which measure fat mass will have to be calibrated to the DXA systems used in this study in order to make uses of these FMI classifications.
Whether or not the use of the proposed FMI classification scheme will confer benefits over BMI in terms of predicting obesity-related morbidity or mortality will have to be investigated in future studies. The FMI classifications presented here are based on prevalence data, not disease risk, and therefore the clinical utility of the FMI classification scheme will not be known until data relating disease risk to FMI becomes available.
Supporting Information
Figure S1 Fat Mass/Height2(kg/m2) vs. Age in adults. Found at: doi:10.1371/journal.pone.0007038.s001 (0.34 MB PDF)
Figure S2 Percent Fat (%) vs. Age in adults.
Found at: doi:10.1371/journal.pone.0007038.s002 (0.31 MB PDF)
Figure S3 % Fat Trunk/%Fat Legs vs. Age in adults.
Found at: doi:10.1371/journal.pone.0007038.s003 (0.34 MB PDF)
Figure S4 Trunk to Limb Fat Mass Ratio vs. Age in adults. Found at: doi:10.1371/journal.pone.0007038.s004 (0.55 MB PDF)
Figure S5 Lean Mass/Height2(kg/m2) vs. Age in adults. Found at: doi:10.1371/journal.pone.0007038.s005 (0.34 MB PDF)
Figure S6 Appendicular Lean Mass/Height2(kg/m2) vs. Age in adults.
Found at: doi:10.1371/journal.pone.0007038.s006 (0.30 MB PDF)
Figure S7 Total Body BMD (g/cm2) vs. Age in adults. Found at: doi:10.1371/journal.pone.0007038.s007 (0.31 MB PDF)
Figure S8 Total Body BMC (g) vs. Age in adults.
Found at: doi:10.1371/journal.pone.0007038.s008 (0.57 MB PDF)
Figure S9 Percent Fat (%) vs. Age in pediatrics.
Found at: doi:10.1371/journal.pone.0007038.s009 (0.18 MB PDF)
Figure S10 Lean Mass/Height2(kg/m2) vs. Age in adults. Found at: doi:10.1371/journal.pone.0007038.s010 (0.20 MB PDF)
Figure S11 Total Body BMD (g/cm2) vs. Age in Pediatrics. Found at: doi:10.1371/journal.pone.0007038.s011 (0.22 MB PDF)
Figure S12 Total Body BMC (g) vs. Age in pediatrics. Found at: doi:10.1371/journal.pone.0007038.s012 (0.23 MB PDF)
Figure S13 Sub-total Body BMD (g/cm2) vs. Age in Pediatrics. Found at: doi:10.1371/journal.pone.0007038.s013 (0.51 MB PDF)
Figure S14 Sub-total Body BMC (g) vs. Age in pediatrics. Found at: doi:10.1371/journal.pone.0007038.s014 (0.23 MB PDF)
Figure S15 Total Body BMD (g/cm2) vs. Height (cm) in
pediatrics.
Found at: doi:10.1371/journal.pone.0007038.s015 (0.51 MB PDF)
Figure S16 Total Body BMC (g) vs. Height (cm) in pediatrics. Found at: doi:10.1371/journal.pone.0007038.s016 (0.24 MB PDF)
Figure S17 Sub-total Body BMD (g/cm2) vs. Height (cm) in pediatrics.
Found at: doi:10.1371/journal.pone.0007038.s017 (0.24 MB PDF)
Figure S18 Sub-total BMC (g) vs. Height (cm) in pediatrics. Found at: doi:10.1371/journal.pone.0007038.s018 (0.25 MB PDF)
Figure S19 Total Lean Mass (g) vs. Height (cm) in pediatrics. Found at: doi:10.1371/journal.pone.0007038.s019 (0.25 MB PDF)
Figure S20 Sub-total BMC (g) vs. Total Lean Mass (g) in pediatrics.
Found at: doi:10.1371/journal.pone.0007038.s020 (0.27 MB PDF)
Table S1 Fat Mass/Height2(kg/m2) vs. Age in adult subjects. Found at: doi:10.1371/journal.pone.0007038.s021 (0.08 MB DOC)
Table S2 %Fat (%) vs. Age in adult subjects.
Found at: doi:10.1371/journal.pone.0007038.s022 (0.08 MB DOC)
Found at: doi:10.1371/journal.pone.0007038.s023 (0.08 MB DOC)
Table S4 Trunk to Limb Fat Mass Ratio vs. Age in Adult subjects.
Found at: doi:10.1371/journal.pone.0007038.s024 (0.08 MB DOC)
Table S5 Lean Mass/Height2(kg/m2) vs. Age in adult subjects. Found at: doi:10.1371/journal.pone.0007038.s025 (0.08 MB DOC)
Table S6 Appendicular Lean Mass/Height2(kg/m2) vs. Age in adult subjects.
Found at: doi:10.1371/journal.pone.0007038.s026 (0.08 MB DOC)
Table S7 Total Body BMD (g/cm2) vs. Age in adult subjects. Found at: doi:10.1371/journal.pone.0007038.s027 (0.08 MB DOC)
Table S8 Total Body BMC (g) vs. Age in adult subjects. Found at: doi:10.1371/journal.pone.0007038.s028 (0.08 MB DOC)
Table S9 %Fat (%) vs. Age in pediatric subjects.
Found at: doi:10.1371/journal.pone.0007038.s029 (0.05 MB DOC)
Table S10 Lean Mass/Height2 (kg/m2) vs. Age in pediatric subjects.
Found at: doi:10.1371/journal.pone.0007038.s030 (0.05 MB DOC)
Table S11 Total Body BMD (g/cm2) vs. Age in pediatric subjects.
Found at: doi:10.1371/journal.pone.0007038.s031 (0.05 MB DOC)
Table S12 Total Body BMC (g) vs. Age in Pediatric subjects. Found at: doi:10.1371/journal.pone.0007038.s032 (0.05 MB DOC)
Table S13 Sub-total Body BMD (g/cm2) vs. Age in pediatric subjects.
Found at: doi:10.1371/journal.pone.0007038.s033 (0.05 MB DOC)
Table S14 Sub-total Body BMC (g) vs. Age in pediatric subjects. Found at: doi:10.1371/journal.pone.0007038.s034 (0.05 MB DOC)
Table S15 Total Body BMD (g/cm2) vs. Height (cm) in pediatric subjects.
Found at: doi:10.1371/journal.pone.0007038.s035 (0.08 MB DOC)
Table S16 Total Body BMC (g) vs. Height (cm) in pediatric subjects.
Found at: doi:10.1371/journal.pone.0007038.s036 (0.09 MB DOC)
Table S17 Sub-total Body BMD (g/cm2) vs. Height (cm) in pediatric subjects.
Found at: doi:10.1371/journal.pone.0007038.s037 (0.08 MB DOC)
Table S18 Sub-total BMC (g) vs. Height (cm) in pediatric subjects.
Found at: doi:10.1371/journal.pone.0007038.s038 (0.08 MB DOC)
Table S19 Total Lean Mass (g) vs. Height (cm) in pediatric subjects.
Found at: doi:10.1371/journal.pone.0007038.s039 (0.08 MB DOC)
Table S20 sub-total BMC (g) vs. Total Lean Mass (g) in pediatric subjects.
Found at: doi:10.1371/journal.pone.0007038.s040 (0.09 MB DOC)
Author Contributions
Conceived and designed the experiments: TLK KEW. Performed the experiments: TLK KEW. Analyzed the data: TLK KEW. Contributed reagents/materials/analysis tools: TLK KEW. Wrote the paper: TLK KEW. Provided medical guidance and expertise, reviewed and edited the paper, recommended various analytical approaches, and developed the analytical framework for the Fat Mass Index measure of obesity used in the study: SBH.
References
1. Looker AC, Wahner HW, Dunn WL, Calvo MS, Harris TB, et al. (1998) Updated data on proximal femur bone mineral levels of US adults. Osteoporos Int 8: 468–489.
2. Looker AC, Melton LJ 3rd, Harris T, Borrud L, Shepherd J, et al. (2008) Age, gender, and race/ethnic differences in total body and subregional bone density. Osteoporos Int.
3. Flegal KM, Shepherd JA, Looker AC, Graubard BI, Borrud LG, et al. (2009) Comparisons of percentage body fat, body mass index, waist circumference, and waist-stature ratio in adults. Am J Clin Nutr 89: 500–508.
4. VanItallie TB, Yang MU, Heymsfield SB, Funk RC, Boileau RA (1990) Height-normalized indices of the body’s fat-free mass and fat mass: potentially useful indicators of nutritional status. Am J Clin Nutr 52: 953–959.
5. Cavalcanti RB, Cheung AM, Raboud J, Walmsley S (2005) Reproducibility of DXA estimations of body fat in HIV lipodystrophy: implications for clinical research. J Clin Densitom 8: 293–297.
6. Hsu FC, Lenchik L, Nicklas BJ, Lohman K, Register TC, et al. (2005) Heritability of body composition measured by DXA in the diabetes heart study. Obes Res 13: 312–319.
7. Leonard CM, Roza MA, Barr RD, Webber CE (2009) Reproducibility of DXA measurements of bone mineral density and body composition in children. Pediatr Radiol 39: 148–154.
8. Schoeller DA, Tylavsky FA, Baer DJ, Chumlea WC, Earthman CP, et al. (2005) QDR 4500A dual-energy X-ray absorptiometer underestimates fat mass in comparison with criterion methods in adults. Am J Clin Nutr 81: 1018–1025. 9. Bonnet E, Delpierre C, Sommet A, Marion-Latard F, Herve R, et al. (2005)
Total body composition by DXA of 241 negative men and 162
HIV-infected men: proposal of reference values for defining lipodystrophy. J Clin Densitom 8: 287–292.
10. Law M, Puls R, Cheng AK, Cooper DA, Carr A (2006) Evaluation of the HIV lipodystrophy case definition in a placebo-controlled, 144-week study in antiretroviral-naive adults. Antivir Ther 11: 179–186.
11. Heymsfield SB, Gallagher D, Mayer L, Beetsch J, Pietrobelli A (2007) Scaling of human body composition to stature: new insights into body mass index. Am J Clin Nutr 86: 82–91.
12. Gordon CM, Bachrach LK, Carpenter TO, Crabtree N, El-Hajj Fuleihan G, et al. (2008) Dual energy X-ray absorptiometry interpretation and reporting in children and adolescents: the 2007 ISCD Pediatric Official Positions. J Clin Densitom 11: 43–58.
13. Pan H, Cole TJ (2004) A comparison of goodness of fit tests for age-related reference ranges. Stat Med 23: 1749–1765.
14. Physical status: the use and interpretation of anthropometry. Report of a WHO Expert Committee. World Health Organ Tech Rep Ser 854: 1–452. 15. Obesity: preventing and managing the global epidemic. Report of a WHO
consultation. World Health Organ Tech Rep Ser 894: i–xii, 1–253. 16. Bishop N, Braillon P, Burnham J, Cimaz R, Davies J, et al. (2008) Dual-energy
X-ray aborptiometry assessment in children and adolescents with diseases that may affect the skeleton: the 2007 ISCD Pediatric Official Positions. J Clin Densitom 11: 29–42.
18. Schoenau E, Frost HM (2002) The ‘‘muscle-bone unit’’ in children and adolescents. Calcif Tissue Int 70: 405–407.
19. Iannuzzi-Sucich M, Prestwood KM, Kenny AM (2002) Prevalence of sarcopenia and predictors of skeletal muscle mass in healthy, older men and women. J Gerontol A Biol Sci Med Sci 57: M772–777.
20. Chumlea WC, Guo SS, Kuczmarski RJ, Flegal KM, Johnson CL, et al. (2002) Body composition estimates from NHANES III bioelectrical impedance data. Int J Obes Relat Metab Disord 26: 1596–1609.
21. Kyle UG, Schutz Y, Dupertuis YM, Pichard C (2003) Body composition interpretation. Contributions of the fat-free mass index and the body fat mass index. Nutrition 19: 597–604.