An Acad Bras Cienc (2016) 88 (1 Suppl.) Anais da Academia Brasileira de Ciências (2016) 88(1 Suppl.): 549-563
(Annals of the Brazilian Academy of Sciences)
Printed version ISSN 0001-3765 / Online version ISSN 1678-2690 http://dx.doi.org/10.1590/0001-3765201620150013
www.scielo.br/aabc
Chlorophyll
fl
uorescence varies more across seasons than
leaf water potential in drought-prone plants
BRUNO H.P. ROSADO1
and EDUARDO A. DE MATTOS2
1
Departamento de Ecologia, Instituto de Biologia Roberto Alcântara Gomes, Universidade do Estado do Rio de Janeiro, Rua São Francisco Xavier, 524, PHLC, sala 220, Maracanã, 20550-900 Rio de Janeiro, RJ, Brasil
2
Departamento de Ecologia, Instituto de Biologia, CCS, Universidade Federal do Rio de Janeiro, Caixa Postal 68020, 21941-970 Rio de Janeiro, RJ, Brasil
Manuscript received on January 9, 2015; accepted for publication on April 3, 2015
ABSTRAC T
Among the effects of environmental change, the intensifi cation of drought events is noteworthy, and tropical vegetation is predicted to be highly vulnerable to it. However, it is not clear how tropical plants in drought-prone habitats will respond to this change. In a coastal sandy plain environment, we evaluated the response of six plant species to water defi cits across seasons, the relationship between their morpho-physiological traits, and which traits would be the best descriptors of plants’ response to drought. Regardless of leaf succulence and phenology, responses between seasons were most strongly related to chlorophyll fl uorescence. In this study we have demonstrated that a better comprehension of how tropical species from drought-prone habitats cope with changes in water availability can be based on seasonal variation in leaf water potential and chlorophyll fl uorescence. Temporal variation in leaf water potential and chlorophyll fl uorescence was found useful for differentiating between groups of sandy soil species that are responsive or unresponsive to water availability. However, chlorophyll fl uorescence appeared to be a more sensitive descriptor of their seasonal and short-term responses.
Key words: drought, functional traits, plant-water relations, photoinhibition, seasonal habitats.
Correspondence to: Bruno Henrique Pimentel Rosado E-mail: brunorosado@gmail.com
INTRODUCTION
In the current scenario of large-scale environmental change, the search for functional traits which will allow us to predict the response of communities and species to changes in conditions and resources has been identifi ed as one of the 100 fundamental questions in ecology (Sutherland et al. 2013). Among the effects of environmental change, the intensification of drought events is noteworthy
in tropical dry forests and savannas have been published (Bucci et al. 2005, Franco 2002, Choat et al. 2006, Méndez-Alonzo et al. 2012), it is still unknown how tropical plants in other tropical drought-prone habitats (e.g. coastal sandy plains) will respond to drought, and which are the best traits for predicting this response.
Plants growing on sandy soils show higher water potential than those growing on clay soils, since sandy soils hold water at high water potential (Sperry et al. 2002). One important process that facilitates highly conservative water use is homeostasis of leaf water potential (ΨL) at midday across seasons (Bucci et al. 2005, Maseda and Fernández 2006). The ability to maintain constant
ΨL might be achieved by mechanisms such as
greater stomatal control and hydraulic adjustments, which reduce transpiration (Maseda and Fernández 2006). Species with less stomatal control may exhibit greater decreases in ΨL (Franks et al. 2007, Maseda and Fernández 2006). An important aspect of species that are able to maintain high ΨL is related to the avoidance of embolism (Sperry et al. 2002, Maseda and Fernández 2006). However, species with lower ΨL can maintain CO2 gas exchange for longer periods during drought, under low soil water availability and/or high air vapor pressure defi cit (VPD). On the other hand, such species might be more susceptible to water loss (Maseda and Fernández 2006). Importantly, the greater the degree of stomatal closure (associated with high ΨL), the dissipation of excitation energy by photosynthetic carbon assimilation will be more reduced (Maseda and Fernández 2006). In addition, greater stomatal closure may result in an increase in carbon starvation due to a decrease in photosynthesis (McDowell et al. 2008, van der Molen et al. 2011).
A further drawback of stomatal closure is that it may lead to light stress, i.e., photoinhibition caused by excess light that is not used in photosynthesis. Changes in the ratio of the yield of variable (Fv)
and maximum (Fm) chlorophyll fluorescence in dark-acclimated leaves can be used to characterize the degree of photoinhibition in plants subjected to environmental stress (Baker 2008). A decrease in the Fv/Fm ratio indicates increased photoprotection, in which excess excitation energy is dissipated as heat, and to direct photodamage to photosystem II (PS II) centers (Krause 1988, Walker 1992). In addition, an increase in thermal dissipation in PS II is associated with a decrease in Fm and minimum chlorophyll fluorescence (F0), whereas damage to the reaction centers increases only F0 (Krause 1988, Porcar-Castell et al. 2008).
Rosado and de Mattos (2010) observed varia-tions between wet and dry seasons in the pressure-volume relationship in species on the Brazilian coastal sandy plains, a species assemblage known as restingas. As expected for plants growing on dry sandy soils, they observed high values of ΨL at the turgor loss point (ΨTLP), less negative osmotic pressure, and a low bulk modulus of elasticity in restinga species (Rosado and de Mattos 2010). However, most species have an average predawn Fv/Fm of less than 0.83 during the dry season, which indicates chronic photoinhibition. To date, how ever, no information is available about the physiologi cal responses of restinga plants to seasonal variation in water availability, or the possible relationship between such physiological responses and leaf phenology.
In this study we chose the two dominant species, which are able to maintain a high minimum
ΨL during the dry season (Rosado and de Mattos
2010), and four less dominant restinga species. These six species occur in a restinga in southeastern Brazil and exhibit a range of leaf succulence,
from 147 to 1105 g m–2, and leaf phenology
An Acad Bras Cienc (2016) 88 (1 Suppl.)
FUNCTIONAL RESPONSES OF DROUGHT-PRONE PLANTS 551
and variations in leaf phenology are commonly associated with the ability to deal with water defi cits (Reich and Borchert 1982, Borchert 1994). We thus addressed the following hypotheses: 1) the six species have different strategies to maintain high
ΨL across seasons based on distinct arrays of leaf
phenology and leaf morpho-physiological traits; 2) seasonal responses of chlorophyll fl uorescence are dependent on seasonal variation in ΨL and both ΨL and chlorophyll fl uorescence are redundant in the description of species’ seasonal responses to water availability. Although soil moisture availability is a function of input minus output of water and rooting depth, the number of rainless days (NRD) might be a useful surrogate for soil moisture availability, especially in sandy soils whose water retention capacity is low (Sperry et al. 2002). Given the low water retention capacity of sandy soils and the occurrence of dry spells in both wet and dry seasons (Cavalin and de Mattos 2007), coastal sandy plants may be differentially predisposed to water shortage during rainless days with varying VPD during wet and dry seasons. Our third hypothesis is therefore as follows: ΨL responds to higher VPD only when NRD is low, but responds to an increase in NRD, regardless of VPD.
MATERIALS AND METHODS
STUDY AREAAND PLANT SPECIES
Our study was conducted in the Restinga of Jurubatiba National Park, (14 140 ha), located in the northern part of the state of Rio de Janeiro, Brazil (extending north-south between 22º00’S and 22º23’S and east-west between 41º15’W and 41º35’W). The maximum temperature (around 30 °C) occurs in January and the minimum (around 20 °C) in July (Henriques et al. 1986). The mean annual temperature is 22.6 ºC. The sandy soil is characterized by low water retention capacity, low nutrient content and low organic matter content. Average annual rainfall is 1100–1300 mm, with a
monthly minimum of 41 mm in dry seasons and a monthly maximum of 189 mm in wet seasons (Araujo et al. 1998). The soil water defi cit is highest during the months of July and August (Henriques et al. 1986). Open Clusia scrub is the most common vegetation type, characterized by vegetation patches composed of shrubs and trees 0.5–8.0 m in height, surrounded by white bare sand that can reach 70 ºC on typical summer days. Clusia scrub covers 40% of the park and is dominated by two species: Clusia hilariana Schltdl. (Clusiaceae) and
Protium icicariba (DC.) Marchand (Burseraceae)
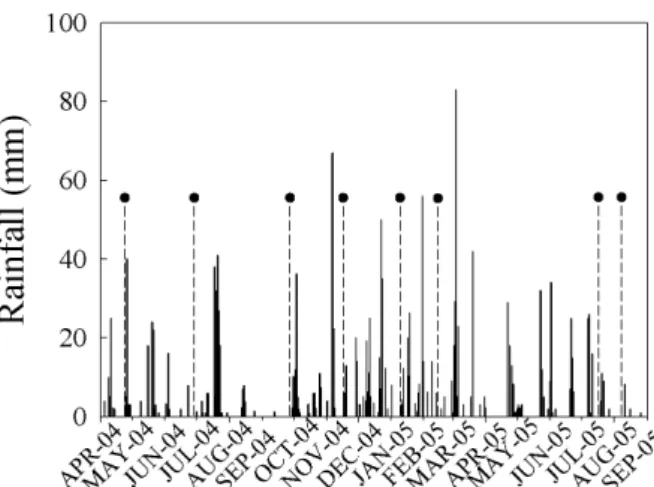
(Araujo et al. 2004). The annual rainfall in 2004 and 2005 was 1319 mm and 1388 mm, respectively. In the months studied, cumulative rainfall was 246 mm in 2004 and 770 mm in 2005, with September 2004 and August 2005 receiving the lowest rainfall (Fig. 1). The rainless period in September 2004 was 30 days long, whereas in August 2005 it lasted 15 days.
Figure 1 - Daily rainfall (mm) during the period of study. The dashed lines indicated by black circles represent the months in which ΨL and chlorophyll afl uorescence were measured.
We selected six shrub species based on varia-tion in leaf succulence and phenology (Rosado and de Mattos 2007) in an area 300 m from the ocean:
(239 g m –2) are classified as successive leaf producers because they produce leaves throughout the year, while Protium icicariba (147 g m –2) ,
Ocotea notata (Nees) Mez (Lauraceae) (169 g
m –2) , Eugenia umbelliflora Berg (Myrtaceae)
(358 g m –2) , and Erythroxylum ovalifolium Peyr. (Erythroxylaceae) (194 g m –2) concentrate their leaf production during the wet season. Erythroxylum is the only species that shows brevi-deciduous behavior. For simplicity, we will refer to each species by its genus name. Clusia is an obligatory CAM plant (Franco et al. 1996) , whereas all other species are C 3 plants.
LEAF WATER POTENTIALAND CHLOROPHYLL
FLUORESCENCE
Leaf water potential was measured using a pres-sure chamber (Model 1000, PMS Instruments, USA) at predawn (Ψ pd) and midday (Ψ md) . The measurements were made using two completely exposed mature leaves from the north-facing side of the canopy of the same three individuals of each species throughout the study. For Erythroxylum measurements, samples were taken from terminal shoots because the leaves and petioles were too small to be used in the pressure chamber. When the difference in ΨL between two leaves of each individual was greater than 0.5 MPa, we measured a third leaf to estimate the average. From April 2004 to August 2005, measurements of ΨL were made during eight months chosen to represent the variation between the wet and the dry seasons. Twelve measurements were made at predawn and 18 at midday for each individual. To represent these data graphically we chose the days with the minimum values for each individual per month. The minimum values are good descriptors of species’ responses to water deficits (Sperry et al. 2002) because they indicate the maximum xylem tension that a given species is able to tolerate while being able to maintain physiological activity (Bhaskar and
Ackerly 2006). At the same time , measurements of chlorophyll a fl uorescence were performed using a pulse-amplitude modulated fl uorometer with a
fi ber optic (FMS-2, Hansatech, UK), on the same two leaves from each individual. The fi ber optic was kept at a constant distance and angle to the leaf surface using a leaf clip. The potential quantum yield of PSII, which is dependent on minimal (F0) and maximal fl uorescence yield (Fm), was measured by applying a pulse of light strong enough to saturate all the PSII reaction centers after the leaf was dark-adapted for 30 min (de Mattos and Luttge 2001). The Fv/Fm ratio was determined just before dawn (Fv/Fm pd) and at midday (Fv/Fm md) by dark-adapting leaves for 30 min. Despite the usual high variability between leaves and individuals, we found it useful to use the absolute values of F0 and Fm to indicate temporal variation in photoprotec-tion or photodamage associated with stress (Porcar-Castell et al. 2008). The averages were calculated in the same way as for ΨL. On each sampling occasion we measured relative humidity and air temperature at 30 min intervals, starting at predawn and ending at midday.
STATISTICAL ANALYSES
An Acad Bras Cienc (2016) 88 (1 Suppl.)
FUNCTIONAL RESPONSES OF DROUGHT-PRONE PLANTS 553
To test hypothesis 3, we ran a multiple line ar regression to determine the contribution of VPD and NRD to variation in Ψmd and Ψpd. We chose the highest VPD on each day when ΨL and Fv/Fmwere
measuredat both predawn and midday, and NRD
during the one, two, three or four weeks before the measurements were taken. We performed a separate multiple regression for each week because we used cumulative NRD. Two-way ANOVAs and multiple linear regressions were carried out in R 2.11.1 (http://www.R-project.org).
RESULTS
LEAF WATER POTENTIAL
The physiological measurements from September 2004 were taken after 30 days of drought, and those from August 2005, after six days of drought (Fig. 1). The highest VPD values were observed during the dry seasons, i.e. September 2004 (46.1 Pa KPa
–1) and August 2005 (36.5 Pa KPa –1) (Table I). The
lowest VPD was observed on a cloudy day in July 2005 (12.3 Pa KPa –1).
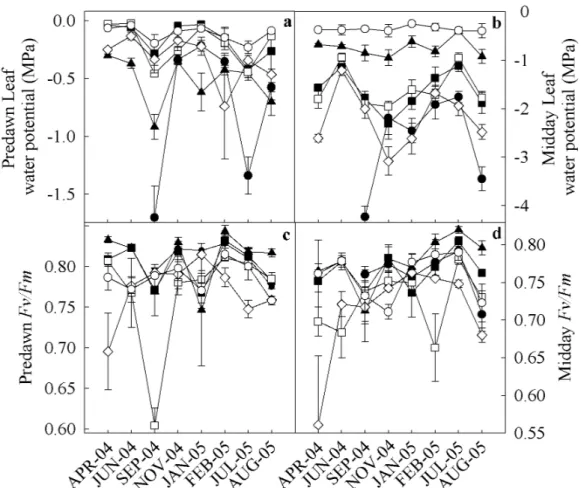
of Ψmd throughout the year, which were greater than those of other species (Tables II and III) . Clusia showed a slightly lower Ψmd than Protium, but the difference was not signifi cant. Clusia and
Erythroxylum showed signifi cantly lower values
of Ψpd in the dry season in comparison to the wet season, but Erythroxylum was the only species with a signifi cantly lower Ψmd in the dry season (Tables II and III). In July 2005, when measurements were made on a cloudy day, all species showed increases in Ψmd .
CHLOROPHYLL A FLUORESCENCE
In all species, predawn and midday Fv/F m varied in the ranges of 0.60-0.90 and 0.55-0.85, respectively. Byrsonima, Eugenia and Clusia showed a decline in Fv/Fmpd in September 2004. Eugenia had the lowest Fv/Fmpd value of all species (Table II, Fig. 2c). With the exception of Protium, all species showed a decline in Fv/Fmpd in the dry season (Tables II and III). A decline in Fv/Fmmd in all species was also observed in September 2004. Clusia and Protium showed the highest Fv/Fmmd in the wet season (0.80 and 0.79, respectively), while Eugenia showed the lowest (0.66) (Table II, Fig. 2d). The highest Fv/ Fmmd values were observed for all species during July 2005. There were no signifi cant differences between seasons for any species (Tables II and III). The F0pd values varied from 180 to 450, with the lowest values observed in August 2005 (Fig. 3). Byrsonima, Clusia and Eugenia showed signifi cant differences between seasons, with the highest values observed in September 2004 (Tables II and III ). Eugenia showed the greatest variation in F0pd throughout the year (Fig. 3a) . Fmpd varied from 800 to 2000 (Fig. 3b). With F0pd,Eugenia showed the greatest variation between seasons. Most species displayed a simultaneous marked decline in Fmpd in
September 2004 and August 2005. Only Eugenia
showed signifi cant differences between seasons, with the lowest values of Fmpd measured in the dry season (Table II).
TABLE I
Daily maximum air vapor pressure defi cit (VPD), measured on the days on which leaf water potential (ΨL)and chlorophyll afl uorescence were measured.
Month and year VPD (Pa KPa–1 )
Apr-04 28.9
June-04 16.1
Sept-04 46.1
Nov-04 27.8
Jan-05 33.9
Feb-05 21.2
July-05 12.3
Aug-05 36.5
Figure 2 - Seasonal variation at predawn, midday in leaf water potential (panels a and b) and chlorophyll a
fl uorescence (panels c and d, respectively). Species are represented as follows: closed squares – Byrsonima
(■); closed triangles – Clusia (▲); closed circles –Erythroxylym (●); open squares – Eugenia (□); open diamonds – Ocotea (◊) and open circles – Protium (○).
TABLE II
Midday leaf water potential (Ψmd), predawn leaf water potential (Ψpd), potential quantum yield of photosystem II at midday (F
v/Fmmd), potential quantum yield of photosystem II at predawn (Fv/Fmpd), minimal fl uorescence yield (F0pd) and maximal fl uorescence yield (Fmpd) during dry and wet seasons. In each column, different letters represent
signifi cant differences (two-way repeated-measures ANOVA, Tukey’s test, P < 0.05).
Species Season Ψmd (MPa) Ψpd (MPa) Fv/Fmmd Fv/Fmpd F0pd Fmpd
Byrsonima Dry –1.78bc –0.28c 0.74ab 0.77b 342.50c 1501.50bcd
Wet –1.37cd –0.15c 0.77 ab 0.83d 263.67a 1577.00de
Clusia Dry –0.85de –0.92b 0.71ab 0.77b 335.00bc 1482.50bcd
Wet –0.82de –0.43c 0.80b 0.84d 251.67a 1617.50de
Erythroxilum Dry –4.23a –1.70a 0.76 ab 0.79bc 286.50abc 1399.25bcde
Wet –1.92bc –0.35c 0.78 ab 0.83d 282.50abc 1642.50de
Eugenia Dry –1.90bc –0.46c 0.74 ab 0.60a 459.00d 1176.50a
Wet –1.72bc –0.19c 0.66a 0.81cd 349.33c 1859.83e
Ocotea Dry –2.00b –0.46c 0.72 ab 0.76b 291.50abc 1230.00abc
Wet –1.68bc –0.22c 0.76 ab 0.82cd 309.83abc 1675.17cde
Protium Dry –0.36e –0.20c 0.73 ab 0.79bc 263.50a 1257.50ab
An
Acad Bras Cienc
(2016)
88
(1 Suppl.)
FUNCTIONAL
RESPONSES OF DROUGHT
-PRONE PLANTS
555
Multiple linear regressions indicated that only
NRD showed a negative relationship with
Ψ pd and F v/F m pd in Clusia , Erythr oxylum and Eugenia . Both
parameters were af
fected in Erythr oxylum , while only to Ψ pd or F v /F m pd
responded to NRD in
Clusia
and
Eugenia
, respectively (T
able IV). For midday
measurements, only
Ocotea
showed a signi
fi
cant
negative relationship between
F v/F m md and VPD (T able V).
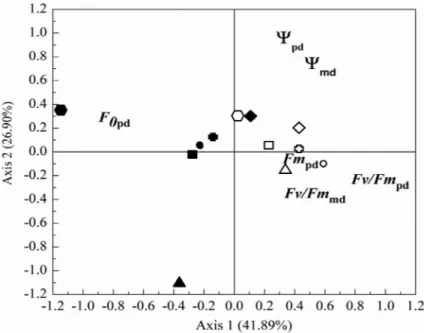
The first two axes of the PCA
explained
41.89% and 26.90% of the variation observed in the
six traits, respectively (T
able
VI).
The
fi
rst axis was
most strongly associated with
F v/F m pd , F m pd and F 0 pd .
The second axis was most strongly associated with
TABLE III
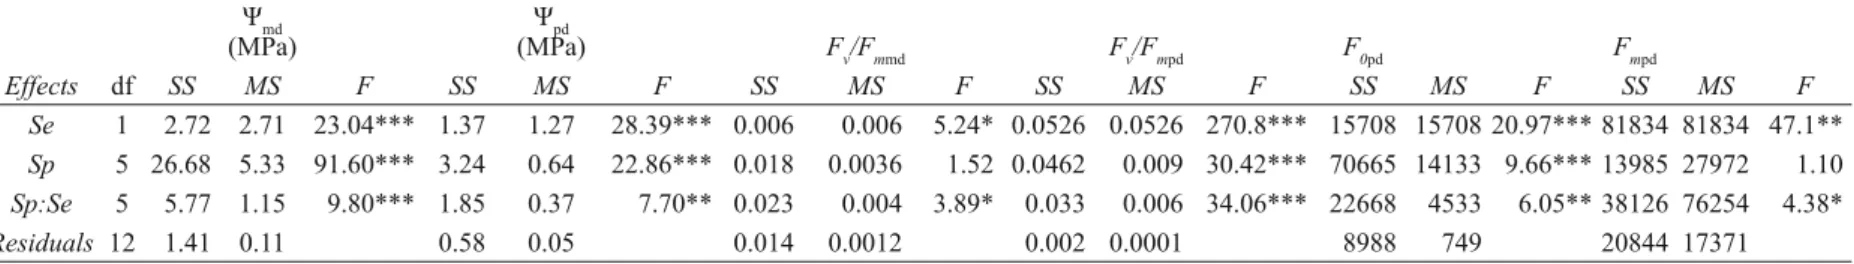
Results of two-way ANOVAs conducted to test the effects of species and seasons on the change in midday leaf water potential (Ψmd), predawn leaf water potential (Ψpd), potential quantum yield of photosystem II at midday (F
v/Fmmd), potential quantum yield of photosystem II at predawn (Fv/Fmpd), minimal fl uorescence yield (F
0pd) and maximal fl uorescence yield (Fmpd). Signifi cance levels are indicated as follows: ‘***’ – P < 0.0001; ‘**’ – P < 0.001; and ‘*’ – P < 0.01. Season is abbreviated to “Se” and species to “Sp”.
Ψmd (MPa)
Ψpd
(MPa) Fv/Fmmd Fv/Fmpd F0pd Fmpd
Effects df SS MS F SS MS F SS MS F SS MS F SS MS F SS MS F Se 1 2.72 2.71 23.04*** 1.37 1.27 28.39*** 0.006 0.006 5.24* 0.0526 0.0526 270.8*** 15708 15708 20.97*** 81834 81834 47.1** Sp 5 26.68 5.33 91.60*** 3.24 0.64 22.86*** 0.018 0.0036 1.52 0.0462 0.009 30.42*** 70665 14133 9.66*** 13985 27972 1.10 Sp:Se 5 5.77 1.15 9.80*** 1.85 0.37 7.70** 0.023 0.004 3.89* 0.033 0.006 34.06*** 22668 4533 6.05** 38126 76254 4.38* Residuals 12 1.41 0.11 0.58 0.05 0.014 0.0012 0.002 0.0001 8988 749 20844 17371
Figur
e 3
- Seasonal variation in predawn basal (
a
) and
maximum
fl
uorescence yield (
b ) ( F 0 pd and F m pd respectively).
Ψpd and Ψmd. From the wet to the dry season, all species showed responses associated with the fi rst axis of variation, being positively associated with F0pd and negatively with Fv/Fmpd, Fv/Fmmd and Fmpd.
For Erythroxylum, however, the response was more closely associated with the second axis, with the response from wet to dry season being negatively related to Ψpd and Ψmd (Fig. 4).
TABLE IV
Coeffi cient of multiple regression between predawn leaf water potential (Ψpd, MPa), F
v/Fmpd, daily maximum air vapor pressure defi cit (VPD, Pa KPa–1
) and the number of rainless days (NRD). We selected the greatest VPD for each day on which measurements were taken and the number of rainless days during
the one, two, three or four weeks before that. Asterisks and bold values indicate P < 0.05.
Weeks
Species Trait Factor 1 2 3 4
Byrsonima Ψpd VPD –0.06 0.04 –0.01 0.00
NRD –0.08 –0.02 –0.02 –0.02
Fv/Fmpd VPD –0.06 0.04 –0.01 0.00
NRD –0.08 –0.02 –0.02 –0.02
Clusia Ψpd VPD 0.12 –0.08 –0.01 –0.02
NRD –0.05 –0.0995* –0.04 –0.04
Fv/Fmpd VPD 0.02 0.005 0.01 0.01
NRD 0.00 –0.01 –0.003 –0.002
Protium Ψpd VPD –0.07 –0.03 –0.06 –0.05
NRD –0.03 –0.01 –0.01 –0.01
Fv/Fmpd VPD 0.03 0.03 0.03 0.03
NRD 0.00 0.00 0.00 0.00
Erytthroxylum Ψpd VPD –0.46 –0.27 –0.56 –0.45
NRD –0.36 –0.21 –0.24* –0.12
Fv/Fmpd VPD 0.03 0.03* 0.03 0.03
NRD –0.01* –0.008* 0.00 –0.0034*
Eugenia Ψpd VPD –0.13 –0.08 –0.17 –0.12
NRD –0.07 –0.03 –0.04 –0.02
Fv/Fmpd VPD –0.07 –0.09 –0.11 –0.09
NRD –0.04 –0.04* –0.024* –0.017*
Ocotea Ψpd VPD 0.01 0.12 0.02 0.06
NRD –0.06 0.00 –0.02 –0.01
Fv/Fmpd VPD –0.03 –0.03 –0.02 –0.03
NRD –0.01 0.00 0.00 0.00
TABLE V
Coeffi cient of multiple regression between temporal variation in midday leaf water potential (Ψmd, MPa), F
v/Fmmd, daily maximum air vapor pressure defi cit (VPD) and the number of rainless days (NRD). We selected the greatest VPD on each day on which measurements were taken and the number of rainless days
during the one, two, three or four weeks before that. Asterisks and bold values indicate P < 0.05.
Weeks
Species Trait Factor 1 2 3 4
Byrsonima Ψmd VPD –0.64 –0.31 –0.29 –0.35
NRD 0.18 0 0.03 0.02
Fv/Fmmd VPD –0.04 –0.03 –0.03 –0.03
An Acad Bras Cienc (2016) 88 (1 Suppl.)
FUNCTIONAL RESPONSES OF DROUGHT-PRONE PLANTS 557
Weeks
Species Trait Factor 1 2 3 4
Clusia Ψmd VPD –0.34 –0.3 –0.31 –0.28
NRD 0.02 –0.04 –0.01 –0.01
Fv/Fmmd VPD –0.05 –0.05 –0.07 –0.04
NRD 0 –0.01 –0.01 0
Protium Ψmd VPD 0.03 0.04 0.04 0.04
NRD –0.01 0 0 0
Fv/Fmmd VPD –0.02 –0.02 –0.02 –0.02
NRD –0.01 –0.01 0 0
Erythroxylym Ψmd VPD –0.87 –0.45 –1.14 –0.54
NRD –0.41 –0.44 –0.27 –0.19
Fv/Fmmd VPD 0.01 0.02 0 0.01
NRD –0.01 –0.01 0 0
Eugenia Ψmd VPD –0.78 –0.84 –0.77 –0.82
NRD 0 –0.04 0 –0.01
Fv/Fmmd VPD –0.78 –0.84 –0.77 –0.05
NRD 0 –0.04 0 0
Ocotea Ψmd VPD –0.05 –0.13 0.06 –0.14
NRD 0.23 0.12 0.1 0.05
Fv/Fmmd VPD –0.12 –0.12* –0.12 –0.12*
NRD 0 0 0 0
TABLE V (continuation)
TABLE VI
Eigen vector scores from a PCA of three axes obtained from a matrix of six traits and six species in two seasons. The six
traits measured were midday leaf water potential (Ψmd), predawn leaf water potential (Ψpd), potential quantum yield
of photosystem II at midday (F
v/Fmmd), potential quantum yield of photosystem II at predawn (F
v/Fmpd), minimal
fl uorescence yield (F
0pd) and maximal fl uorescence yield (F
mpd). Percentage values indicate the percentage of variation accounted for by each axis. Bold values
indicate the highest values for each axis. Axis 1 Axis 2 Axis 3 Physiological Traits 41.89% 26.90% 18.92%
Fv/Fmpd 0.928 –0.270 0.218
F0pd –0.838 0.347 0.224
Fmpd 0.618 0.013 0.705
Fv/Fmmd 0.462 –0.321 –0.677
Ψmd 0.440 0.776 –0.287
DISCUSSION
Most of the six species did not differ across seasons in their ability to maintain Ψmd. Although the dominant species, Clusia and Protium had higher values of Ψmd throughout, the other species, except for Erythroxylum, maintained similar values throughout the year, which were consistently lower than the dominant species. These values were maintained despite differences in leaf morphology and phenology. This agrees with reports indicating that the maintenance of Ψmd occurs in a series of ways, in contrast with the maintenance of constant hydraulic conductance, which occurs through changes in architectural traits such as leaf area per sapwood area (Meinzer et al. 1999, Bucci et al. 2005, Maseda and Fernández 2006, Franks et al. 2007). In Protium, for instance, the ability to maintain a higher Ψmd throughout the year might be mediated by a substantial reduction in leaf number
during the dry season (Rosado and de Mattos 2010). Regardless of the mechanisms involved, it is noteworthy that only the two dominant species exhibited higher and constant Ψmd, which suggests a higher safety margin for embolism (Sperry et al. 2002). Our fi ndings support that in drought-prone habitats most species are able to maintain similar
Ψmd between dry and wet seasons. However, only
a small number of species are able to maintain a relatively high Ψmd, which may be an important trait related to the ability of these species to achieve dominance in sandy, drought-prone environments.
ARETHE SEASONAL RESPONSESOF CHLOROPHYLL
FLUORESCENCE VARIABLES RELATEDTOTHE SEASONAL
VARIATIONINΨL?
Fv/Fmpd was lower in the restinga plants than the optimal value for most species, which indicates photoinhibition (Demmig-Adams and Adams 2006). However, this was less pronounced than
Figure 4 - PCA ordination of six species in two seasons on the basis of six traits: predawn (Ψpd) and midday leaf water potential (Ψmd), predawn (Fv/ Fmpd), midday chlorophyll fl uorescence (Fv/Fmmd), predawn basal (F0pd) and maximum fl uorescence yield (Fmpd). Each species, in the wet and dry seasons (open and closed symbols, respectively) are represented as follows: Byrsonima
(cross), Clusia (circles), Eugenia (hexagon), Erythroxylym (triangle), Protium
An Acad Bras Cienc (2016) 88 (1 Suppl.)
FUNCTIONAL RESPONSES OF DROUGHT-PRONE PLANTS 559
in plants from other harsh environments, where Fv/Fm may reach values below 0.5 (Bellot et al. 2004, Zunzunegui et al. 2005, Ogaya et al. 2011 ). Nevertheless, there is a positive linear relationship between Fv/Fmpd and the leaf turnover rate for restinga species, which suggests that there are ecophysiological implications of even small decreases in Fv/Fmpd (Rosado and de Mattos 2010). The greatest decreases in Fv/Fmpd and Fv/ Fmmd occurred after a rainless period of 30 days in September 2004. These decreases were probably caused by low soil water potential and high radiation load, as observed for woody species in semi-arid Mediterranean shrubland in Spain (Bellot et al. 2004).
The reversible decline in Fv/Fm reflects the protective down-regulation of PS II, which may prevent damage to the reaction centers when there is excess excitation energy (Walker 1992, Demmig-Adams and Demmig-Adams 2006). However, a comparison of changes in F0 and Fm indicates whether species are exhibiting increased thermal dissipation of excitation energy or deactivation of the PSII reaction centers (Krause 1988, Porcar-Castell et al. 2008). Thermal dissipation is associated with decreases in F0pd and Fmpd, as observed when the dry season of 2005 was approaching, whereas photodamage and deactivation only increase F0pd, as observed in September 2004 in most species. For Clusia, Byrsonima and Eugenia, F0pd increased to various degrees, yet always signifi cantly during the dry season, with the highest values recorded for Eugenia. This indicates that these species were subjected to photodamage (Krause 1988), as could be expected for plants exhibiting constant Ψmd, due to strong stomatal closure (McDowell et al. 2008). Photoinhibition may have been alleviated during the cloudy day in July 2005, when all species showed the highest Fv/Fmmd. Cloudy days may also have decreased the strength of the general declining trend in F0pd throughout 2005, because the higher accumulated rainfall in 2005 (770 mm)
in comparison with 2004 (246 mm) suggests that there were more cloudy days, which would reduce average light intensity.
Irrespective of leaf succulence and leaf phenology, with the exception of Erythroxylum, physiological changes of species across seasons were more strongly captured by chlorophyll
fl uorescence variables than to ΨL. The multivariate analysis showed that the responses of all species across seasons were positively associated with F0pd, which suggests the occurrence of photodamage during the dry season. However, the differential displacement of each species between seasons in the multivariate space indicates different degrees of susceptibility to photoinhibition, with Eugenia showing the strongest changes between seasons. The only species for which changes in fl uorescence between seasons was also paralled by changes in
Ψmd and Ψpd, was Erythroxylum. For Erythroxylum, the negative relationship between Ψmd and Ψpd was expected because of this species’ higher wood density, which may decrease water transport to leaves (Rosado and de Mattos 2010).
HOWDOES VARIATIONINΨL DIFFERIN RESPONSETO NRD
AND VPD THROUGHOUTTHE YEAR?
The less responsive behavior of Byrsonima, Clusia
and Protium to NRD and VPD indicates that these
species have the ability to decouple from the main factors that drive daily and seasonal variation in water availability. In fact, Byrsonima and Protium show a strong midday depression of stomatal conductance in both wet and dry seasons (Lignani
2008), and the CAM photosynthesis in Clusia
and ΨTLP (Rosado and de Mattos 2010). The less negative ΨTLP associated with a higher rate of leaf shedding may be an escape strategy for Byrsonima, allowing it to avoid the possible adverse effects of NRD and/or VPD on Ψmd and/orΨpd (Rosado and de Mattos 2010).
On the other hand, Eugenia, Erythroxylum and
Ocotea responded strongly to NRD and/or VPD
(Table IV). The negative relationship between NRD and Ψpd for Erythroxylum may indicate a lower capacity for xylem refi lling during prolonged rainless periods because of the species’ high wood density (Donovan et al. 2001, Rosado and de Mattos 2010). Interestingly, predawn and midday Fv/Fm showed significant negative relationships with VPD and NRD, indicating that chlorophyll fl uo-rescence may be more descriptive of the response of a species to water availability than ΨL.
Plants growing on sandy soils have a higher
Ψpd than those growing on clay soils (Sperry et al.
2002, Sperry and Hacke 2002). However, this is true only when the former have access to deeper soil water profi les and/or soil moisture is frequently replenished by rainfall (Fravolini et al. 2005, Hultine et al. 2005). The Ψpd of restinga species growing where mean annual rainfall was 1100–1300 mm was higher than for other species occurring in sandy environments where the mean annual rainfall was around 450 mm (-0.1 to -1.70 MPa compared with -1.0 to -5.0 MPa, respectively) (Zunzunegui et al. 2005, Fravolini et al. 2005, Hultine et al. 2005). In comparison with other seasonal environments, the variation in Ψpd observed in restinga plants, -0.1 to -0.43 MPa in the wet season and -0.19 to -1.70 MPa during the dry season, was not as marked. In Mediterranean plants, Ψpd varies from -0.1 to -0.86 MPa during spring and from -1.45 to -2.28 MPa during summer (Mediavilla and Escudero 2004, David et al. 2007). In the Brazilian savannas, woody species show a significant decline in Ψpd,from values close to 0 MPa in the wet season to around -0.5 to -1.0 MPa during the dry season (Bucci et
al. 2005). It must be remembered, however, that it is not only soil properties, root access to the water table and/or rainfall patterns that affect Ψpd (Sperry et al. 2002, Fravolini et al. 2005). Differences in
Ψpd among species may also be related to processes
such as hydraulic conductance and nocturnal transpiration (Donovan et al. 2001, Dawson et al. 2007). For Clusia, the CAM behavior of nocturnal stomatal opening, as also observed in C3 plants that show nocturnal transpiration, could explain the low Ψpd, (Donovan et al. 2001). On the other hand, in Erythroxylum, the only brevi-deciduous species in this study, a decrease in the rate of water delivery to the leaves because of the species’ high wood density (~0.77 g cm –3; Rosado and de Mattos 2010) could promote more negative Ψpd and Ψmd, as described in other studies (Donovan et al. 2001, Meinzer 2003).
environ-An Acad Bras Cienc (2016) 88 (1 Suppl.)
FUNCTIONAL RESPONSES OF DROUGHT-PRONE PLANTS 561
mental fi ltering that affects community assembly in resource-poor habitats.
ACKNOWLEDGMENTS
We are very grateful to P. Cavalin and M.I. Braz for their invaluable help with fi eldwork. We thank the staff of NUPEM-UFRJ and the National Park for logistic support. We deeply thank both reviewers for good comments and suggestions that helped us improve the manuscript. The authors were supported by grants from Conselho Nacional de Desenvolvimento Científico e Tecnológico (CNPq), Fundação Carlos Chagas Filho de Amparo à Pesquisa do Estado do Rio de Janeiro (FAPERJ) and the Programa de Pesquisas Ecológicas de Longa Duração no Brasil (PELD-CNPq).
RESUMO
Entre os efeitos da mudança ambiental, a intensifi cação dos eventos de seca é notável e a vegetação tropical é apontada como altamente vulnerável a ela. No entanto, não está claro como plantas tropicais em habitats propensos à seca responderão a essa mudança. Em um ambiente de planície costeira arenosa, avaliamos a resposta de seis espécies vegetais à defi cit de água ao longo das estações, a relação entre as suas características morfo-fi siológicas, e quais características seriam as melhores descritoras de resposta das plantas à seca. Independentemente de suculência foliar e fenologia, respostas entre as estações foram mais fortemente relacionadas a fl uorescência da clorofi la. Neste estudo demonstramos que a melhor compreensão de como espécies tropicais de habitats propensos a seca lidam com mudanças na disponibilidade de água pode ser baseada na variação sazonal de potencial hídrico e fl uorescência da clorofi la. Esta variação temporal de potencial hídrico e fl uorescência da clorofi la foram úteis para diferenciar grupos de espécies que são responsivas ou não responsivas à disponibilidade de água. Ressalta-se que a fl uorescência da clorofi la foi o descritor mais sensível de respostas das espécies tanto em termos sazonais quanto em curto prazo.
Palavras-chave: seca, característica funcional, relações hídricas em plantas, fotoinibição, habitats sazonais.
REFERENCE S
ARAUJO DSD, PEREIRA MCA AND PIMENTEL M. 2004. Flora e estrutura de comunidades na Restinga de Jurubatiba - Síntese dos conhecimentos com enfoque especial para a Formação Aberta de Clusia. In: Rocha CFD, Esteves FA and Scarano FR (Eds), Pesquisas de longa duração na restinga de Jurubatiba Ecologia, história natural e conservação, São Carlos: RiMa Editora, p. 59-76. ARAUJO DSD, SCARANO FR, SÁ CFC, KURTZ BC, ZALUAR
HLT, MONTEZUMA RCM AND OLIVEIRA RC. 1998. Comunidades vegetais do Parque Nacional da Restinga de Jurubatiba. In: Esteves FA (Ed), Ecologia das Lagoas Costeiras do Parque Nacional da Restinga de Jurubatiba e do Município de Macaé (RJ), Rio de Janeiro: NUPEM-UFRJ, p. 39-62.
BAKER NR. 2008. Chlorophyll Fluorescence: A Probe of Photosynthesis In Vivo. Annu Rev Plant Biol 59: 89-113. BARTLETT MK, SCOFFONI C AND SACK L. 2012. The
deter-minants of leaf turgor loss point and prediction of drought tolerance of species and biomes: a global meta-analysis. Ecol Lett 15: 393-405.
BELLOT J, MAESTRE FT AND HERNÁNDEZ N. 2004. Spatio-temporal dynamics of chlorophyll fluorescence in a semi-arid Mediterranean shrubland. J Arid Environ 58: 295-308. BHASKAR R AND ACKERLY D. 2006. Ecological relevance of minimum seasonal water potential. Physiol Plantarum 127: 353-359.
BORCHERT R. 1994. Soil and stem water storage determine phenology and distribution of tropical dry forests trees. Ecology 75: 1437-1449.
BUCCI SJ, GOLDSTEIN G, MEINZER FC, FRANCO AC, CAMPANELLO P AND SCHOLZ FG. 2005. Mechanisms contributing to seasonal homeostasis of minimum leaf water potential and predawn disequilibrium between soil and plant water potential in Neotropical savanna trees. Trees 19: 296-304.
CAVALIN PO AND DE MATTOS EA. 2007. Spatio-temporal var iation of photosynthetic pigments in the CAM tree Clusia hilariana Schlechtendal associated with dry spells during the rainy season in southeastern Brazil. Trees 21: 671-675.
CHOAT B, BALL MC, LULY JG, DONNELLY CF AND HOLTUM
JAM. 2006. Seasonal patterns of leaf gas exchange and water relations in dry rain forest trees of contrasting leaf phenology. Tree Physiol 26: 657-664.
CHOAT B ETAL. 2012. Global convergence in the vulnerability of forests to drought. Nature 491: 752-755.
DAVID TS ET AL. 2007. Water-use strategies in two co-occurring Mediterranean evergreen oaks: surviving the summer drought. Tree Physiol 27: 793-803.
AR. 2007. Nighttime transpiration in woody plants from contrasting ecosystems. Tree Physiol 27: 561-575. DE MATTOS EA AND LUTTGE U. 2001. Chlorophyll
fluo-rescence and organic acid oscillations during transition from CAM to C3-photosynthesis in Clusia minor L. (Clu-siaceae). Ann Bot 88: 457-463.
DEMMIG-ADAMS B AND ADAMS WW. 2006. Photoprotection in an ecological context: the remarkable complexity of thermal energy dissipation. New Phytol 172: 11-21. DONOVAN LA, LINTON MJ AND RICHARDS JH. 2001.
Pre-dawn plant water potential does not necessarily equilibrate with soil water potential under well-watered conditions. Oecologia 129: 328-335.
FRANCO AC. 2002. Ecophysiology of Woody Plants. In: Oliveira PS and Marques RJ (Eds), The Cerrados of Brazil - Ecology and Natural History of Neotropical Savanna, NY: Columbia Univ. Press, p. 388.
FRANCO AC, HAAG-KERWER A, HERZOG B, GRAMS TEE, BALL E, DE MATTOS EA, SCARANO FR, GARCIA F, MANTOVANI A AND LUTTGE U. 1996. The effect of light levels on daily patterns of chlorophyll fluorescence and organic acid accumulation in the tropical CAM tree Clusia hilariana. Trees 10: 359-365.
FRANKS PJ, DRAKE PL AND FROEND RH. 2007. Anisohydric but isohydrodynamic: seasonally constant plant water potential gradient explained by a stomatal control mechanism incorporating variable plant hydraulic conductance. Plant Cell Environ 30: 19-30.
FRAVOLINI A, HULTINE KR, BRUGNOLI E, GAZAL R, ENGLISH NB AND WILLIAMS DG. 2005. Precipitation pulse use by an invasive woody legume: the role of soil texture and pulse size. Oecologia 144: 618-627.
HENRIQUES RPB, ARAUJO DSD AND HAY JD. 1986. Des-crição e classificação dos tipos de vegetação da restinga de Carapebús, Rio de Janeiro. Rev Bras Bot 9: 173-189. HULTINE KR, KOEPKE DF, POCKMAN WT, FRAVOLINI A,
SPERRY JS AND WILLIAMS DG. 2005. Influence of soil texture on hydraulic properties and water relations of a dominant warm-desert phreatophyte. Tree Physiol 26: 313-323.
KRAUSE GH. 1988. Photoinhibition of photosynthesis. An eva luation of damaging and protective mechanisms. Phy-siol Plantarum 74: 566-574.
LAMONT B AND LAMONT H. 2000. Utilizable water in leaves of 8 arid species as derived from pressure-volume curves and chlorophyll fluorescence. Physiol Plantarum 110: 64-71. LIGNANI LDB. 2008. Respostas Ecofisiológicas Contrastantes na Vegetação Aberta da Restinga de Jurubatiba, Macaé, RJ: Um estudo de caso em Protium icicariba (Burseraceae), uma espécie abundante, e Byrsonima sericea (Malpighia-ceae), uma espécie subordinada. Dissertação (Mestrado em Ecologia), Universidade Federal do Rio de Janeiro. (Unpublished).
MASEDA PH AND FERNÁNDEZ RJ. 2006. Stay wet or else: three ways in which plants can adjust hydraulically to their environment. J Exp Bot 57: 3963-3977.
MCDOWELL N ETAL. 2008. Mechanisms of plant survival and mortality during drought: why do some plants survive while others succumb to drought? New Phytol 178: 719-739. MCDOWELL NG, BEERLING DJ, BRESHEARS DD, FISHER
RA, RAFFA KF AND STITT M. 2011. The interdependence of mechanisms underlying climate-driven vegetation mortality. Trends Ecol Evol (Personal edition) 26: 523-532.
MEDIAVILLA S AND ESCUDERO A. 2004. Stomatal responses to drought of mature trees and seedlings of two co-occurring Mediterranean oaks. Forest Ecol Manag 187: 281-294.
MEINZER F. 2003. Functional Convergence in plant responses to the environment. Oecologia 134: 1-11.
MEINZER FC, GOLDSTEIN G, FRANCO AC, BUSTAMANTE M, IGLER E, JACKSON P, CALDAS L AND RUNDEL PW. 1999. Atmospheric and hydraulic limitations on transpiration in Brazilian cerrado woody species. Funct Ecol 13: 273-282. MÉNDEZ-ALONZO R, PAZ H, ZULUAGA RC, ROSELL JA AND
OLSON ME. 2012. Coordinated evolution of leaf and stem economics in tropical dry forest trees. Ecology 93: 2397-2406.
NOY-MEIR I. 1972. Desert ecosystems: environment and producers. Ann Rev Ecol Syst 4: 25-51.
OGAYA R, PEÑUELAS J, ASENSIO D AND LLUSIÀ J. 2011. Chlorophyll fluorescence responses to temperature and water availability in two co-dominant Mediterranean shrub and tree species in a long-term field experiment simulating climate change. Environ Exp Bot 71: 123-127.
PILLAR VD. 1997. Multivariate exploratory analysis and rando-mization testing with MULTIV. Coenoses 12: 145-148. PORCAR-CASTELL A, JUUROLA E, NIKINMAA E, BERNINGER
F, ENSMINGER I AND HARI P. 2008. Seasonal acclimation of photosystem II in Pinus sylvestris. I. Estimating the rate constants of sustained thermal energy dissipation and photochemistry. Tree Physiol 28: 1475-1482.
REICH P AND BORCHERT R. 1982. Phenology and ecophys-iology of tropical tree, Tabebuia neochrysantha (Bigno-niaceae). Ecology 63: 294-299.
ROSADO BHP AND DE MATTOS EA. 2007. Variação temporal de características morfológicas de folhas em dez espécies do Parque Nacional da Restinga de Jurubatiba, Macaé, RJ, Brasil. Acta Bot Bras 21: 741-752.
ROSADO BHP AND DE MATTOS EA. 2010. Interspecific variation of functional traits in a CAM-tree dominated sandy coastal plain. J Veg Sci 21: 43-54.
An Acad Bras Cienc (2016) 88 (1 Suppl.)
FUNCTIONAL RESPONSES OF DROUGHT-PRONE PLANTS 563
SPERRY JS AND HACKE UG. 2002. Desert shrub water relations with respect to soil characteristics and plant functional type. Funct Ecol 16: 367-378.
SPERRY JS, HACKE UG, OREN R AND COMSTOCK JP. 2002. Water deficits and hydraulic limits to leaf water supply. Plant Cell Environ 25: 251-263.
SUTHERLAND WJ ETAL. 2013. Identification of 100 funda-mental ecological questions. J Ecol 101: 58-67.
VAN DER MOLEN MK ETAL. 2011. Drought and ecosystem carbon cycling. Agr Forest Meteorol 151: 765-773. WALKER D. 1992. Excited leaves. New Phytol 121: 325-345. ZUNZUNEGUI M, BARRADAS MCD, AIN-LHOUT F, CLAVIJO