Restinga forests of the Brazilian coast: richness and abundance of tree species on different soils
LUIZ F.S. MAGNAGO1, SEBASTIÃO V. MARTINS2, CARLOS E.G.R. SCHAEFER3 and ANDREZA V. NERI1 1
Universidade Federal de Viçosa, Departamento de Biologia Vegetal, Avenida Peter Henry Rolfs, s/n, Campus Universitário, 36570-000 Viçosa, MG, Brasil
2 Universidade Federal de Viçosa, Departamento de Engenharia Florestal, Avenida Peter Henry Rolfs, s/n, Campus Universitário, 36570-000 Viçosa, MG, Brasil
3
Universidade Federal de Viçosa, Departamento de Solos,
Avenida Peter Henry Rolfs, s/n, Campus Universitário, 36570-000 Viçosa, MG, Brasil
Manuscript received on August 23, 2011; accepted for publication on October 11, 2011
ABSTRACT
The aim of this study was to determine changes in composition, abundance and richness of species along a
forest gradient with varying soils and flood regimes. The forests are located on the left bank of the lower Jucu
River, in Jacarenema Natural Municipal Park, Espírito Santo. A survey of shrub/tree species was done in 80 plots, 5x25 m, equally distributed among the forests studied. We included in the sampling all individuals with
≥3.2 cm diameter at breast height (1.30 m). Soil samples were collected from the surface layer (0-10 cm) in each plot for chemical and physical analysis. The results indicate that a significant pedological gradient occurs, which is influenced by varying seasonal groundwater levels. Restinga forest formations showed significant differences in species richness, except for Non-flooded Forest and Non-flooded Forest Transition.
The Canonical Correlation Analysis (CCA) showed that some species are distributed along the gradient under
the combined influence of drainage, nutrient concentration and physical characteristics of the soil. Regarding the variables tested, flooding seems to be a more limiting factor for the establishment of plant species in
Restinga forests than basic soil fertility attributes.
Key words: Vegetation, Flooded Forests, Coastal ecosystem, Sandy Soils, Quaternary deposits, Marine
influence, Riparian forests.
Correspondence to: Luiz Fernando Silva Magnago E-mail: luiz_fsm@hotmail.com
INTRODUCTION
Marine regressions and transgressions following sea level changes during the Quaternary period allowed the formation of beach ridges, dunes and interdunes along the Brazilain coast (Martin et al. 1997). These depositional features were formed during the Late Pleistocene and Holocene epochs, forming extensive sandy coastal plains, with major deposition of mature
quartz sands and local contri butions of fluvial sands,
especially near large river estuaries (Pereira 2003). On
these sandy coastal plains we find the Restinga
eco-system (Araujo et al. 1998) occupying nearly 80% of the Brazilian coastal fringe, or about 7110 km (Suguio and Tessler 1984). This ecosystem is associated with the Atlantic Rain Forest biome (Coutinho 2006).
The topographical differences among the beach ridges, dunes and interdunes in the Restinga are associated with different groundwater levels,
(Annals of the Brazilian Academy of Sciences)
resulting in varying pedological conditions, which can, among other factors, lead to the heterogeneity of vegetation types in the Brazilian Restinga.
According to ter Braak and Prentice (1988), biotic communities show greater development
in the narrow confines of their optimum, varying
with the existence of physical gradients. Among the abiotic factors, physical, chemical and soil drainage characteristics have been widely cited as important factors for the distribution of plant species in communities of tropical environments (Lathwell and Grove 1986, Oliveira-Filho et al. 1994, Clark et al. 1999, Budke et al. 2007, Ferreira-Junior et al. 2007). Thus, the various interactions between abiotic factors and their responses in species composition result in high environmental heterogeneity, determining the existence of a mosaic of habitats (Machado et al. 2008, Petty and Douglas 2010).
Soil physical, chemical and hydrological conditions also impose variations in species richness of a given area (Sollins 1998), acting on species selection in such a way that local richness
varies depending on the degree of influence of
environmental variables (Oliveira-Filho et al. 1994, Ivanauskas and Rodrigues 2000, Budke et al. 2007). However,our knowledge on the relationship between vegetation characteristics and soil factors is patchy, and further studies focusing on indicator species
(Jacomine 2004) will be important for a better understanding of Restinga ecosystems, since none of them have been carried out in Brazil.
Thus, we aimed to determine the relationship between vegetation variables, such as composition, abundance and species richness, and soil attributes along a forest gradient in a Restinga.
MATERIALS AND METHODS
STUDY AREA
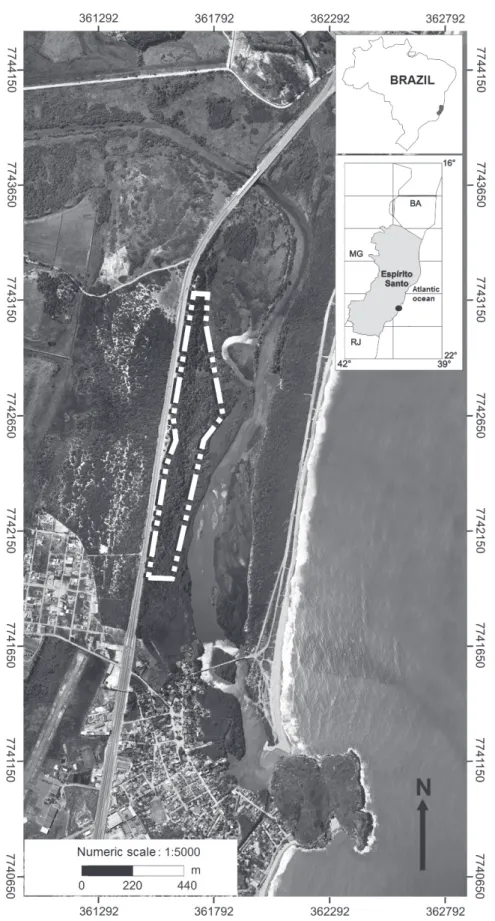
The study area is located in Barra do Jucu, Espírito Santo State, Brazil. The Jacarenema Natural Municipal Park (PNMJ) has an area of 307 hectares (IPEMA 2005), and is located near coordinates 20°26'25''S and 40°18'45''W (Figure 1). The climate
is classified as Aw tropical by Köppen, with hot,
wet summers and cold, dry winters.
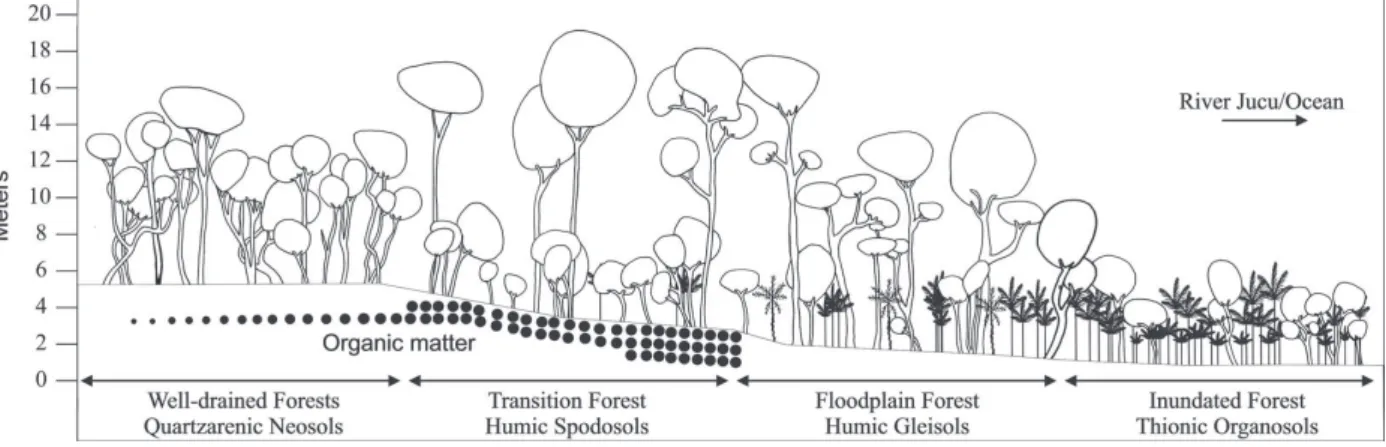
The forest sites are located on the left bank of the Jucu River, forming an environmental gradient ranging from interdune (River Jucu site) to the innermost dune facing the continent. The varying topographic condition creates different levels of
flooding, caused by seasonal floods of the Jucu
River, with an accompanying soil gradient (Table I). The terminology for classifying Restinga vegetation types (physiognomies) was based on Pereira (2003), as follows: Well-drained Forest, Transitional Forest, Floodplain Forest and Inundated Forest (Figure 2).
Vegetation type Soil classes Classes of soil drainage Fluctuation of groundwater (m)
Max Min Annual Average
INF TH Very poorly drained 0.60 -0.05 0.25
FPF MG Poorly drained 0.15 -0.30 -0.06
TRF HS Moderately drained -0.90 -1.60 -1.23
WDF QN Excessively drained -3.70 -5.00 -4.22
TABLE I
Soil classes and groundwater fluctuation in the four forests of Jacarenema Natural Municipal Park, Vila Velha, Brazil. INF=Inundated Forest; FPF=Floodplain Forest; TRF=Transitional Forest; WDF=Well-drained Forest.
TH=Thiomorphic Histosols; MG=Melanic Gleysols; HS=Humic Spodosols; QN= Quartzarenic Neossols.
VEGETATION DATA
The floristic composition of shrub and tree species
was determined in 80 plots (Mueller-Dombois and Ellenberg 1974), 5x25 m (125 m2), totaling one hectare of sample area. The plots were equally distributed in the four forest formations, i.e., 20 plots for each forest type, with a minimum spacing of 2 m apart. We aimed to represent the core areas of each forest when allocating the plots in the phytocoenoses. The plots were arranged in each physiognomy parallel to the Jucu River bank. We recorded shrub and tree species with diameter at
breast height (1.30 m) ≥ 2 cm.
The palms Bactris setosa and Bactris vulgaris have a caespitose growth habit, forming clumps. The former species occurs in wetlands in large populations (Reis 2006), rendering the separation of each individual virtually impossible. Thus, for this study each stipe was considered to be an individual.
The plant material was determined by consul-ting the CVRD Herbarium (Vale do Rio Doce), the VIES Herbarium (Universidade Federal do Espírito Santo) and the MBML Herbarium (Museu de Biologia Prof. Mello Leitão). Consultations were
also made of specific literature and material was sent
to specialists. Fertile specimens were deposited in the collection of the VIES Herbarium (Universidade Federal do Espírito Santo). The species were
classified in their respective families according to
Angiosperm Phylogeny Group II (APG II 2003).
SOIL SAMPLE
Soil samples were collected for chemical and physical analysis taking three replicates of surface soil (0-10 cm) in each sample unit, for a total of 40 samples. The samples were air-dried and sieved with a 2 mm diameter mesh. These samples were analyzed in the Soil Analysis Laboratory, Department of Soils, Universidade Federal de Viçosa. The soil and drainage classes of each physiognomy were
classified according to the Brazilian System of Soil Classification (EMBRAPA 2006).
DATA ANALYSIS
Differences in species richness and chemical and physical soil attributes between the four forests were tested by the analysis of variance (one way ANOVA). Subsequently, we used the Tukey test to determine
significant differences between areas. In addition,
we employed the Pearson linear correlation "r" to check the ratio of species increase with variations in fertility (Mg, P, k, Ca), acidity, aluminum content and soil drainage. Shapiro-Wilk (W) tested all the data distribution for normality. To test the use of variance (ANOVA), in addition to the normality test we tested the homoscedasticity of Levene.
at 95% confidence. This analysis was performed
in the EstimateS 8.0 program, employing 100 randomizations to generate curves (Colwell 2006).
To analyze correlations between the envi-ronmental gradients (soil and drainage) and vegetation we used the Canonical Correspondence Analysis (CCA) (ter Braak 1987). For this analysis, we grouped vegetation data at every two plots. We used only species that had values greater than or equal to five individuals sampled. These data were correlated with eight chemical variables of soil: pH in H20, available phosphorus (P), exchangeable Calcium (Ca), Aluminum (Al), Sodium (Na), Magnesium (Mg), Potassium (k) and Organic Matter (MO). The soil physical attributes used for the CCA were the amounts of coarse sand, fine sand, silt and clay. The species were also correlated with drainage classes for each vegetation type. The program PC-ORD for Windows version 4.14 generated analyses and the ordered CCA axes (McCune and Mefford 1999). To check the significance level of the results given by the main axis of the canonical ordering, we employed the Monte Carlo permutation (ter Braak 1988, 1994).
To verify the relationships between species and environmental variables expressed by each forest type, we used the Indicator Species Analysis (Dufrêne and Legendre 1997) and the calculations were processed by PC-ORD for Windows version 4.14 (McCune and Mefford 1999). According to Machado et al. (2008), this method combines information on the abundance of a species in a certain group of sampling units, revealing
information about the confidence of occurrence
of this species in the same habitat. The results are expressed by the observed indicator value (OIV),
in which the significance of data is given by the
permutation test of Monte Carlo. Thus, only one species is considered an indicator of habitat when it has the highest OIV, and the, Monte Carlo test is
significant at p ≤ 0.05 (Machado et al. 2008).
RESULTS
PHYSICAL ENVIRONMENT
The chemical and physical soil variables showed
significant differences among soil classes in the
four forest types (Table II). However, the major changes were observed between the Humus-alluvial Spodosols (Transition Forest) compared to Melanic Gleysols (Inundated Forest) and Thiomorphic Histosols. The Quartzarenic Neossols were very close to Spodosols in terms of physical and chemical characteristics.
Soil drainage classes varied significantly between
all formations (ANOVA, P <0.001), reinforcing
the importance of flooding in the sedimentary
envi-ronment. The pH values were lower for the formations
with greater influence of groundwater, following the
highest values of exchangeable Al in these formations. Following the same pattern, the soil drainage gradient showed increasing concentrations of organic matter, sodium, potassium, magnesium, silt and clay as the
soil becomes more subject to flooding. The variables
with the highest values in Well-drained Forests were pH and coarse sand. However, all soils studied are dystrophic, with a very low fertility status.
The soils of Floodplain Forests and Inundated Forest showed higher levels of nutrients, with higher percentages of silt and clay; they were less leached than the sandier soils of the Well-drained uplands. Organic matter in these formations also exhibited
significantly higher values when compared to the
Well-drained Forest. This condition depends on the hydromorphic environment, since soil reduction and low oxygen condition slows downs organic matter decomposition.
RICHNESS ANALYSIS
In four forest types of PNMJ, 3804 individuals were
sampled and 132 species identified. The Transition
All forest formations showed significant
diffe-rences in species richness (Tukey, p <0.01), except Well-drained Forest and Transition Forest, which
showed no significant differences (Tukey test, 95% confidence). Corroborating these results, the
rarefaction curves showed similar results reported by the Tukey test (Figure 3).
Changes in species richness among Restinga
forests had statistically significant negative
corre-lation with magnesium (r=-0.5822, p=0.0001), phosphorus (r=-0.5739, p= 0.0001), potassium (r=-0.6418, p=0.0001), calcium (r=-0.357, p=0.0001), sodium (r=-0.641, p=0.0001) and aluminum (r=-0.441, p=0.0001), while acidity
(r=-0.641, p=0.0001) had significant positive
correlation with soil drainage (r=0.654, p=0.0001).
VARIATION IN ABUNDANCE AND ANALYSIS
OF INDICATOR SPECIES
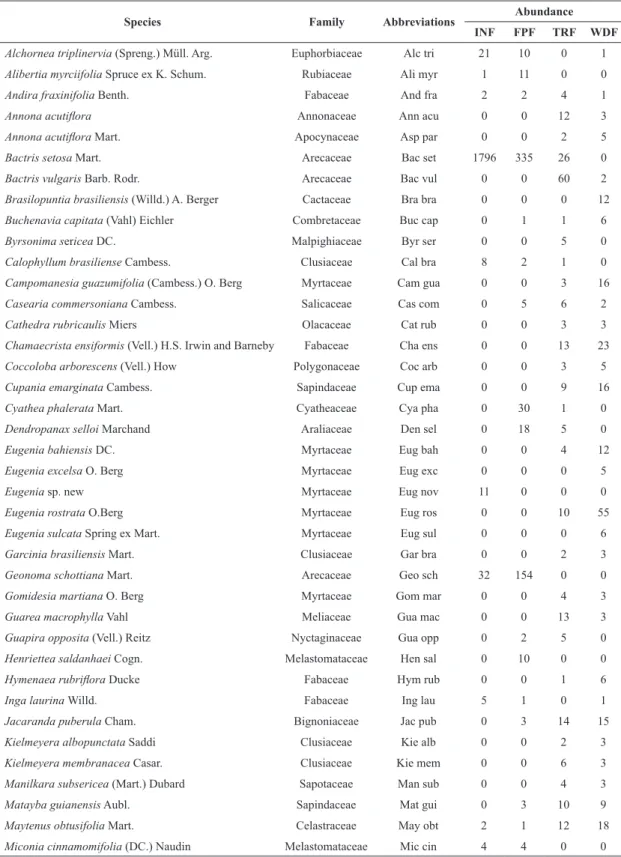
For the ordination analysis (CCA) and the analysis of indicator species, 64 species were evaluated from a total of 132 due to the inclusion criteria established in the methodology (Table III). The eigenvalues found in the ordination analysis of chemical and physical variables of soil for the three axes were 0.848, 0.326 and 0.248, for axes 1, 2 and 3, respectively (Table IV). The Pearson correlation was high for all three axes of the CCA (Table IV). Supporting this result, the Monte Carlo permutation
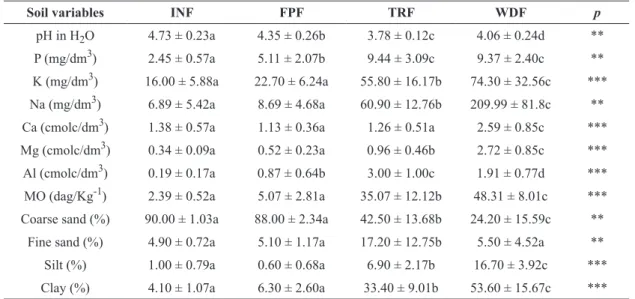
TABLE II
Chemical and physical soil variables (0-10) in four forest types analyzed in Jacarenema Natural Municipal Park, Vila Velha, Brazil. p = significance level. INF=Inundated Forest; FPF=Floodplain Forest; TRF=Transitional Forest;
WDF=Well-drainedForest. Each line shows the value of the soil variable in each forest type. Similar letters denote values that could not be differentiated by the Tukey test (p ≤0.05).
Soil variables INF FPF TRF WDF p
pH in H2O 4.73 ± 0.23a 4.35 ± 0.26b 3.78 ± 0.12c 4.06 ± 0.24d ** P (mg/dm3) 2.45 ± 0.57a 5.11 ± 2.07b 9.44 ± 3.09c 9.37 ± 2.40c ** k (mg/dm3) 16.00 ± 5.88a 22.70 ± 6.24a 55.80 ± 16.17b 74.30 ± 32.56c *** Na (mg/dm3) 6.89 ± 5.42a 8.69 ± 4.68a 60.90 ± 12.76b 209.99 ± 81.8c ** Ca (cmolc/dm3) 1.38 ± 0.57a 1.13 ± 0.36a 1.26 ± 0.51a 2.59 ± 0.85c *** Mg (cmolc/dm3) 0.34 ± 0.09a 0.52 ± 0.23a 0.96 ± 0.46b 2.72 ± 0.85c *** Al (cmolc/dm3) 0.19 ± 0.17a 0.87 ± 0.64b 3.00 ± 1.00c 1.91 ± 0.77d *** MO (dag/kg-1) 2.39 ± 0.52a 5.07 ± 2.81a 35.07 ± 12.12b 48.31 ± 8.01c *** Coarse sand (%) 90.00 ± 1.03a 88.00 ± 2.34a 42.50 ± 13.68b 24.20 ± 15.59c **
Fine sand (%) 4.90 ± 0.72a 5.10 ± 1.17a 17.20 ± 12.75b 5.50 ± 4.52a ** Silt (%) 1.00 ± 0.79a 0.60 ± 0.68a 6.90 ± 2.17b 16.70 ± 3.92c *** Clay (%) 4.10 ± 1.07a 6.30 ± 2.60a 33.40 ± 9.01b 53.60 ± 15.67c ***
**p < 0.01; ***p < 0.001.
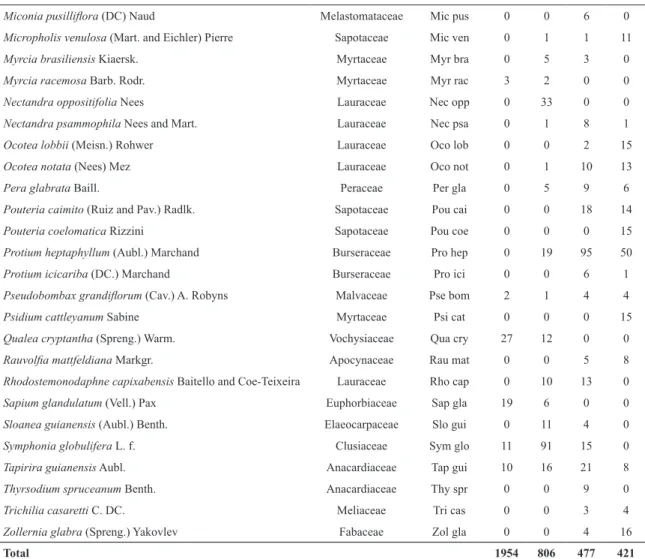
Species Family Abbreviations Abundance INF FPF TRF WDF
Alchornea triplinervia (Spreng.) Müll. Arg. Euphorbiaceae Alc tri 21 10 0 1
Alibertia myrciifolia Spruce ex k. Schum. Rubiaceae Ali myr 1 11 0 0
Andira fraxinifolia Benth. Fabaceae And fra 2 2 4 1
Annona acutiflora Annonaceae Ann acu 0 0 12 3
Annona acutiflora Mart. Apocynaceae Asp par 0 0 2 5
Bactris setosa Mart. Arecaceae Bac set 1796 335 26 0
Bactris vulgaris Barb. Rodr. Arecaceae Bac vul 0 0 60 2
Brasilopuntia brasiliensis (Willd.) A. Berger Cactaceae Bra bra 0 0 0 12
Buchenavia capitata (Vahl) Eichler Combretaceae Buc cap 0 1 1 6
Byrsonima sericea DC. Malpighiaceae Byr ser 0 0 5 0
Calophyllum brasiliense Cambess. Clusiaceae Cal bra 8 2 1 0
Campomanesia guazumifolia (Cambess.) O. Berg Myrtaceae Cam gua 0 0 3 16
Casearia commersoniana Cambess. Salicaceae Cas com 0 5 6 2
Cathedra rubricaulis Miers Olacaceae Cat rub 0 0 3 3
Chamaecrista ensiformis (Vell.) H.S. Irwin and Barneby Fabaceae Cha ens 0 0 13 23
Coccoloba arborescens (Vell.) How Polygonaceae Coc arb 0 0 3 5
Cupania emarginata Cambess. Sapindaceae Cup ema 0 0 9 16
Cyathea phalerata Mart. Cyatheaceae Cya pha 0 30 1 0
Dendropanax selloi Marchand Araliaceae Den sel 0 18 5 0
Eugenia bahiensis DC. Myrtaceae Eug bah 0 0 4 12
Eugenia excelsa O. Berg Myrtaceae Eug exc 0 0 0 5
Eugenia sp. new Myrtaceae Eug nov 11 0 0 0
Eugenia rostrata O.Berg Myrtaceae Eug ros 0 0 10 55
Eugenia sulcata Spring ex Mart. Myrtaceae Eug sul 0 0 0 6
Garcinia brasiliensis Mart. Clusiaceae Gar bra 0 0 2 3
Geonoma schottiana Mart. Arecaceae Geo sch 32 154 0 0
Gomidesia martiana O. Berg Myrtaceae Gom mar 0 0 4 3
Guarea macrophylla Vahl Meliaceae Gua mac 0 0 13 3
Guapira opposita (Vell.) Reitz Nyctaginaceae Gua opp 0 2 5 0
Henriettea saldanhaei Cogn. Melastomataceae Hen sal 0 10 0 0
Hymenaea rubriflora Ducke Fabaceae Hym rub 0 0 1 6
Inga laurina Willd. Fabaceae Ing lau 5 1 0 1
Jacaranda puberula Cham. Bignoniaceae Jac pub 0 3 14 15
Kielmeyera albopunctata Saddi Clusiaceae kie alb 0 0 2 3
Kielmeyera membranacea Casar. Clusiaceae kie mem 0 0 6 3
Manilkara subsericea (Mart.) Dubard Sapotaceae Man sub 0 0 4 3
Matayba guianensis Aubl. Sapindaceae Mat gui 0 3 10 9
Maytenus obtusifolia Mart. Celastraceae May obt 2 1 12 18
Miconia cinnamomifolia (DC.) Naudin Melastomataceae Mic cin 4 4 0 0 TABLE III
Woody species used in Canonical Correspondence Analysis (CCA) and their abbreviations, for the four forests types studied in Jacarenema Natural Municipal Park, Vila Velha, Brazil. INF=Inundated Forest;
test indicated that the abundance of species varied
significantly depending on the environmental
variables. The eigenvalue higher than 0.5 in the
first axis for the CCA is considered high (ter Braak
1995), indicating the existence of a long gradient with high species turnover in the direction of the
gradient of soil and flooding.
The soil chemical variables with higher
corre-lation on the first axis were organic matter,
phosphorus, acidity, sodium, magnesium, potassium and aluminum (Table IV). The soil physical variables with the highest correlation were drainage, sand, clay and silt. Fine sand showed low correlation
values, but it has influenced the separation of species
and plots in the Humic Gleisols.
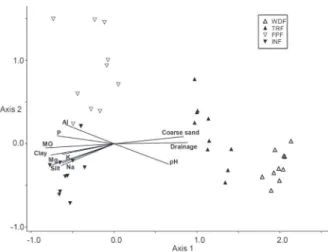
The proposed ordinances with chemical and physical data clearly separated plots according to their respective soils (Figure 4). Quartzarenic Neosols concentrated in the upper left quadrant, whereas Humic Spodosols were concentrated in the lower quadrant. Humic Gleisols are concentrated in the lower quadrants both to the left and right. Thionic Organosols are concentrated in the right upper quadrant, associated with Humic Gleisols.
These results show the existence of a gradient from right to left in the representation of the CCA, i.e., following Thionic Organosols from topographically lower areas (interdune), with higher organic matter content, exchangeable magnesium, sodium and potassium. Humic Gleisols are also in the interdune, Miconia pusilliflora (DC) Naud Melastomataceae Mic pus 0 0 6 0
Micropholis venulosa (Mart. and Eichler) Pierre Sapotaceae Mic ven 0 1 1 11
Myrcia brasiliensis kiaersk. Myrtaceae Myr bra 0 5 3 0
Myrcia racemosa Barb. Rodr. Myrtaceae Myr rac 3 2 0 0
Nectandra oppositifolia Nees Lauraceae Nec opp 0 33 0 0
Nectandra psammophila Nees and Mart. Lauraceae Nec psa 0 1 8 1
Ocotea lobbii (Meisn.) Rohwer Lauraceae Oco lob 0 0 2 15
Ocotea notata (Nees) Mez Lauraceae Oco not 0 1 10 13
Pera glabrata Baill. Peraceae Per gla 0 5 9 6
Pouteria caimito (Ruiz and Pav.) Radlk. Sapotaceae Pou cai 0 0 18 14
Pouteria coelomatica Rizzini Sapotaceae Pou coe 0 0 0 15
Protium heptaphyllum (Aubl.) Marchand Burseraceae Pro hep 0 19 95 50
Protium icicariba (DC.) Marchand Burseraceae Pro ici 0 0 6 1 Pseudobombax grandiflorum (Cav.) A. Robyns Malvaceae Pse bom 2 1 4 4
Psidium cattleyanum Sabine Myrtaceae Psi cat 0 0 0 15
Qualea cryptantha (Spreng.) Warm. Vochysiaceae Qua cry 27 12 0 0 Rauvolfia mattfeldiana Markgr. Apocynaceae Rau mat 0 0 5 8
Rhodostemonodaphne capixabensis Baitello and Coe-Teixeira Lauraceae Rho cap 0 10 13 0
Sapium glandulatum (Vell.) Pax Euphorbiaceae Sap gla 19 6 0 0
Sloanea guianensis (Aubl.) Benth. Elaeocarpaceae Slo gui 0 11 4 0
Symphonia globulifera L. f. Clusiaceae Sym glo 11 91 15 0
Tapirira guianensis Aubl. Anacardiaceae Tap gui 10 16 21 8
Thyrsodium spruceanum Benth. Anacardiaceae Thy spr 0 0 9 0
Trichilia casaretti C. DC. Meliaceae Tri cas 0 0 3 4
Zollernia glabra (Spreng.) Yakovlev Fabaceae zol gla 0 0 4 16
Total 1954 806 477 421
but are located at a topographically higher position compared to the former, so it is relatively less subject
to flooding. It showed higher concentrations of
phosphorus and aluminum. According to the gradient proposed by the ordination, the Humic Spodosols follow, situated at the dune border, with moderate drainage, intermediate concentration of nutrients and increasing coarse sand content. Quartzarenic Neossols are located on the upper dune with well-drained soils, moderately acid and lowest fertility status.
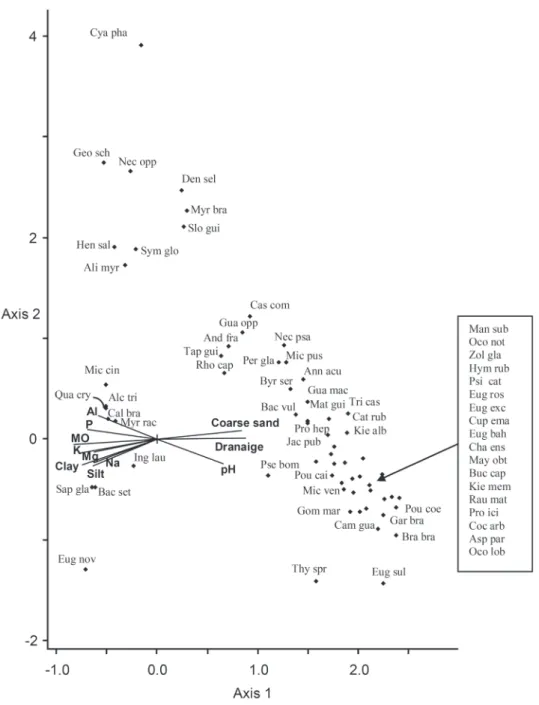
The results obtained with the CCA ordination suggest that the abundance of species is related to variations in physical and chemical attributes of soils (Figure 5). The test of indicator species using the 64 species analyzed in the CCA revealed that 42 species
had a significant indicator value for some of the four
types of forest soil studied (Table V). These results consistently demonstrate that edaphic factors control the distribution of species in coastal Restinga forests.
Plants associated with poorly drained soils, with higher percentages of silt and clay, salts and organic matter (Thionic Organosols) are Bactris setosa, Qualea cryptantha, Alchornea triplinervia, Calophyllum brasiliense, Sapium glandulatum, Myrcia racemosa, Inga laurina and Eugenia sp.
This last species was identified as a new species (e.g.
M.E.G. Sobral, unpublished data). In our area this species is restricted to the Inundated Forest, showing
high abundance values and classified as an indicator
species in this environment at Jacarenema Restinga. On poorly drained, extremely acidic soil, with
higher percentages of fine sand and with higher
concentrations of phosphorus and aluminum (Humic Gleisols), typical species are Geonoma schottiana, Nectandra oppositifolia, Symphonia globulifera, Alibertia myrciifolia, Cyathea phalerata, Henriettea saldanhaei, Sloanea guianensis Dendropanax selloi and Myrcia brasiliensis.
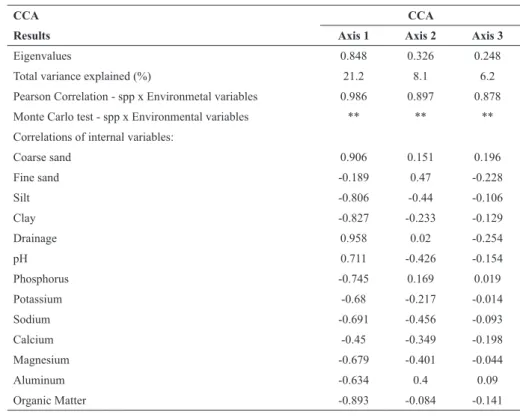
TABLE IV
Results of the Canonical Correspondence Analysis (CCA) with 64 species in Jacarenema Natural Municipal Park, Vila Velha, Brazil.
CCA CCA
Results Axis 1 Axis 2 Axis 3
Eigenvalues 0.848 0.326 0.248
Total variance explained (%) 21.2 8.1 6.2
Pearson Correlation - spp x Environmetal variables 0.986 0.897 0.878
Monte Carlo test - spp x Environmental variables ** ** **
Correlations of internal variables:
Coarse sand 0.906 0.151 0.196
Fine sand -0.189 0.47 -0.228
Silt -0.806 -0.44 -0.106
Clay -0.827 -0.233 -0.129
Drainage 0.958 0.02 -0.254
pH 0.711 -0.426 -0.154
Phosphorus -0.745 0.169 0.019
Potassium -0.68 -0.217 -0.014
Sodium -0.691 -0.456 -0.093
Calcium -0.45 -0.349 -0.198
Magnesium -0.679 -0.401 -0.044
Aluminum -0.634 0.4 0.09
Organic Matter -0.893 -0.084 -0.141
On the sandy border with intermediate characteristics of soil fertility and drainage (Humic Spodosols), typical plants are Protium heptaphyllum, Bactris vulgaris, Pouteria caimito, Guarea macrophylla, Miconia pusilliflora, Byrsonima sericea, Annona acutiflora, Jacaranda puberula, Protium icicariba, Rhodostemonodaphne capixabensis, Nectandra psammophila and Guapira opposita, amongst others.
On the highest dune segment with excessively drained soils, lower soil acidity, lower fertility and higher percentages of sand (Quartzarenic Neossols), the most abundant species were Eugenia rostrata, Ocotea lobbii, Campomanesia guazumifolia, Pouteria coelomatica, Psidium cattleyanum, Zollernia glabra, Chamaecrista ensiformis and Ocotea notata, amongst others.
DISCUSSION
The overall soil chemical fertility increased from topographically higher areas to the bottom of the landscape, having a positive relationship with
increased soil flooding. Thus, this distribution is
a typical pedological catena, or soil toposequence (Resende et al.1988, Sobieraj et al. 2002).
Variations in physical and chemical charac-teristics of surface soils are related to the sedimentary nature associated with different drainage conditions, considering that the most marked changes were
related to different levels of flooding to which each
forest environment is submitted (Jacomine 2004, EMBRAPA 2006). This condition can be further enhanced by some variation in chemical and physical properties of the soil between the two upland forests since both have the water table far from the surface, so that there is little contribution of groundwater to soil-surface characteristics. However, the levels of phosphorus, aluminum, pH and groundwater height
were significantly different between these formations.
It is noteworthy that all forest tracts analyzed are closely related to distinct soils, and therefore
significant differences in chemical, physical and
morphological properties can be expected. Such differences are only revealed when soils are analyzed in greater depths (Magnago et al. 2010).
The great pedological heterogeneity observed between plots allocated on Thionic Organosols and Humic Gleisols probably occurred due to
micro-topographic variation of the floodplain, causing a patchy distribution of plants and flooding in the
same area. Micro-topographic variation has been
reported in other studies of floodplain forests in the
Tropics (Ivanauskas et al. 1997, Toniato et al. 1998, Ivanauskas and Rodrigues 2000), and this is typical
of the sedimentary floodplains.
The ecotonal character assigned to the Transition Forest is due to the occurrence of species
found in flooded areas and in well-drained soils. This transitional floristic composition is matched
by intermediate soil characteristics, both in terms of nutrient and groundwater level.
Although species richness in Transition Forest
did not show values significantly different from
the Well-drained Forest, the absolute result (82 species) agrees with Ashton (1990) and Tilman (1986), who reported that environments with intermediate nutrient availability have greater
Figure 5 - Canonical Correspondence Analysis of species with the chemical soil features (CCA). Species names are listed in Table IV. pH=acidity in water, Na=sodium, Mg=Magnesium, k=Potassium, P=Phosphorus; Al=Aluminum; MO=Organic matter.
species richness values than those at the extremes of nutrient availability. In our case, differences in soil
characteristics and flooding may be not so great as to
provide extreme variability in the species richness. Waterlogging has been considered a determining factor in selecting plant species (Ivanauskas and Rodrigues 2000, Budke et al.
2007), which was confirmed by several studies
TABLE V
Results of the indicator species analysis in four forests studied based on soil variables and cover value of 64 species in Jacarenema Natural Municipal Park, Vila Velha, Brazil. OIV=Observed indicator value; VIE=expected value indicator; s=standard deviation,
p=significance level; INF=Inundated Forest; FPF=Floodplain Forest; TRF=Transitional Forest; WDF=Well-drained Forest.
Species OIV VIE Abundance (%)
Average s p INF FPF TRF WDF
Thiomorphic Histosols – INF
Bactris setosa 83.3 22.1 4.16 *** 83 16 1 0
Qualea cryptantha 45 12.6 4.22 *** 69 31 0 0
Alchornea triplinervia 39.4 12.7 3.95 *** 66 31 0 3
Eugenia sp nov, 35 7.5 3.54 *** 100 0 0 0
Sapium glandulatum 30.4 9.7 4.16 ** 76 24 0 0
Calophyllum brasiliense 25.5 8.6 3.52 ** 73 18 9 0
Inga laurina 17.9 7.4 3.59 * 71 14 0 14
Melanic Gleysols - FPF
Geonoma schottiana 74.5 15.4 4.86 *** 17 83 0 0
Nectandra oppositifolia 65 10.4 4.11 *** 0 100 0 0
Symphonia globulifera 62.2 15.5 4.68 *** 9 78 13 0
Alibertia myrciifolia 36.7 8.6 3.76 *** 8 92 0 0
Cyathea phalerata 29 8.6 4.3 ** 0 97 3 0
Henriettea saldanhaei 20 6.7 3.76 ** 0 100 0 0
Humic Spodosols – TRF
Protium heptaphyllum 52.1 21.2 4.36 *** 0 12 58 30
Bactris vulgaris 48.4 10.3 4.25 *** 0 0 97 3
Pouteria caimito 30.9 13.3 3.98 ** 0 0 56 44
Guarea macrophylla 28.4 9.1 3.88 ** 0 0 81 19
Miconia pusilliflora 25 6.5 3.37 ** 0 0 100 0
Byrsonima sericea 25 6.3 3.46 ** 0 0 100 0
Annona acutiflora 24 8.5 3.65 ** 0 0 80 20
Jacaranda puberula 21.9 12.9 4.23 * 0 9 44 47
Protium icicariba 21.4 7.1 3.53 ** 0 0 86 14
Rhodostemonodaphne capixabensis 19.8 9.7 4.17 * 0 43 57 0
Nectandra psammophila 16 7 3.49 * 0 10 80 10
Quartzarenic Neossols - WDF
Eugenia rostrata 67.7 13.1 3.99 *** 0 0 15 85
Ocotea lobbii 48.5 10.3 3.87 *** 0 0 12 88
Campomanesia guazumifolia 46.3 10.5 3.83 *** 0 0 16 84
Pouteria coelomatica 45 8.8 3.79 *** 0 0 0 100
Psidium cattleyanum 45 8.5 3.58 *** 0 0 0 100
Zollernia glabra 44 10.9 3.72 *** 0 0 20 80
Chamaecrista ensiformis 31.9 13.7 4.78 ** 0 0 36 64
Ocotea notate 29.8 11.6 3.98 ** 0 4 42 54
Rauvolfia mattfeldiana 24.6 9.8 3.74 ** 0 0 38 62
Cupania emarginata 22.4 11.1 4.27 * 0 0 36 64
Eugenia excelsa 20 6.1 3.32 ** 0 0 0 100
important limiting factors for the establishment of plant species (Lathwell and Grove 1986, Sollins 1998, Grime 2001).
Exchangeable sodium is commonly high in
flooded environments near to the beaches which
also, according with (Larcher 2000), turns out to be limiting to plant species. Considering the above mentioned points, the variation in species richness
and floristic heterogeneity found among the forests studied here significantly imposes selectivity by the
most limiting characteristics in the wetlands when
compared to non-flooded forest areas.
The highest levels of organic matter in poorly drained areas also suggest a prominent role in plant distribution in this environment. Even mounds and small vegetation islands on piles of plant debris appear to be favorable microenvironments for the development of certain species over others, in such a way that the organic matter has been correlated with the distribution of vegetation types and abundance of species in different coastal environments subject
to flooding (Budke et al. 2007, Munhoz et al. 2008).
In spite of higher organic matter content and
higher fertility, environmental conditions in flooded
areas are very limiting to the establishment of species
in this forest floodplain, in function of the low oxygen
availability combined with higher salt concentration. The negative correlation between richness and soil fertility and positive correlation between richness and drainage suggest that since the Floodplain
Forests have flooded soils with higher fertility,
flood-tolerant species would be more competitive, resulting in higher abundance of species, with ecological
dominance and lower richness. This condition is similar to one found in monodominant forests of Vochysia divergens in the Pantanal wetlands of Brazil, where values for this species greatly
increase with flooding, accompanied by a decrease
in species richness (Arieira and Cunha 2006). In this regard, Nascimento and Villela (2006) reported an increased dominance of Peltogyne gracilipes related to increasing magnesium in the soil, thus excluding other species through competition. According to Scarano (2002), this high dominance of a few species can be considered typical of extreme environments.
In floodplain forests, the species Bactris setosa, Alchornea triplinervia, Calophyllum brasiliense, Sapium glandulatum, Geonoma schottiana, Symphonia globulifera, Nectandra oppositifolia and Myrcia brasiliensis are generally the most common (Araujo et al. 1998, 2004, Sztutman and Rodrigues 2002, Dorneles and Waechter 2004, Menezes-Silva and Britez 2005, Menezes and Araujo 2005, Guedes et al. 2006, Carvalho et al. 2006, Martins et al. 2008). Less frequent, but also present in studies
of floodplain forests are Sloanea guianensis, Alibertia myrciifolia, Qualea cryptantha, Myrcia racemosa and Cyathea phalerata (Behar and Viégas 1992, Galvão et al. 2002, Goldenberg 2004, Guedes et al. 2006, Sacramento et al. 2007, Martins et al. 2008).
The species present in the Well-drained and Transition Forests are mentioned as being common in similar environments in studies elsewhere (Assis et al. 2004, Fabris and César 1996, Araujo et al. 1998, 2004, Menezes and Araujo 2005, Assumpção and Nascimento 2000, Pereira and Assis 2000,
Eugenia bahiensis 18.7 8.8 4.4 * 0 0 25 75
Buchenavia capitata 18.7 7.5 3.47 * 0 12 12 75
Aspidosperma parvifolium 17.9 7.2 3.25 ** 0 0 29 71
Hymenaea rubriflora 17.1 6.5 3.2 * 0 0 14 86
Micropholis venulosa 16.9 7.4 3.69 * 0 8 8 85
Brasilopuntia brasiliensis 15 5.3 3.07 * 0 0 0 100
TABLE V (continuation)
Menezes-Silva and Britez 2005). Some species that occurred in Transition Forest such as Calophyllum brasiliense, Alchornea triplinervia, Nectandra oppositifolia and Guarea macrophylla are among
the most common in floristic and phytosociological
studies of the Brazilian Riparian forests outside Amazonia (Rodrigues and Nave 2004).
The distribution of the species in the CCA and Indicator Species analyses are consistent with that in the literature. Thus, we infer that these species are indicators of soil conditions (soil types and groundwater level) imposed at each community analyzed, showing greatest abundance where environmental conditions are more favorable for their establishment and development.
The results for the Restinga forests of Jacare-nema corroborate those proposed for Riparian forests, which are marked by high plant-species richness (Rodrigues and Nave 2004), accompanied by a
signi-ficant gradient of soil and drainage (Jacomine 2004). We found that changes in the floristic
compo-sition, richness and species abundance that make up the different forest types form, together with soil and drainage variation, form a complex and heterogeneous enviroment that is characteristic of
tropical floodplain/riverine forests.
Thus, we can infer that in the Restinga forests the amounts of aluminum, sodium, and
organic matter, as well as soil acidity and flooding
regime are the most important determining factors controlling plant richness. Flooding seems to be a more limiting factor for the establishment of plant species than soil fertility attributes.
ACKNOWLEDGMENTS
We are grateful to Coordenação de Aperfeiçoamento de Pessoal de Nível Superior (CAPES) for granting
the scholarship to the first author; to Mariana
F. Rocha, Fabio A. Matos, Guilherme Resende, Herivelton Borges, Vinicius Cordeiro (Vico), Geanna Correia, Marcelo Belisário and André Assis, among
others, for great assistance in field activities, to the
prefecture of Vila Velha for the authorization of this study in the area of Jacarenema Natural Municipal Park, and to Dorothy Sue Dunn de Araujo for reviewing this manuscript. This manuscript is part of
the Master’s degree dissertation of the first author.
RESUMO
O objetivo deste estudo foi o de determinar as mudanças na composição, abundância e riqueza de espécies ao
longo de um gradiente de floresta com variações de solo e inundações. As florestas localizam-se na margem
esquerda do Rio Jucu, no Parque Natural Municipal de Jacarenema, Espírito Santo. O levantamento das espécies arbustivo/arbóreas foi realizado em 80 parcelas de 5x25m,
distribuídas equitativamente entre as florestas estudadas.
Foram incluídos na amostragem todos os indivíduos com
≥3,2 cm diâmetro à altura do solo (1,30 m). Foram coletadas amostras de solo superficial (0-10 cm) em cada parcela
para análise química e física. Os resultados mostraram a
existência de gradiente pedológico significativo, que é influenciado pelas variações sazonais do lençol freático. As formações florestais da Restinga apresentaram diferenças significativas na riqueza de espécies, com
exceção da Floresta Não Inundável em relação a Floresta Não Inundável de Transição. A Análise de Correlação
Canônica (CCA) mostrou que algumas espécies
apresentam sua distribuição ao longo do gradiente sob
influência da drenagem, das concentrações de nutrientes
e das características físicas dos solos. Entre as variáveis testadas, a inundação parece ser o fator mais limitante para
o estabelecimento de espécies vegetais nas florestas de
Restinga do que os atributos básicos de fertilidade do solo.
Palavras-chave: Vegetação, Florestas inundadas, Ecossistema costeiro, Solos arenosos, Depósitos
quaternários, Influência Marinha, Florestas Ciliares.
REFERENCES
ARAUJO DSD, PEREIRA MCA AND PIMENTEL MC. 2004. Flora e estrutura de comunidades no Parque Nacional da Restinga de Jurubatiba - Síntese dos conhecimentos com enfoque especial para a formação aberta de Clusia. In: ROCHA CFD AND SCARANO FR (Orgs), Ecologia, História Natural e Conservação do Parque Nacional da Restinga de Jurubatiba. RiMa, São Carlos, São Paulo, p. 59-76.
ARAUJO DSD, SCARANO FR, SÁ CF, kURTz BC, zALUAR HLT, MONTEzUMA RCM AND OLIVEIRA RC. 1998. Comuni-dades Vegetais do Parque Nacional da Restinga de Jurubatiba. In: ESTEVES FA (Ed), Ecologia das Lagoas Costeiras do Parque Nacional da Restinga de Jurubatiba e do Município de Macaé, RJ. Universidade Federal do Rio de Janeiro, Rio de Janeiro, p. 39-62.
ARIEIRA J AND CUNHA CN. 2006. Fitossociologia de uma floresta inundável monodominante de Vochysia divergens
Pohl (Vochysiaceae), no Pantanal Norte, MT, Brasil. Acta Bot Bras 20(3): 569-580.
ASHTON PS. 1990. Species richness in tropical forests. In: HOLM-NIELSEN LB, NIELSEN IC AND BALSLEV H (Eds), Tropical forests - botanical dynamics, speciation and diversity. Academic Press, London, p. 239-251. ASSIS AM, THOMAz LD AND PEREIRA OJ. 2004. Florística de
um trecho de floresta de Restinga no município de Guarapari, Espírito Santo, Brasil. Acta Bot Bras 18(1): 191-201. ASSUMPçÃO J AND NASCIMENTO MT. 2000. Estrutura e
composição florística de quatro formações vegetais de Restinga no complexo lagunar Grussaí/Iquipari, São João da Barra, RJ, Brasil. Acta Bot Bras 14(3): 301-315. BEHAR L AND VIéGAS GMF. 1992. Pteridophyta da Restinga
do Parque Estadual de Setiba, Espírito Santo. Bol Mus Biol Mello Leitão 1: 39-59.
BUDkE JC AND JARENkOW JA, OLIVEIRA-FILHO AT. 2007. Relationships between tree component structure, topo-graphy and soils of a riverside forest, Rio Botucaraí, Southern Brazil. Plant Ecol 189: 187-200.
CARVALHO FA, NASCIMENTO MT, BRAGA JMA AND RODRIGUES PJFP. 2006. Estrutura da Comunidade Arbórea da Floresta Atlântica de Baixada Periodicamente Inundada na Reserva Biológica de Poço das Antas, Rio de Janeiro, Brasil. Rodriguésia 57(3): 503-518.
CLARk DB, PALMER MW AND CLARk DA. 1999. Edaphic factors and the landscape-scale distributions of tropical rain forest trees. Ecology 80(8): 2662–2675.
COLWELL Rk. 2006.Estimates: Statistical estimation of species richness and shared species from samples. Version 8.0. User's Guide and application published at: http://purl.oclc. org/estimates.
COLWELL Rk AND CODDINGTON JA. 1994. Estimating terrestrial biodiversity through extrapolation. Philosl T Roy Soc B 345: 101-118.
COUTINHO LM. 2006. O conceito de bioma. Acta Bot Bras 20(1): 13-23.
DORNELES LPP AND WAECHTER JL. 2004. Fitossociologia do componente arbóreo na floresta turfosa do Parque Nacional da Lagoa do Peixe, Rio Grande do Sul, Brasil. Acta Bot Bras 17(4): 815-824.
DUFRêNE M AND LEGENDRE P. 1997. Species assemblages and indicator species: the need for a flexible asymmetrical approach. Ecol Monogr 67: 345-366.
EMBRAPA. 2006. Sistema brasileiro de classificação de solos. (2nd edition). EMBRAPA Solos, Rio de Janeiro.
FABRIS LC AND CéSAR O. 1996. Estudos florísticos em uma mata litorânea no sul do estado do Espírito Santo. Bol Mus Biol Mello Leitão 5: 15-46.
FERREIRA-JUNIOR WG, SILVA AF, SCHAEFER CEGR, MEIRA NETO JAA, DIAS AS, IGNÁCIO M AND MEDEIROS MCMP. 2007. Influence of soils and topographic gradients on tree species distribution in a Brazilian Atlantic Tropical Semideciduous Forest. Edinb J Bot 64(2): 137-157. GALVÃO F, RODERJAN CV, kUNIYOSHI YS AND zILLER SR. 2002.
Composição florística e fitossociologia de caxetais do litoral do Estado do Paraná - Brasil. Floresta 32(1): 19-42. GOLDENBERG R. 2004. O gênero Miconia (Melastomataceae) no Estado do Paraná, Brasil. Acta Bot Bras 18(4): 927-947. GRIME JP. 2001. Plant strategies, vegetation processes, and ecosystem properties. (2nd edition). Wiley, Chichester, Uk. GUEDES D, BARBOSA LM AND MARTINS SE. 2006. Composição
florística e estrutura fitossociológica de dois fragmentos de floresta de Restinga no Município de Bertioga, SP, Brasil. Acta Bot Bras 20(2): 299-311.
IPEMA - INSTITUTO DE PESQUISAS DA MATA ATLâNTICA. 2005. Conservação da Mata Atlântica no Estado do Espírito Santo: cobertura florestal e unidades de conservação. IPEMA, Vitória, Espírito Santo.
IVANAUSkAS NM AND RODRIGUES RR. 2000. Florística e fitos-sociologia de remanescentes de floresta estacional decidual em Piracicaba, São Paulo, Brasil. Rev Bras Bot 23(3): 291-304. IVANAUSkAS NM, RODRIGUES RR AND NAVE AG. 1997. Aspectos ecológicos de um trecho de Floresta de brejo em Itatinga, SP: florística, fitossociologia e seletividade de espécies. Rev Bras Bot 20(2): 139-153.
JACOMINE PkT. 2004. Solos sob matas ciliares. In: RODRIGUES RR AND LEITÃO-FILHO HF (Eds), Matas ciliares: conser-vação e recuperação. EDUSP/FAPESP, São Paulo, p. 27-32. LARCHER W. 2000. Ecofisiologia Vegetal. São Carlos: Rima
Artes e Textos, 531 p.
LATHWELL DJ AND GROVE TL. 1986. Soil-Plant Relationships in the Tropics. Ann Rev Ecol Syst 17: 1-16.
MACHADO ELM, OLIVEIRA-FILHO AT, VAN DEN BERG E, CARVALHO WAC, SOUzA JS, MARQUES JJGSM AND CALEGÁRIO N. 2008. Efeitos do substrato, bordas e proximidade espacial na estrutura da comunidade arbórea de um fragmento florestal em Lavras, MG. Rev Bras Bot 31(2): 287-302.
MAGNAGO LFS, MARTINS SV, SCHAEFER CEGR AND NERI AV. 2010. Gradiente fitofisionômico-edáfico em formações florestais de Restinga no Sudeste do Brasil. Acta Bot Bras 24(4): 653-665.
MAGURRAN AE. 2004. Measuring biological diversity. Blackwell Science, Ltd. USA, Oxford.
MARTINS SE, ROSSI L, SAMPAIO PSP AND MAGENTA MAG. 2008. Caracterização florística de comunidades vegetais de Restinga em Bertioga, SP, Brasil. Acta Bot Bras 22(1): 249-274.
MCCUNE B AND MEFFORD MJ. 1999. Multivariate analysis of ecological data. MjM Software, Gleneden Beach. MENEzES LFT AND ARAUJO DSD 2005. Formações
vegetacionais da Restinga da Marambaia, Rio de Janeiro. In: MENEzES LFT, PEIXOTO AL AND ARAUJO DSD (Orgs), História natural da Marambaia. EDUR, Rio de Janeiro, p. 67-120.
MENEzES-SILVA SM AND BRITEz RM. 2005. A Vegetação da Planície Costeira. In: MARQUES MCM AND BRITEz RM (Orgs), História Natural e Conservação da Ilha do Mel. Editora UFPR, Curitiba, p. 49-84.
MUELLER-DOMBOIS D AND ELLENBERG H. 1974. Aims and methods of vegetation ecology. J Wiley & Sons, New York, 547 p.
MUNHOz CBR, FELFILI JM AND RODRIGUES C. 2008. Species-environment relationship in the herb-subshrub layer of a moist Savanna site, Federal District, Brazil. Braz J Biol 68(1): 25-35.
NASCIMENTO MT AND VILLELA DM. 2006. Diversidade arbórea em florestas tropicais úmidas e o paradigma da mono-dominância. In: MARIATH JEA AND SANTOS RP (Orgs), Os avanços da botânica no início do século XXI: morfologia, fisiologia, taxonomia, ecologia e genética: conferências plenárias e simpósios do 57º Congresso de Botânica. Soc Bras Bot, Porto Alegre, p. 373-377.
OLIVEIRA-FILHO AT, VILELA EA, CARVALHO DA AND GAVILANES ML. 1994. Effects of soils and topography on the distribution of tree species in a tropical riverine Forest in south-eastern Brazil. J Trop Ecol 10: 483-508.
PEREIRA OJ. 2003. Restinga: origem, estrutura e diversidade. In: JARDIM MG, BASTOS MNC AND SANTOS JUM (Orgs), Desafios da Botânica Brasileira no Novo Milênio: inventário, sistematização e conservação da biodiversidade vegetal. Soc Bras Bot, Belém, Pará, p. 177-179.
PEREIRA OJ AND ASSIS AM. 2000. Florística da Restinga de Camburi. Acta Bot Bras 14(1): 99-111.
PETTY AM AND DOUGLAS MM. 2010. Scale relationships and linkages between woody vegetation communities along a large tropical floodplain river, north Australia. J Trop Ecol 26:79-92.
REIS RCC. 2006. Palmeiras (Arecaceae) das Restingas do Estado do Rio de Janeiro, Brasil. Acta Bot Bras 20(3): 501-512. RESENDE M, CURI N AND SANTANA DP. 1988. Pedologia e
fertilidade do solo: interações e interpretações. Ministério da Agricultura, Brasília, e Universidade Federal de Lavras, Lavras, 81 p.
RODRIGUES RR AND NAVE AA. 2004. Heterogeneidade florís-tica das Matas Ciliares. In: RODRIGUES RR AND LEITÃO-FILHO HF (Eds), Matas ciliares: conservação e recuperação. (2a edição). EDUSP/FAPESP, São Paulo, p. 45-71.
ROMAGNOLO MB AND SOUzA MC. 2000. Análise florística e estrutural de florestas ripárias do Alto Rio Paraná, Taquaruçu, MS. Acta Bot Bras 14(2): 163-174.
SACRAMENTO AC, zICkEL CS AND ALMEIDA-JUNIOR EB. 2007. Aspectos florísticos da vegetação de Restinga no litoral de Pernambuco. Rev Árvore 31(6): 1121-1130.
SCARANO FR. 2002. Structure, Function and Floristic Rela-tionships of Plant Communities in Stressful Habitats Marginal to the Brazilian Atlantic Rainforest. Ann Bot-London 90: 517-524.
SOBIERAJ JA, ELSENBEER H AND COELHO RM AND NEWTON B. 2002. Spatial variability of soil hydraulic conductivity along a tropical rainforest catena. Geoderma 118(1-2): 79-90. SOLLINS P. 1998. Factors influencing species composition in tropical lowland rain forest: does soil matter? Ecology 79(1): 23-30.
SUGIYAMA M AND MANTOVANI W. 1994. Fitossociologia de um trecho de mata de Restinga na Ilha do Cardoso, SP. In: Anais do III Simpósio de Ecossistemas da Costa Brasileira - subsídios a um gerenciamento costeiro. (2o volume). ACIESP, São Paulo, p. 49-57.
SUGUIO k AND TESSLER M G. 1984. Planícies de cordões arenosos Quaternários do Brasil: origem e nomenclatura. In: LACERDA LD, ARAUJO DSD AND CERQUEIRA R (Orgs), Restingas: origem, estruturas e processos. CEUFF, Universidade Federal Fluminense, Niterói, p. 15-26. SzTUTMAN M AND RODRIGUES RR. 2002. O mosaico
vegetacional numa área de floresta contínua da planície litorânea, Parque Estadual da Campina do Encantado, Pariquera - Açu, SP. Rev Bras Bot 25(2): 61-176.
TER BRAAk CJF. 1987. The analysis of vegetation-environment relationship by Canonical Correspondence Analysis. Vegetatio 69: 69-77.
TER BRAAk CJF. 1988. CANOCO – A FORTRAN program for canonical community ordination by (Partial) (Detrended) (Canonical) Correspondence Analysis and redundancy analysis, version 2.1 Technical report LWA-88-2, TNO. Institute of Applied Computer Science, Wageningen. TER BRAAk CJF. 1994. Canonical Community Ordination. Part
I: basic theory end linear methods. écoscience 1(2): 127-140. TER BRAAk CJF. 1995. Ordination. In: JONGMAN RHG, TER BRAAk CJF AND VAN TONGEREN OFR (Eds), Data analysis in community and landscape ecology. University Press Cambridge, Cambridge, p. 91-173.
TER BRAAk CJF AND PRENTICE C. 1988. A theory of gradient analysis. Advance in ecological research: classic papers 18: 271-317.
TILMAN D. 1986. Evolution and differentiation in terrestrial plant communities: the importance of the soil resource: light gradient. In: DIAMOND J AND CASE TJ (Eds), Community ecology. Harper and Row, New York, p. 359-380.