BJRS
06-03 (2018) 01-17Dosimetry and optimization in digital radiography based on
the contrast-detail resolution
Batista
aW.O.G., Carvalho
bA.G.
a Instituto Federal da Bahia, Campus Salvador, Salvador – Bahia – Brasil. bSecretaria de Saúde da Bahia, Salvador-Bahia – Brasil.
ABSTRACT
Contrast-detail (C-D) curves are useful in evaluating the radiographic image quality in a global way. The objective of the present study was to obtain the C-D curves and the inverse image quality figure. Both of these parameters were used as an evaluation tool for abdominal and chest imaging protocols in clinical conditions. The C-D curves were obtained with the phantom CDRAD 2.0 in computed radiography and the direct radiography systems (including portable devices). The protocols were 90 and 102 kV in the range of 2 to 16 mAs for the chest and 80 kV in the range of 10 to 80 mAs for the abdomen. The incident air kerma values were evaluated with a solid state sensor. The analysis of these C-D curves help to identify which technique would allow a lower value of the entrance surface air kerma, Ke, while maintaining the image quality from the point of view of C-D
detectability. The results showed that the inverse image quality figure, IQFINV, varied little throughout the range
of mAs, while the value of Ke varied linearly directly with the mAs values. Also, the complete analysis of the
curves indicated that there was an increase in the definition of the details with increasing mAs. It can be concluded that, in the transition phase for the use of the new receptors, it is necessary to evaluate and adjust the practised protocols to ensure, at a minimum, the same levels of the image quality, taking into account the aspects of the radiation protection of the patient.
Keywords: Contrast-Details, Optimization, Dosimetry.
1. INTRODUCTION
In digital radiography, computed radiography (CR) systems and amorphous silicon (a-Si) portable panels for digital direct radiography (DR) are adapted to equipment that was previously used with the screen-film system, and as such all of the characteristics such as the grid, filtration, and x-ray output value are maintained. On the other hand, the systems equipped with a-Si panels (DR) are designed to operate with these image receptors. In this context, there is a need to acquire experience and adjust exposure protocols to ensure the quality of the image while keeping the entrance surface air kerma values in the surface as low as possible [1,2].
When a process of replacing a technology is initiated, it is expected that the new technology option should always present a ratio of advantages to disadvantages that is superior to that of the previously used technology. This ratio includes parameters associated with the image quality, dose to the patient, and environmental and the economic aspects. Currently, in Brazil, widespread replacement of screen-film systems with computed radiography (CR) systems and initiation of the integration of digital radiography (DR) systems of direct or indirect conversion are occurring.
In the CR systems, the conventional image receptor is replaced by a plate formed of a luminescent material, based on the phenomenon called photostimulated luminescence (PSL) [3]. This plate is a two-dimensional detector of ionizing radiation composed of photostimulable phosphors such as barium fluoride halide doped with europium, which is responsible for the storage element of the properties of PSL (BaFBr:Eu or BaFI:Eu) [4]. In a CR system, the entire chain is composed of image acquisition, processing (scanner), display (workstation), printing (digital laser), and image display [4].
The DR systems are divided into two methods depending on the capture element. The first type is the indirect DR systems, which convert the energy of x-rays into light and then into an electrical signal. The generation of light occurs in the scintillator material, usually caesium iodide (CsI), which can be used together with optical fibre chains to conduct the signal to the charge coupled device. Or, through the use of CsI as the capture material of x-rays coupled to the flat panel amorphous silicon (a-Si) [4]. The second type is the direct DR systems, in which the energy of x-rays is converted directly into electrical signals. These systems are based on amorphous selenium (a-Se plate) [4].
At present, there are two options available for the systems based on a-Si: (i) dedicated systems, which form part of the imaging equipment, and (ii) portable systems. These systems work with wireless communication, normally called wireless systems.
From the point of view of image quality, the contrast detectability is defined as the ability of the system to distinguish similar attenuation on the object. The contrast detectability is one of the parameters used for monitoring the maintenance of the quality indices and the comparison between different systems [5].
An analytical definition of the contrast is C=
(
SA−SB)
(
SA+SB)
, where SA∧SB are, respectively, the
intensities of the signal in zones A and B. A disadvantage of this definition is the possibility of setting negative values for contrast [5]. Because of this, another definition that is widely used in radiology is C=
|
SA−SB|
(
Sref)
, where Sref is the signal in a reference zone [5]. This is the intensity of thesignal in a reference area that is independent of the type of signal or the object under study.
The relationship between this type of evaluation and clinical imaging performance is therefore difficult to establish.
An alternative approach is to combine physical levels of image quality with the ability of the human observer. This combination is obtained by analysis of the contrast-detail (C-D) curve. C-D curves are derived based on the limit of visibility of the test objects in the image. A disadvantage of this approach is that the analysis is influenced by the human observer, due to their previous knowledge of the size, shape, and location of low contrast objects.
The use of C-D curves is common for comparing screen-film systems with computed radiography systems and direct and indirect digital systems. At the same time, this concept has also been applied for the comparison of digital systems. In 2003, Lu et al. used the analysis of C-D curves to compare screen-film and computed radiography systems. In this study, the authors concluded that the ability to detect detail in low contrast decreased for both systems: (i) when the voltage increases, the ratio of scattered/primary radiation also increases; (ii) when the thickness increases, the ratio of scattered/primary radiation also increases similarly.
For the CR system, it is necessary to modify the total filtration, to improve the detail detection in low contrast, and to keep the Ke values in the surface of the patient similar to those obtained with
the screen-film system [6].
In a study of the digital imaging of the chest only compared direct digital systems (a-Se, amorphous selenium) with indirect digital systems (a-Si, amorphous silicon) using the C-D curves obtained with the CDRAD 2.0 phantom as an evaluation parameter [3]. This study presented the conclusion that the systems based on a-Si performed best in the detection of details when compared to the receptors based on a-Se. However, the authors concluded that the inverse image quality figure increases with the entrance surface air kerma of the patient more significantly when used the
receptors based on a-Si. The inverse image quality figure is defined as IQFinv= 100
∑
i=1
n
Ci×di, where Ci∧di are, respectively, the contrast values and the diameter of details i of the C-D phantom. The
results also indicated that the exchange of additional filtration by 0.3 mm Cu introduces a positive increase in the IQFINV and promotes a reduction in the Ke values of up to 33% [3].
Morrant et al. (2007) used the CDRAD 2.0 phantom to establish a procedure for adjusting the automatic exposure control (AEC) on an x-ray machine that migrated from screen-film system to CR system. In this study it was verified that using the exposure parameters practiced with the screen-film system after the migration to the CR system resulted in twice as high kerma values. The authors concluded that it is imperative to make adjustments in the AEC, to keep kerma values without neglecting the assessment of image quality, [7].
Another aspect to be considered is that in analog systems (screen-film), the dynamic range of the film is very narrow and does not allow errors in radiographic practice. Thus, the migration from an analog system to digital systems is not a simple exchange of technologies.
In this context, the objectives of this present study were (i) to obtain the C-D curves for two radiographic explorations in clinical conditions, namely the chest and abdomen, using the CR and a-Si receptors, and (ii) to compare the inverse image quality figure, IQFINV, and its dependence on the
2. MATERIALS AND METHODS
2.1. Phantom CDRAD
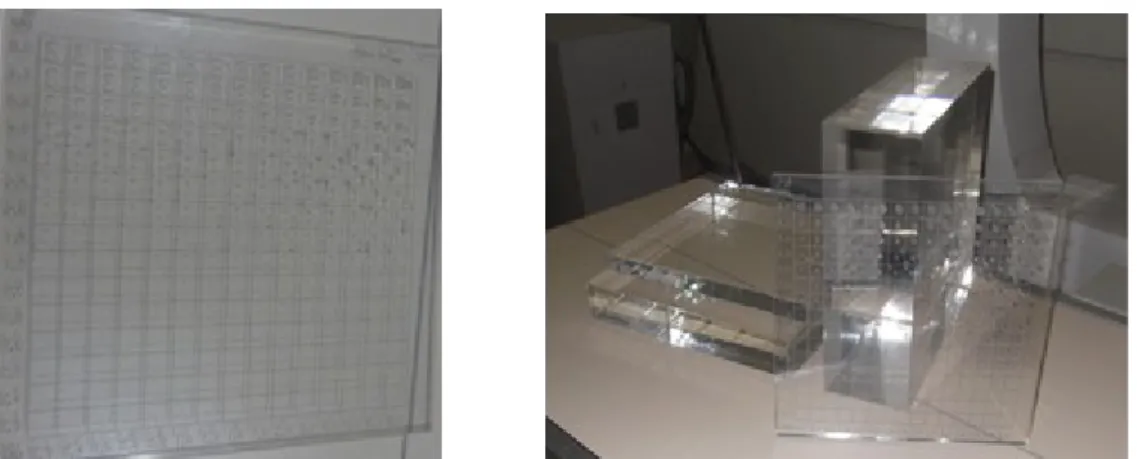
The phantom model CDRAD 2.0 consists of a polymethyl methacrylate (PMMA) plate measuring 265 mm by 265 mm with a thickness of 10 mm. The phantom contains 15 lines and 15 columns, giving a total of 225 square cells. One or two cylindrical holes, depending on the diameter and depth of the hole, are located in each cell. These cylindrical holes have depths and diameters varying logarithmically from 0.3 to 8.0 mm with a tolerance of ±0.03 mm. Figure 1 presents the phantom and PMMA blocks. The first three rows of the plate have only one hole per cell, while the other rows have two identical holes in each cell, one in the centre and the other located in one of the corners. In this case, the detection is considered positive only when both are visualized.
The images were analysed with the help of the software CDRAD Analyser version 2.1 from Artinis Medical Systems BV (phantom analyser and manual). Figure 1 shows the phantom CDRAD 2.0™.
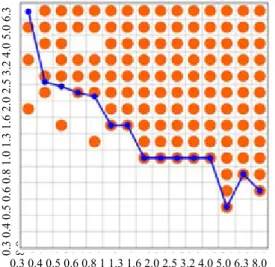
The C-D curves in radiography serve to establish a baseline for a technique associated with a set of x-ray equipment and image receptor and/or to compare image acquisition protocols from the point of view of the threshold of C-D. Visual analysis of the curve or the adoption of metrics is common in the evaluation process. The well-established metric is the image quality index, defined by Equation 1:
Figure 1 - Phantom CDRAD and PMMA plates.
IQFinv= 100
∑
i=1
n
depthi× di ; (1)
where depth represents the contrast. Figure 2 shows an example of a C-D curve.
Figure 2 - Typical C-D curve obtained from the phantom CDRAD 2.0.
Source: study data, Author.
2.2. Equipment and image receptors
Images were acquired using five different x-ray instruments: P1 – Philips Compact 500, P2 – Philips Compact Plus 500, P3 – Philips Compact Plus DR 800, S1 –Siemens Polymat Plus S, and TD – Tecno Design TD 500. The other equipment used consisted of CR cassettes, a DRX1 card, a Digitizer Carestream DirectView CR 975, a Digitizer Konica Regius 110, and a Digitizer Agfa 30X. All CR plates were digitalized using the systems provided by their respective manufacturers. Table 1 presents the main characteristics of the equipment selected for this evaluation.
2.3. Image acquisition techniques and protocols
0.3 0.4 0.5 0.6 0.8 1 1.3 1.6 2.0 2.5 3.2 4.0 5.0 6.3 8.0 0. 3 0. 4 0. 5 0. 6 0. 8 1. 0 1. 3 1. 6 2. 0 2. 5 3. 2 4. 0 5. 0 6. 3 8. 0
For the abdomen protocols, a usual technique with 80 kV and a varied product of tube current and exposure time, mAs, was used. The maximum was 80 mAs. The minimum value of mAs used depended on the characteristics of each x-ray machine.
For the AP chest protocols, two ordinary radiographic techniques were used: 90 and 102 kV with the mAs varying within the range of 2 to 16 mAs.
All images were acquired at the same distances as are used clinically: 100 cm for the abdomen and 180 cm for the chest. The thicknesses used were 17 cm of PMMA + CDRAD (for the abdomen) and 11 cm of PMMA + CDRAD (for the chest).
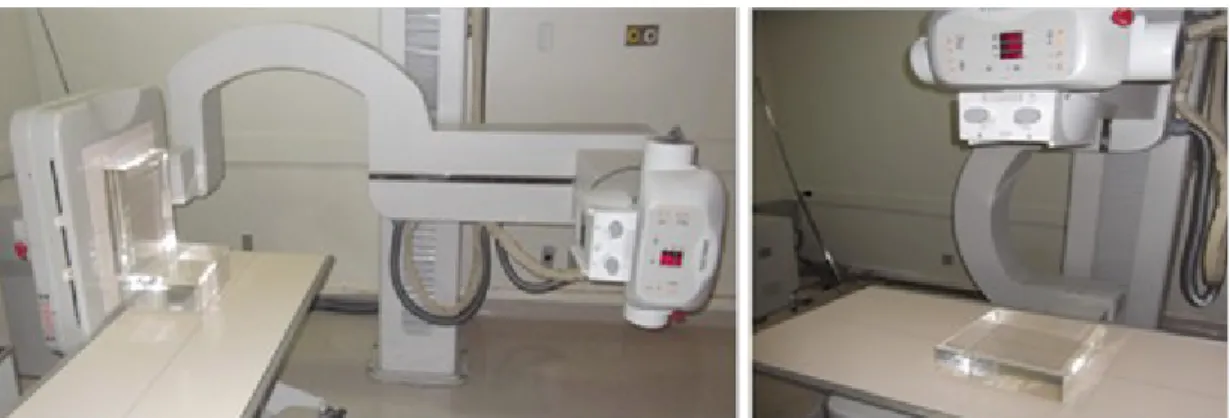
Figure 3 shows the conventional radiology equipment, a Philips Compact Plus 800 DR, positioned for both radiographic views.
Table 1 - Technical characteristics of conventional radiology equipment involved in the evaluation.
Characteristics X-ray Equipment
P1 P3 S1 P2 TD
Current in the tube (mA) 50–500 50–800 50–500 50–630 50–500
High voltage (kVp) 40–125 40–125 40–130 40–125 40–125
HVL @ 80 kV (mmAl) 3.6 3.6 3.7 2.5 2.3
Tube output (mGy/mA.min
@ 1 m) 3.9 3.8 4.1 2.8 2.5
Image Receptor
CR
CareStream/ DRX wireless
DR a-Si CR Konica/ CRCareStream CRCareStream CR Agfa
P1 – Philips Compact 500 ™; P2 – Philips Compact Plus 500 ™; P3 – Philips Compact Plus DR 800 ™; S1 – Siemens Polymat Plus S; TD – Tecno Design TD 500
Source: study data, Author.
2.4. Assessment of incident air kerma on the entrance surface
To evaluate the incident air kerma (Ki) and the half-value layer (HVL), a Rapidose™ model
multimeter (Radcal) coupled to a notebook with Radcal Rapidose™ software was used. Table 2 lists the main features of the multimeter.
Table 2 – Technical characteristics of the Radcal Rapidose™ multimeter.
Sensor Range ofkVp
Filtration (millimetres of Al)
HVL (millimetres
of Al) Dose/Dose Rate
RAPD-W 40–160 2–22 1.3–10 ±10% 50 nGy – 50 Gy ±2%
160 nGy/s – 160 mGy/s ±2%
3. RESULTS AND DISCUSSION
Considering that the C-D curves do not clearly and quantitatively evidence the behaviour of the response of the image receptors with respect to the mAs, it was decided to present only the inverse image quality figure, IQFINV, and the values of the entrance surface air kerma, Ke. It is understood
that using IQFINV values is the best option and thus, with this option, higher numerical values
indicate gain in the detection of details. For each value of mAs five images were acquired, analyzed and calculated the mean value and the standard deviation of IQFINV.
The results are presented in graphics consisting of the IQFINV as a function of Ke in the surface of the
phantom for abdominal exposure at 80 kV and chest at 90 and 102 kV.
The Ke values were calculated from the values of the incident air kerma, Ki, using the
backscatter factors from the IAEA TRS 457 [8]. The uncertainty in the determination of incident air kerma was estimated as ±5% based on the specifications of the manufacturer and the values of the standard deviations obtained for the IQFINV measurements were used to represent the error bar in the
respective results. The values of Ke have, as expected, linear dependence with the values of mAs.
3.1. Abdominal Protocols
Figure 4 presents all the data for the abdomen protocols at 80 kV and equipment or evaluated image receptors. That is, IQFINV as a function of Ke.
Analysing the data presented in the graph in Figure 4, it is noted that there is not common response among the evaluated image receptors. Among the CR systems, the Agfa and Konica systems showed a clear improvement in IQFINV values and an improvement in the C-D detectability with increasing mAs (Ke). The
two CR CareStream systems showed an improvement in IQFINV values for the first values of mAs in the
range of 10 mAs (Ke ≈0.94 mGy) to 30 mAs (Ke ≈3.73 to Ke ≈4.70 mGy). For the values greater than 30
mAs, it cannot be confirmed whether there is a tendency toward improvement or not. In practical terms it can be said to remain constant. Similar results were reported by Morrant et al. [7].
The two a-Si flat panels used were (1) DRX – CareStream, a portable panel used on Philips x-ray equipment and identified as P1 and (2) an a-Si panel dedicated to Philips P3 equipment, identified as P3.
Figure 4 - Inverse image quality figure, IQFINV, in function of the entrance surface air-kerma for
The DRX panel presented behaviour very similar to the CR CareStream system used in the same equipment in P1. The only noted difference was a higher IQFINV value corresponding to 20 mAs (Ke =2.94
mGy). A better performance for a flat panel of a-Si is expected for this high voltage value, kV, even considering the high values of entrance surface air kerma or mAs. This finding is similar to that reported by Fischbach et al. [9].
For the flat panel DR coupled to the Philips P3 equipment, the results showed a small improvement in C-D detectability with increasing variation of entrance surface air kerma. This same behaviour was observed by Fischbach et al. [9]. Again, a better performance of this image receptor was expected based on a-Si. In this case, a better performance is expected for two reasons: first, the DR flat panel was based on a-Si and secondly, the complete system was designed specifically to work with a digital receptor.
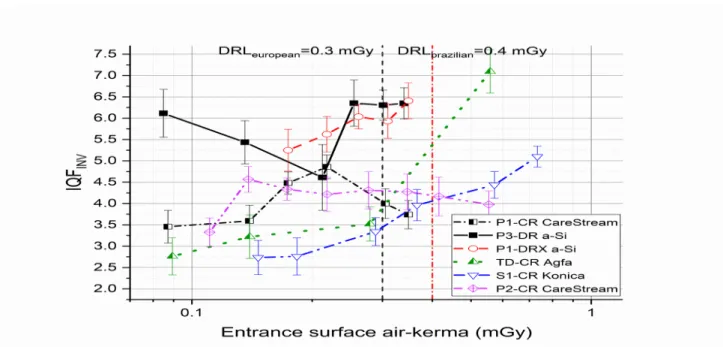
The highest IQFINV values correspond to the best conditions for detectability of details. These conditions,
with the highest values of IQFINV, correspond to the highest values of entrance surface air kerma (Ke) and
consequently the Diagnostic Reference Level, DRL=10 mGy [10], was reached. The DRL value was exceeded from ~63 mAs for four sets (x-ray machine + image): (S1+CR – Konica; P1+CR – CareStream;
P1+a-Si DRX; and P3+a-Si DR) (Figure 4).
For the other receptors, it was observed that the Ke value can approximate the recommended level and
this is not consistent with the principles of optimization and use of the new technologies [2]. Even so, a better performance is to be expected for the digital receptors [8,10].
For this reason, from the point of view of radiation protection of the patient, the highest IQFINV values do
3.2. AP Chest Protocols
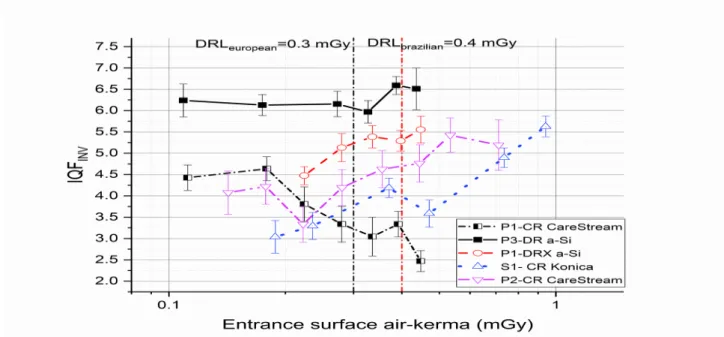
Figures 5 and 6 present all data for chest protocols io the two kV values (90 and 102 kV) and equipment/ image receptors evaluated. That is, IQFINV as a function of Ke.
Analysing the data presented in the graphs in Figures 5 and 6, it is noted, as in the abdomen protocols, that there is not a common response among the evaluated image receptors. In the case of the chest protocols, the analysis will be divided into sections according to the kilovolt value: first, 90 kV, and second, 102 kV.
For CR systems at 90 kV, the Agfa and Konica systems showed a clear improvement in IQFINV
values and a significant improvement in the C-D detectability with increases in the entrance surface air kerma. The analysis for the Agfa system was impaired by technical limitations of the x-ray equipment when operated at 102 kV.
Figure 5 - Inverse image quality figure, IQFINV, in function of the entrance surface air kerma for
chest protocols with 90 kV.
The two CR CareStream systems at 90 kV showed an improvement in IQFINV values for the first
5 mAs, the system CR CareStream used in x-ray equipment P1 presented a variation in the IQFINV
values (improvement and/or worsening), making it difficult to affirm that there is a gain in the detectability of details. For the other, CR CareStream system, also at 90 kV, above 4 mAs (Ke ≈0.17
mGy) there was a slight loss in the ability to detect details. However, in terms of IQFINV, for
practical use, there were no significant differences. At 102 kV, the CareStream receptors showed opposite behaviours. The receptor used in the x-ray equipment P2 showed a significant increase in the IQFINV values and consequent improvement in the detectability of the details. In contrast, the
other receptor clearly showed a reduction in IQFINV values, indicating that with increases in the
mAs, the ability to detect details is reduced.
The portable panel DRX-CareStream at 90 kV presented an improvement in IQFINV values for
the whole range of mAs. The analysis of the results for the DR receptor at 90 kV showed a practically constant behaviour in terms of IQFINV values, excluding the IQFINV value associated with
4 mAs. For this value of mAs, the equipment surely presented a fault that was directly reflected in the value of Ke. At 102 kV, both receptors based on a-Si presented behaviour similar to that at 90
kV.
Unlike the case of the abdomen protocols, the Ke values for the chest protocols easily reached
the reference level, DRLbrazilian = 0.4 mGy [10] or DRLeuropean = 0.3 mGy [11]. The European DRL
was reached and exceeded at 90 kV for the set (x-ray machine + image receptor) above the following mAs values: 7 mAs (S1+CR- Konica and P1+CR – CareStream), 8 mAs (P2+CR –
CareStream), and 10 mAs (TD+CR Agfa). For the two sets based on the a-Si flat panel (P1+a-Si DRX and P3+a-Si DR), the European DRL was reached and exceeded for values of mAs greater
Figure 6 - Inverse image quality figure, IQFINV, in function of the entrance surface air-kerma for
chest protocols with 102 kV.
At 102 kV, among the five sets (x-ray machine + image receptor), the European DRL was exceeded above 5 mAs except in the case of the P2+CR – CareStream set, for which this only occurred at values of mAs greater than 6 mAs. Again the evaluation of the Agfa system was impaired due to the technical limitation already discussed previously.
For the user, in this type of analysis it is important and essential to completely understand the characteristics of each different image receptor [1,2]. Only in this way can the decision-making process regarding the best radiographic technique be achieved. The decision establishing the best technique should combine aspects of the radiation protection and image quality [2].
A practical application of the principle of the radiation protection optimization of the patients was achieved using the results of the study. The protocols for the abdomen and chest images have been revised and a limit for the exposure of typical patients has been implemented.
In this way it is understood that the objectives of this study were achieved with the adoption of instructions and the establishment of protocols that meet the criteria of image quality and do not exceed the Brazilian DRLs.
The IQFINV values represented are means obtained at each exposure. They were analyzed
statistically by the Mann-Whitney U Test (95% confidence level) [12]. The results were compared two-to-two between image receivers of the same technology. For the abdomen protocol only the comparison P1-CR CareStream – S1-CR Konica did not present statistical significance, p = 0.23 (p> 0.05). For chest protocols with 90 kV the 90 kV all comparisons presented p> 0.05 and for 102 kV the comparisons P3-DR a-Si/P1-DRX a-Si and P1-CR CareStream – P2-CR CareStream presented significance p <0.05.
3.4. General considerations
Tavares (2013) [13] in his study found IQFINV behavior as a function of the dose for a CR Agfa system
that does not present linear fitting. A linear fit was expected for this Agfa system considering that the response of this system to the dose value (kerma) is linear. The observed behavior shows increase and decrease with the progress in the dose value. And, in this way, a polynomial fit was used to describe this behavior. Other relevant studies De Hauwere et al (2005) [12] and Fernadez et al. (2008) [14] evaluated x-ray systems based on CR plates and a-Si flat panel systems considering the IQFINV as quantitative evaluation
parameters. De Hauwere et al compared analyzes of soft copy and hard copy images. Their results show similar behavior to the present study except for a-Si DRX and a-Si DR. In the results presented by Fernandez et al easily identifies a logarithmic behavior of the evolution of the IQF value with respect to the value of the dosimetric parameter. Also it is verified that there is the behavior of the type increases / decreases even if smoothly.
The evaluation of digital radiography systems under clinical conditions involves numerous technical and practical aspects. CR systems are usually tailored and some requirement may not have been met, such as grid type. Currently, CR plate manufacturers recommend the adoption of stationary grids for superior image quality and artifact reduction. It is well known that much x-ray equipment uses oscillating grids. And, among the CR systems involved in this study two sets: P2-CR CareStream and S1 - CR Konica have stationary grids. In fact these sets show an evolution of the value of IQFINV with respect to the increase of the value of
Ke and can be adjusted by a logarithmic function.
The oscillating grids use an electromagnet + spring system to operate. The P1- DRX a-Si set uses this type of grid and is a probable cause that it does not respond as expected to an a-Si panel.
Finally, in this study and in a similar way to the study by Tavares [12], we argued that the importance of the evaluation and comparison of different digital imaging systems (x-ray detectors and equipment) is to show, through quantitative evaluation, the performance and general conditions of operations. And in this way promote the culture and awareness of optimization in radiological procedures. It is also possible to demystify that digital systems are by themselves superior and optimized techniques.
4. CONCLUSION
It can be concluded that in the transition phase for the use of the new receptors, it is necessary to evaluate and adjust the practised protocols to ensure and improve the indices of the image quality, taking into account the aspects of the radiation protection of the patient. At the same time, it should be remembered that even with the use of digital technology, the practice of good radiographic techniques should be emphasized. It can also be concluded that the optimization of digital radiology can only be achieved by knowing the technology and evaluating it with already established methods and techniques such as evaluation of the contrast–detail curve. Good radiological practice should always be the basis of radiology and radiological protection of patients regardless of the technology used.
5.
ACKNOWLEDGEMENTS
The authors thank the Federal Institute of Bahia for support and Professor Dr Balmukund Niljay Patel of the State University of Feira de Santana for his relevant contribution to the discussion.
REFERENCES
[1] ICRP. Managing patient dose in digital radiology. A report of the International Commission on Radiological Protection. Annals of the ICRP 2004;34(1):1-73.
[2] VANO, Eliseo. ICRP recommendations on “managing patient dose in digital radiology”. Radiation
Protection Dosimetry v. 114, n. 1–3, p. 126–130, 2005.
[3] BACHER, KLAUS ET AL. Image quality and radiation dose on digital chest imaging: Comparison of amorphous silicon and amorphous selenium flat-panel systems. American Journal of Roentgenology v. 187, n. 3, p. 630–637 , 2006.
p. .9788535237320.
[5] BUSHBERG, Jonh. The Essencial of Physics of Medical Imaging. 2nd. ed. [S.l.]: Lippincott Williams
and Wilkins, 2002. .
[6] LU, Z.F., NICKOLOFF, E.L., SO, J.C., DUTTA, A.K. Comparison of computed radiography and film/screen combination using a contrast-detail phantom. Journal of Applied Clinical Medical Physics v. 4, n. S.I., p. 91–98 , 2003.
[7] MORANT, J.J., CHAVALIER, M. SALVADÓ, M. MORÁN, P. LOPEZ, M. Procedimento de Ajuste Del Control Aumotático de la Exposición en Sistemas de Radiología Digital Computadorizada. In: XI
Congreso Nacional de la Sociedad Española de Protección Radiológica 2007, Tarragona, España,
Annals, Tarragona: Sociedad Española de Protección Radiológica [S.l: s.n.], 2007. p.1–4.
[8] INTERNATIONAL ATOMIC ENERGY AGENCY. Dosimetry in Diagnostic Radiology: An
International Code of Practice. Vienna: INTERNATIONAL ATOMIC ENERGY AGENCY, 2007.
Disponível em: <http://www-pub.iaea.org/books/IAEABooks/7638/Dosimetry-in-Diagnostic-Radiology-An-International-Code-of-Practice>. (Technical Reports Series).
[9] FISCHBACH, F. et al. Flat Panel Digital Radiography Compared With Storage Phosphor Computed Radiography: Assessment of Dose Versus Image Quality in Phantom Studies. Investigative Radiology v. 37, n. 11, 2002.
[10] BRASIL. MINISTÉRIO DA SAÚDE. AGÊNCIA NACIONAL DE VIGILÂNCIA SANITÁRIA. Portaria 453, 01/06/1998. Portaria SVS/MS 453, 01/06/1998 v. 1 , 1998. Disponível em: <www.saude.mg.gov.br/images/documentos/Portaria_453.pdf>.9788578110796.
[11] VOGIATZI, S. et al. Guidance on diagnostic reference levels (DRLs) for medical exposures.
Radiation Protection Dosimetry v. 80, n. 1, p. 1–26 , 1998. Disponível em:
<http://scholar.google.com/scholar?
hl=en&btnG=Search&q=intitle:Guidance+on+Diagnostic+Reference+Levels+(DRLs) +for+Medical+Exposures#0>.0025900705725.
[12] De HAUWERE, A, K BACHER, P SMEETS, K VERSTRAETE a H THIERENS. Analysis of image quality in digital chest imaging. Radiation protection dosimetry [online]. 2005, 117(1–3), 174–7. ISSN 0144-8420. doi:10.1093/rpd/nci748
[13] TAVARES, A. J. P. Efeito dos parâmetros técnicos na dose e qualidade de imagem num sistema de
radiografia computadorizada. Instituto Politécnico de Lisboa, 2013. 99 p. Disponível em:
<http://docplayer.com.br/6754208-Instituto-politecnico-de-lisboa-escola-superior-de-tecnologia-da-saude-de-lisboa.html>.
[14] FERNANDEZ, J. M., J. M. ORDIALES, E. GUIBELALDE, C. PRIETO a E. VANO. Physical image quality comparison of four types of digital detector for chest radiology. Radiation Protection Dosimetry [online]. 2008, 129(1–3), 140–143. ISSN 01448420. doi:10.1093/rpd/ncn026