of Chemical
Engineering
ISSN 0104-6632 Printed in Brazil www.scielo.br/bjce
Vol. 35, No. 02, pp. 327 - 340, April - June, 2018 dx.doi.org/10.1590/0104-6632.20180352s20160265
OPTIMIZATION OF THE EXTRACTION OF
FREE FATTY ACIDS APPLIED TO BIODIESEL
PRODUCTION
#Allan A. Albuquerque
1, Cláudia J. S. Cavalcanti
1, Cícero H. M. Soares
1,
Maria Fernanda Pimentel
1and Luiz Stragevitch
1,*Fuel Laboratory, Chemical Engineering Department, Federal University of Pernambuco, Av. Prof. Artur de Sá S/N, CEP 50740-521, Recife, PE, Brazil.
(Submitted: April 26, 2016; Revised: October 8, 2016; Accepted: January 20, 2017)
Abstract - The liquid-liquid extraction of free fatty acids (FFA) from residual oils and fats for biodiesel production, employing methanol as the solvent, has been optimized using process simulation and response surface methodology. The parameters investigated were temperature, number of stages and solvent-to-feed ratio (S/F). Responses evaluated were FFA mass fraction in the oil-rich phase (wBFFA) and total cost, using yellow and brown greases as the raw materials. Quadratic and linear models were fitted for wFFAB and cost responses, respectively.
The optimal conditions satisfying technical (wFFAB ≤ 0.5%) and economic (minimum cost, including capital and
operation costs, except for raw material cost) criteria were 321 K, 6 stages, S/F = 1.27, wFFAB = 0.41%, cost =
$84.93/ton (yellow grease), and 318 K, 6 stages, S/F = 1.32, wBFFA = 0.49%, cost = $102.89/ton (brown grease).
Keywords:Biodiesel, Residual oils and fats, Free fatty acids, Liquid-liquid extraction, Response surface methodology.
INTRODUCTION
Biodiesel production is usually carried out
through a transesterification reaction, which consists
of a chemical reaction of a vegetable oil, animal fat or residual oil and fat (ROF) with a short chain alcohol (methanol or ethanol) in the presence of a catalyst (Van Gerpen, 2005; Gnanaprakasam et al.,
2013). Refined vegetable oils are largely employed
as raw materials in the biodiesel industry; they can
represent up to 85% of biodiesel costs. Thus, less
costly raw materials, such as ROF, have been gaining more attention (Canakci and Sanli, 2008; Avhad and Marchetti, 2015).
ROF can be 40% to 70% cheaper than refined
vegetable oils (Refaat, 2010; Cai et al., 2015).
In addition, environmental and economic issues related to the improper disposal of ROF are a concern. Further, sewage treatment plants are subjected to increasing costs to treat ROF (Iasmin et al., 2014; Ortner et al., 2016). Among ROFs, waste frying oils are derived from various vegetable oils, such as sunflower, corn, and especially soybean oil (Jorge et al., 2005; Tsoutsos et al., 2016). ROFs such as from waste frying oils and animal fat wastes have high levels of free fatty acids (FFA) (Gnanaprakasam et al., 2013). ROFs can be generally found as yellow or brown greases depending on whether the FFA content is between
5% and 15% (yellow) or above 15% (brown)
(Canakci and Sanli, 2008; Adewale et al., 2015; Avhad and Marchetti, 2015).
* Corresponding author: Luiz Stragevitch. E-mail: [email protected].
High FFA levels in the raw material cause operational drawbacks in the achievement of high biodiesel yields, mainly due to the occurrence of competitive reactions of
FFA saponification and triacylglycerol (TAG) hydrolysis
(Gnanaprakasam et al., 2013). To increase the production yield, ROF is usually subjected to an initial pretreatment
step with an acid-catalyzed esterification reaction; then,
the resulting stream undergoes an alkali-catalyzed
transesterification step (Canakci and Van Gerpen, 2001),
which is known as the conventional process. The acid-catalyzed pretreatment step increases capital and operation costs since it requires additional equipment and a glycerol washing stage (Zhang et al., 2003).
On the other hand, alternative processes employing the FFA separation from the oil have proven to be economically more attractive (Albuquerque et al., 2016). FFA separation is widely used in the food industry to produce edible oils. FFA separation can be carried out by liquid-liquid extraction (LLEx) using a short-chain alcohol as the solvent (Bhosle and Subramanian, 2005; Rodrigues et al., 2007; Vaisali et al., 2015), making it a potentially interesting process for the biodiesel industry. Despite this, studies using LLEx to separate FFA, including cost estimates, have not been found in
the literature, except in the refining of edible oils with
ethanol and ethanol/water mixtures as solvents (Batista et al., 1999b; Pina and Meirelles, 2000; Batista et al., 2002). Because the biodiesel industry predominantly uses methanol as the reaction agent, development of a LLEx process to separate FFA with methanol as the solvent may be of interest to the industry.
In this work, the LLEx of FFA from ROF employing methanol as the solvent was optimized using response surface methodology (RSM) and Aspen software for process simulation. The parameters investigated were temperature (T), number of stages (N) and solvent to feed ratio (S/F). The FFA mass fraction (solvent free basis) in the oil-rich phase (wFFAB ) and the total cost
were the responses evaluated. The study goals were: to attain wFFAB values below the recommended FFA
concentration in TAG (a mass fraction of 0.5%) for the alkali-catalyzed transesterification step (Ma and
Hanna, 1999); and to attain technical and economic feasibility of the process with a minimum total cost.
METHODOLOGY
Thermophysical properties prediction and thermodynamic modeling
Thermophysical properties for the ROF were predicted using the Constituent Fragments (CF) and
w 100 2N N1 w ,exp w ,cal
t c ij
l ij l l j N i N 1 2 1 2 1 t c #
D =
-= = =
R QV QV W
/
/
/
Extended Constituent Fragments (ECF) approaches (Zong et al., 2009; Cruz-Forero et al., 2012). Subsequently, a rigorous thermodynamic modeling applied to vegetable oil/FFA/methanol systems was carried out to represent the liquid-liquid equilibrium (LLE) in the LLEx column. The Non-Random Two-Liquid (NRTL) model was used (Renon and Prausnitz, 1968).
Experimental LLE data from Batista et al. (1999a), Mohsen-Nia and Dargahi (2007), Liu et al. (2008) and Mohsen-Nia and Khodayari (2008) were used to estimate the NRTL binary interaction parameters to be used in the process simulation. The NRTL parameters were estimated by minimization of the objective function given by (Stragevitch and d’Ávila, 1997)
(1)
where w is the phase composition (mass fraction); exp and cal denote experimental and calculated compositions, respectively; Nc,k and Nt,k are, respectively, the number of components and tie lines in the k-th data set; ND is the number of data sets simultaneously correlated; subscripts i, j and k denote components, tie lines and data sets, respectively; and superscript l denotes phases in equilibrium . Experimental and calculated compositions involved in LLE systems were compared using the root mean square deviation (RMSD), according to
(2)
for each data set as well as a global deviation involving all correlated data sets.
Process simulation
Aspen software was used in the process simulation. The ROF composition used in the LLEx column was
defined based on a mixture of the vegetable oils found in
the vegetable oil/FFA/methanol LLE systems available (Batista et al., 1999a; Mohsen-Nia and Dargahi, 2007; Liu et al., 2008; Mohsen-Nia and Khodayari, 2008). Figure 1 illustrates the LLEx column, which was operated at constant pressure (101.3 kPa) and was fed at the top stage with 1050 kg/h of ROF, while the methanol (M) (solvent) was fed at the bottom stage. Two cases were studied to evaluate the FFA/ROF separation from a wide range of FFA content. For
=
F
w
( ),ijkexpw
( ),call ijk l l k N j N i N 1 2 1 2 1 1 ,
, t k D
c k
-= = =
=
Q
V
/
/
/
case 1, a ROF composed of 10% FFA was adopted; while for case 2, a ROF with 20% of FFA was used. In
both cases the remaining content was the TAG. Cases 1 and 2 are representative of common ROFs found, known as yellow and brown greases, respectively (Canakci and Sanli, 2008; Mohite et al., 2015).
Capital costs included the LLEx column and heaters or coolers (purchase cost) adopting the preliminary Chemical Engineering’s Plant Cost Index (CEPCI) of 537.7 (December, 2015). In this study, the LLEx column was designed as a rotating disk contactor (RDC). The RDC type was chosen following selection schemes for extractors based on heuristics from commercial extractors (Seader et al., 2011). The extractor diameter and height were calculated based on Seider et al. (2009) and Seader et al. (2011). Following Seider et al. (2009), the heat exchangers were designed as a double-tube type (area less than 150 ft2) or shell
and tube type (area greater than 150 ft2). A detailed
description of the design procedure can be found in Albuquerque et al. (2016).
Operation costs included utility costs (vapor or water in heat exchangers) and solvent (methanol) cost and were calculated as presented by Albuquerque et al. (2016). The methanol cost was calculated multiplying the price of methanol ($0.85/kg) by the methanol mass
flow rate fed plus a factor to account for the solvent make-up, 7.4% and 8.5% for cases 1 and 2, respectively
(Albuquerque et al., 2016). The raw material (ROF) cost was not included in the operation costs to avoid
masking since it is significantly higher than the capital
and other operation costs. Nonetheless, it is constant
for a constant flow rate of ROF, as used in this work, thus, not affecting the conclusions obtained.
After the results of the 23 design were evaluated, new
computational experiments, using a central composite
design (CCD), were carried out to estimate the coefficients
of a quadratic model. Statistica Ultimate Academic software was employed in all calculations.
RESULTS AND DISCUSSION
Thermophysical properties prediction and thermodynamic modeling
Trilinolein (LLL) was adopted as the representative TAG of ROF in the process simulations. LLL was chosen based on the FFA compositions of the vegetable oils found in the oil/FFA/methanol LLE systems used, which indicated linoleic acid as the
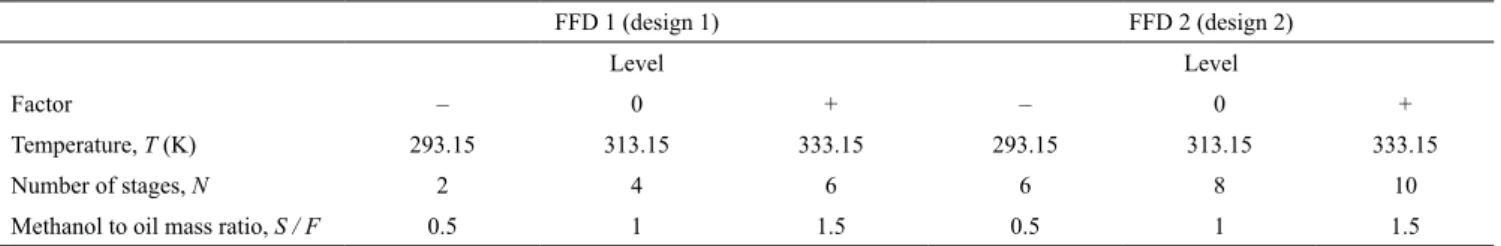
Table 1. Factors and levels of factorial design.
FFD 1 (design 1) FFD 2 (design 2)
Level Level
Factor – 0 + – 0 +
Temperature, T (K) 293.15 313.15 333.15 293.15 313.15 333.15
Number of stages, N 2 4 6 6 8 10
Methanol to oil mass ratio, S / F 0.5 1 1.5 0.5 1 1.5
Figure 1. Flowsheet of FFA separation from ROF using a LLEx column.
Full Factorial Design and Response Surface Methodology
In order to optimize the FFA separation from ROF using a LLEx process, initially a 23 full factorial design
(FFD) including a central point was carried out. The parameters investigated were T, N and S/F as presented in Table 1 and in Figure 1, where FFD 1 (design 1)
and FFD 2 (design 2) differ only in the levels used
for N. The levels for N and S/F were chosen based on the process simulation of an alternative process to produce biodiesel applying FFA separation from ROF by LLEx (Albuquerque et al., 2016) while temperature
levels were defined by the temperature range from the
available LLE data.
The FFA mass fraction (solvent free basis) in the oil-rich phase (wBFFA), found at the bottom output stream
of the extraction column, and the total cost involved
in the first year of the LLEx column operation, were
the responses evaluated. The goal was to achieve the design and operational conditions that simultaneously
satisfied the recommended specification of wFFAB
≤ 0.5% and minimum total cost in the first year of
most abundant fragment (Batista et al., 1999a; Mohsen-Nia and Dargahi, 2007; Liu et al., 2008; Mohsen-Nia and Khodayari, 2008). Furthermore, LLL was also the most important TAG composed of homogenous fragments. Use of a TAG composed of
only one carbon chain simplifies the transesterification
reaction modeling since only one diacylglycerol and one monoacylglycerol need to be used. The TAG composition of the ROF used is shown in Table 2, and was calculated from the FFA composition of a mixture
of canola, corn, sunflower and jatropha curcas oils
present in the LLE data adopted. The methodology proposed by Antoniosi Filho et al. (1995) was used.
Only the main FFAs (palmitic 11.7%, stearic 3.2%, oleic 33.3%, linoleic 48.3% and linolenic 3.5% wt)
were used to calculate the TAG composition, since
they represented 98.7% of the FFA composition of canola oil, 98.2% of corn oil, 99.7% sunflower oil and 99.4% of jatropha curcas oil.
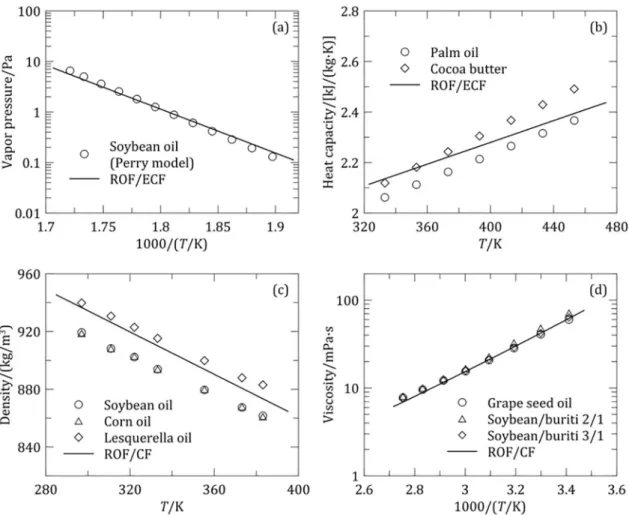
A number of thermophysical properties were predicted for the ROF, for example: enthalpy of vaporization at 298.15 K (166 kJ/mol), vapor pressure, liquid heat capacity, mass density and viscosity. Mass density and viscosity were estimated by the CF method, while the others were estimated by the ECF method.
The results were compared to several vegetable oils for which the properties measured are reported in the literature, as shown in Figure 2 (Perry et al., 1949; Noureddini et al., 1992; Morad et al., 2000; Ceriani
et al., 2008). Differences were encountered since the oils are different; Figure 2 shows that the predicted
values for the ROF used, however, were consistent with common oils.
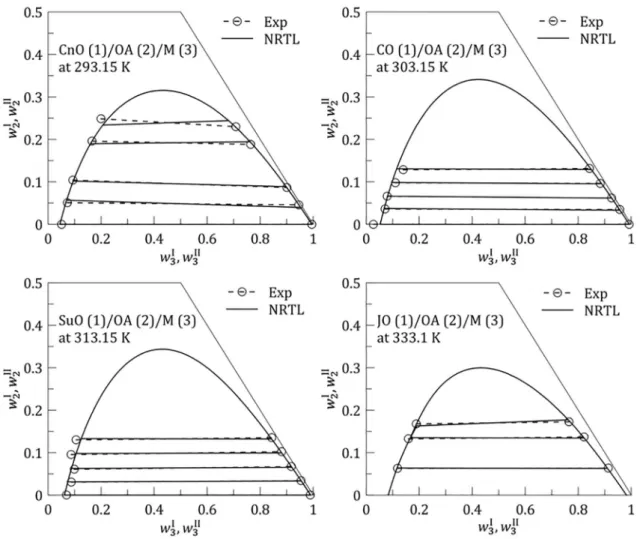
LLE data reported in the literature were employed to carry out the thermodynamic modeling. The systems used were: canola oil (CnO)/oleic acid (OA)/methanol (M) at 293.15 K and 303.15 K (Batista et al., 1999a); jatropha curcas oil (JO)/OA/M at 303.1, 313.1, 323.1 and 333.1 K (Liu et al., 2008); corn oil (CO)/OA/M at 303.15 K and 313.15 K (Mohsen-Nia and Dargahi,
2007) and sunflower oil (SuO)/OA/M at 303.15 K and
313.15 K (Mohsen-Nia and Khodayari, 2008). Table 3 shows the RMSD obtained using the NRTL model. Agreement between experimental and calculated LLE was satisfactory to develop a reliable simulation of the extraction process. A comparison of experimental and calculated LLE data using the NRTL model is shown in Figure 3 for some selected systems (one system
for each oil at different temperatures). The NRTL
interaction parameters obtained are shown in Table 4.
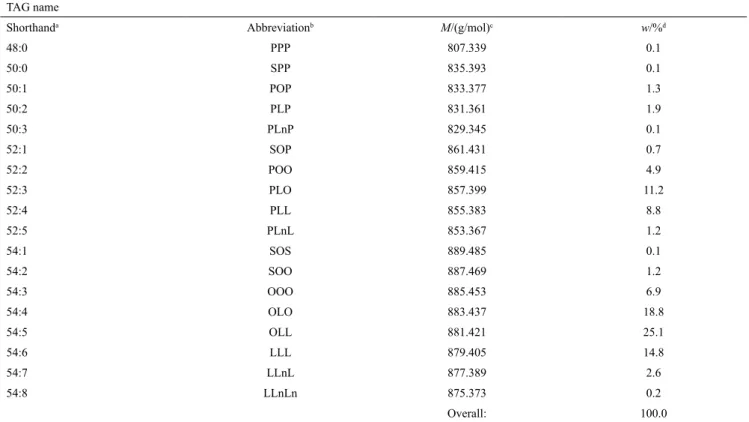
Table 2. TAG composition of the ROF used.
TAG name
Shorthanda Abbreviationb M/(g/mol)c w/%d
48:0 PPP 807.339 0.1
50:0 SPP 835.393 0.1
50:1 POP 833.377 1.3
50:2 PLP 831.361 1.9
50:3 PLnP 829.345 0.1
52:1 SOP 861.431 0.7
52:2 POO 859.415 4.9
52:3 PLO 857.399 11.2
52:4 PLL 855.383 8.8
52:5 PLnL 853.367 1.2
54:1 SOS 889.485 0.1
54:2 SOO 887.469 1.2
54:3 OOO 885.453 6.9
54:4 OLO 883.437 18.8
54:5 OLL 881.421 25.1
54:6 LLL 879.405 14.8
54:7 LLnL 877.389 2.6
54:8 LLnLn 875.373 0.2
Overall: 100.0
aThe two numbers separated by a colon stand for the chain length and number of double bonds;
bAbbreviation for trivial names of TAG chains: P = Palmitic, S = Stearic, O = Oleic, L = Linoleic, Ln = Linolenic; cMolar mass;
Table 3. RMSD obtained in the LLE correlation with NRTL.
System T/K Δw/%
CnO/OA/M 293.15 0.81
CnO/OA/M 303.15 0.73
CO/OA/M 303.15 0.98
CO/OA/M 313.15 0.77
SuO/OA/M 303.15 1.49
SuO/OA/M 313.15 0.90
JO/OA/M 303.1 0.42
JO/OA/M 313.1 0.67
JO/OA/M 323.1 1.03
JO/OA/M 333.1 0.40
Overall 0.90
Figure 2. Thermophysical properties for some vegetable oils (experimental) and for the used ROF (predicted).
Table 4. NRTL binary interaction parameters for ROF (1)/OA (2)/M (3) system a, b.
Pair Aij/K
0
Q V
A( )
ij
1
A( )
ji
1
ij ji
a =a
12 438.71 –4592.83 –1.2224 14.495 0.47
13 2619.72 931.84 –9.3260 5.0573 0.2764
23 1478.22 –6632.54 –6.2877 25.036 0.4408
aROF was represented by trilinolein (LLL) in LLE regression and in the simulation. bNRTL model with temperature dependent parameters as A A( ) A( )T
ij ij ij
0 1
= +
/K
Aij
0
Figure 3. Experimental and calculated LLE data.
Optimization of the liquid-liquid extraction process
Table 5 shows the values of the two responses evaluated for the 23 factorial designs, including a
central point (lines 1-9 in Table 5). A test on the wFFA B
response showed a significant curvature, suggesting
that a quadratic model may be more appropriate, for both cases 1 and 2. Therefore, extra computational experiments were carried out to complete a central composite design (CCD) (lines 10-15 in Table 5). A CCD with β = 1 was used due to the impossibility of using larger β values since N is an integer variable.
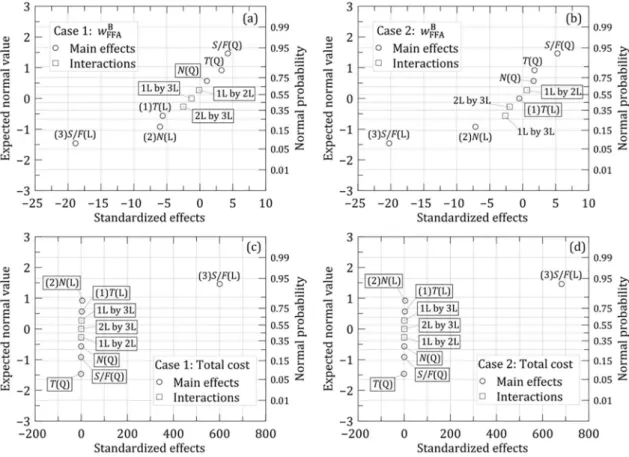
The coefficients of a quadratic model were then estimated. The significance of the coefficients was
evaluated using normal probability plots (Figure 4) (Bruns et al., 2006). Based on these results, the quadratic
coefficient of N and all the interaction coefficients did
not significantly affect the wFFAB response for case 1
(Figure 4a). For case 2, Figure 4b shows the interaction
T×N (1L by 2L) and the linear coefficient of T (T(L))
were not significant in the range studied. For the total
cost response, Figures 4c and 4d clearly show that only
the linear coefficient of S/F [S/F(L)] was significant.
A quadratic model for wFFAB and a linear model for
total cost responses were appropriately fitted. Table 6 shows the models obtained for FFD 1, the coefficient of
determination (R2) and the residual mean square (MS r)
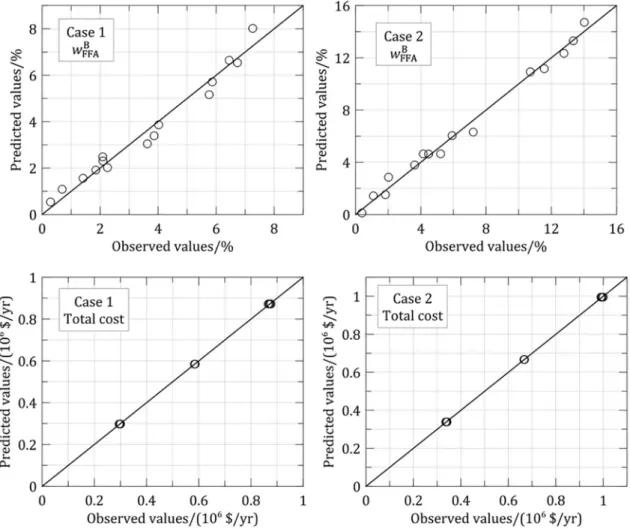
values. The predicted results were also compared to the observed ones, as shown in Figure 5 for wFFAB and total
cost responses for each case. Satisfactory agreement between predicted and observed results was obtained.
Equation (3) gives a linear relationship of the response wFFAB with N for case 1. Since the slope is
less than zero, the maximum value for the N level (N
= 6 stages) can be adopted. For case 2, although there
are additional effects of N according to equation (5), minimum wFFAB is also obtained for N = 6. The contour
plots for wFFA B
, using N = 6, are shown in Figure 6. As mentioned before, the optimal condition would the one that makes wFFAB less than 0.5% with a minimum
total cost. Minimum cost is obtained at the lowest possible S/F ratio, since the total cost varies linearly with the S/F , according to equations (4) and (6). The lowest possible S/F ratio, still satisfying wFFAB ≤ 0.5%, is
Table 5. Values wBFFA of and total cost responses obtained for FFD 1 and CCD 1.
Case 1 Case 2
Run T Na S / F
wFFAB /% Cost/($/yr) wFFAB /% Cost/($/yr)
1 – – – 7.26 294,743 13.35 335,828
2 + – – 6.45 296,133 14.03 337,212
3 – + – 6.73 299,077 10.72 340,197
4 + + – 5.76 300,580 12.77 341,685
5 – – + 3.86 866,390 5.92 989,597
6 + – + 2.25 870,427 4.48 993,630
7 – + + 1.85 872,569 1.84 995,808
8 + + + 0.29 876,823 0.39 1,000,052
9 0 0 0 2.10 585,372 3.63 667,544
10 – 0 0 4.02 583,343 5.22 665,507
11 0 – 0 3.63 585,373 7.21 667,544
12 0 0 – 5.87 298,222 11.57 339,332
13 + 0 0 2.09 586,166 4.15 668,320
14 0 + 0 1.41 585,372 2.03 667,544
15 0 0 + 0.69 872,359 1.10 995,592
aN is relative to FFD 1: levels (–), (0) and (+) correspond to 2, 4 and 6 stages, respectively.
Figure 4. Normal probability plots for FFD 1 (negligible effects are enclosed in borders).
case 2 (minima of xS/F with respect to xT for xN = 1 on the wBFFA < 0.5% contour curves see Figure 6). In terms
of the original units, the above conditions are (T, N, S/F) = (321 K, 6 stages, 1.27 kg/kg) and (T, N, S/F) = (318 K, 6 stages, 1.30 kg/kg) for cases 1 and 2, respectively.
Figure 5. Observed and predicted values. Table 6. Fitted models for FFD 1a.
Case Model R2 MS
r
1 . . . .
. .
w x x x
x x
2 301 0 6878 0 8739 0 7403 2 312 / 1 099 /
FFA B
T T N
S F S F
2 2
= - +
-- +
{
(3) 0.9718 0.24
. .
C=0 5849+0 2870xS F/
{ (4) 0.9999 6.45 × 10⁻⁶
2
. . . .
. . .
.
w x x x
x x x x
x x
3 788 0 8565 1 724 0 7941 4 871 2 509 0 7061
0 5356
/ / /
/
FFA B
T N N S F S F T S F
N S F
2 2
2
= + - +
- +
-{
(5) 0.9896 0.47
. .
C=0 6670+0 3280xS F/
{ (6) 0.9999 6.50 × 10⁻⁶
aThe total cost in the first year of operation (C{) is given as 106 $/yr.
in Table 6, were $739,833/yr for case 1 and $860,571/ yr for case 2.
To assess if the technical benchmark (wFFAB ≤ 0.5%)
could be satisfied by the rigorously modeled process,
new simulations were run in Aspen under the optimal conditions predicted by the models in Table 6. For case
1, a mass fraction of 0.41% was obtained for wFFAB , thus
satisfying the required specification. For case 2, however,
it was necessary to increase slightly the S/F ratio to 1.32
to meet the specification, resulting in wFFAB = 0.49%. The
corresponding costs were then calculated as $742,143/yr for case 1 and $899,049/yr for case 2. On the basis of a ROF
costs (raw material cost not included) can be expressed as $84.93/ton and $102.89/ton for cases 1 and 2, respectively.
The optimal design and operation conditions determined above both satisfy technical (wFFAB ≤
0.5%) and economic (minimum cost) criteria for the
separation of FFA from ROF. However, for both cases 1 and 2, the optimal condition was located at N = 6 stages. In order to investigate further if a number of
stages greater than 6 could significantly shift the
optimal point, a new factorial design was carried out over an extended range of N while preserving the previous levels for T and S/F , according to Table 1.
Results for the new 23 FFD (FFD 2) are presented in
Table 7 (lines 1-9, including a central point) and extra computational experiments to complete a CCD (CCD 2, lines 10-15 in Table 7). For both cases 1 and 2, the same trend obtained in the FFD 1 was observed again:
only the linear effect of S/F was significant for the total
cost responses; and, a test on the wFFAB responses showed
significant curvatures, suggesting again quadratic models.
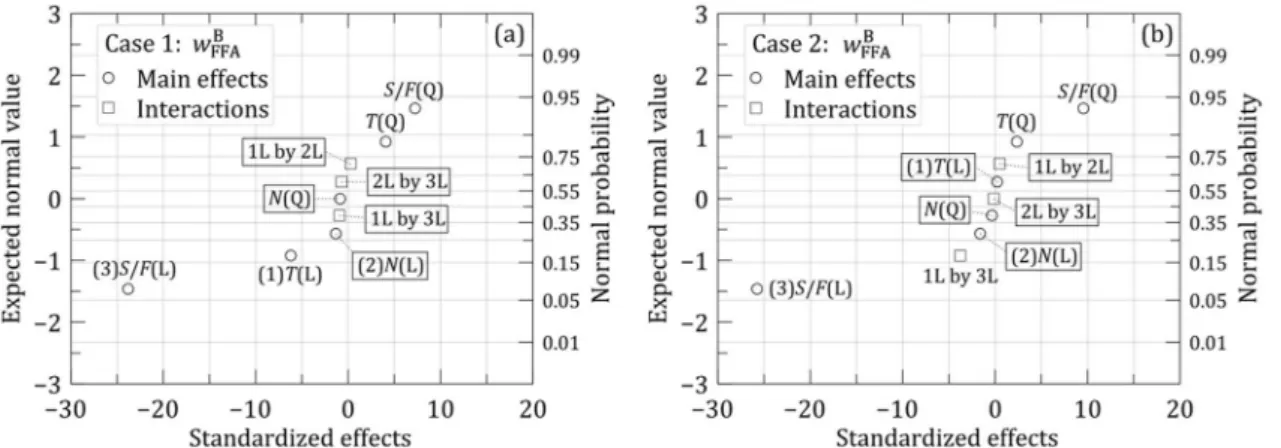
However, contrary to FFD 1, the number of stages did not
affect the wFFAB response significantly, for both cases 1 and
2, as shown in Figure 7 and in Table 8, thus, indicating that N = 6 stages, as discussed above, is acceptable as the optimal condition. This conclusion is in agreement with Albuquerque et al. (2016) who observed that wBFFA is not
considerably affected by increasing the number of stages above five.
As mentioned before, similar studies using methanol as the solvent were not found in the literature. There are, however, extraction studies using ethanol and
ethanol/water mixtures as solvents for the refining of
edible oils with considerably lower FFA concentrations (Pina and Meirelles, 2000; Batista et al., 2002).
Figure 6. Contour plots for wFFAB at N = 6 stages ( N = 1).
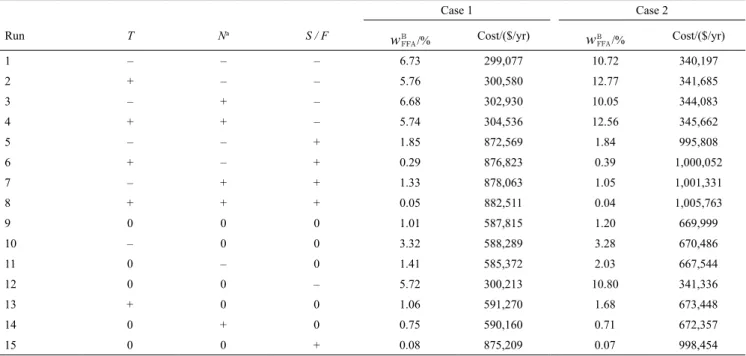
Table 7. Values of wFFAB and total cost responses obtained from FFD 2 and CCD 2.
Case 1 Case 2
Run T Na S / F
wFFAB /% Cost/($/yr) wFFAB /% Cost/($/yr)
1 – – – 6.73 299,077 10.72 340,197
2 + – – 5.76 300,580 12.77 341,685
3 – + – 6.68 302,930 10.05 344,083
4 + + – 5.74 304,536 12.56 345,662
5 – – + 1.85 872,569 1.84 995,808
6 + – + 0.29 876,823 0.39 1,000,052
7 – + + 1.33 878,063 1.05 1,001,331
8 + + + 0.05 882,511 0.04 1,005,763
9 0 0 0 1.01 587,815 1.20 669,999
10 – 0 0 3.32 588,289 3.28 670,486
11 0 – 0 1.41 585,372 2.03 667,544
12 0 0 – 5.72 300,213 10.80 341,336
13 + 0 0 1.06 591,270 1.68 673,448
14 0 + 0 0.75 590,160 0.71 672,357
15 0 0 + 0.08 875,209 0.07 998,454
Figure 7. Normal probability plots for FFD 2 (negligible effects are enclosed in borders). Table 8. Fitted models for FFD 2a.
Case Model R2 MS
r
1 . . . .
.
w x x x
x
1 167 0 7032 0 8602 2 702 1 567
/
/
FFA B
T T S F S F
2
2
= - +
-+
{
(7) 0.9878 0.11
. .
C=0 5890+0 2878xS F/
{ (8) 0.9999 7.40 × 10⁻⁶
2 . . . .
.
w x x x
x x
1 410 0 9235 5 352 3 881 0 8803
/
/
FFA B
T S F T S F
2 2
/
S F
= - - +
-{
(9) 0.9903 0.35
. .
C=0 6712+0 3288xS F/
{ (10) 0.9999 7.43 × 10⁻⁶
a The total cost in the first year of operation (C{) is given as 106 $/yr.
Although these authors demonstrated that it was possible to attain wFFAB < 0.5%, in general, this required
a higher number of stages with S/F ratios varying from 1.27 to 2. According to Mohsen-Nia and Khodayari (2008), methanol presents selectivities from 2.5 to 4 times higher than ethanol for oleic acid extraction
from sunflower oil. In addition, the higher the water concentration, the more difficult the FFA separation
becomes (Batista et al., 2002; Rodrigues et al., 2007). As a result, methanol presented better extraction properties than ethanol and ethanol/water mixtures requiring fewer stages and lower S/F ratios.
CONCLUSIONS
The technical and economic feasibility of the separation of FFA from a ROF using LLEx with methanol as the solvent was investigated using RSM for two cases of typical FFA contents found in yellow and brown greases. All variables studied (T, N and
S/F) showed significant effects on the wFFAB response.
On the other hand, for both cases, the total cost
response was only significantly affected by the linear effect of the S/F ratio. As a result, a trade-off between
wFFA B
≤ 0.5% and minimum total cost in the first year of
operation was adopted to obtain the optimal condition, since an increase in the S/F entails a decrease in the
wFFAB value while increasing the total cost. Therefore,
optimal design and operation conditions were T = 321 K, N = 6 stages and S/F = 1.27 for case 1; and T = 318 K, N = 6 stages and S/F = 1.32 for case 2. Under these conditions, process simulation indicated that the
technical specification can be satisfied, resulting in a
wFFAB value of 0.41% for case 1 and 0.49% for case 2.
The associated costs were $742,143/yr for case 1 and
$899,049/yr for case 2. The corresponding specific costs for a ROF feed flow rate of 1050 kg/h and a plant operation factor of 95% (8322 h per year) were $84.93/
ton and $102.89/ton for cases 1 and 2, respectively. The above minimum costs do not include raw material (ROF) costs as already pointed out.
ACKNOWLEDGMENTS
The authors acknowledge FACEPE/NUQAAPE,
INCTAA, CNPQ and FINEP for financial support. A.
NOMENCLATURE
Aij - NRTL binary interaction parameter (K) A( )ij
0 - Coefficient in the NRTL binary interaction parameter equation (K)
A( )
ij
1 - Coefficient in the NRTL binary interaction parameter equation
C - Total cost in the first year of operation (106 $/yr) F - Objective function (see equation 1)
M - Molar mass (g/mol) MSr - Residual mean square
N - Number of stages
Nc - Number of components
ND - Number of data sets
Nt - Number of tie lines
R2 - Coefficient of determination S/F - Solvent to feed mass ratio
T - Temperature (K)
w - Mass fraction (%)
wFFAB - FFA mass fraction (solvent free) in the
oil-rich output bottom stream of the extraction column
(%)
xN - Number of stages value (coded value)
xS/F - Solvent to feed mass ratio value (coded value)
xT - Temperature value (coded value)
Greek Symbols
αij - NRTL non-randomness parameter
β - Distance of each axial point (also called star point) from the center
Subscripts
FFA - Free fatty acid
i - i-th component
j - j-th experimental LLE tie line
k - k-th data set
N - Number of stages
S/F - Solvent to feed mass ratio
T - Temperature
Superscripts
B - Bottom output stream of the extraction column cal - Calculated
exp - Experimental
I,II - Liquid phases in equilibrium
l - l-th phase
Abbreviations
CCD - central composite design
CEPCI - Chemical Engineering's Plant Cost Index CF - Constituent Fragments
CnO - canola oil
CO - corn oil
ECF - Extended Constituent Fragments FFA - free fatty acid
FFD - full factorial design JO - jatropha curcas oil L - linoleic
Ln - linolenic
LLE - liquid-liquid equilibrium LLEx - liquid-liquid extraction LLL - trilinolein
M - methanol
NRTL - Non-Random Two-Liquid O - oleic
OA - oleic acid P - palmitic
RDC - rotating disk contactor RMSD - root mean square deviation ROF - residual oil and fat
RSM - response surface methodology S - stearic
SuO - sunflower oil
TAG - triacylglycerol
REFERENCES
Adewale, P., Dumont, M.-J. and Ngadi, M., Recent trends of biodiesel production from animal fat wastes and associated production techniques, Renew. Sust. Energ. Rev., 45 574-588 (2015). Albuquerque, A.A., Danielski, L. and Stragevitch,
L., Techno-economic assessment of an alternative process for biodiesel production from feedstock containing high levels of free fatty acids, Energy & Fuels, 30 (11) 9409-9418 (2016).
Antoniosi Filho, N.R., Mendes, O.L. and Lanças, F. M, Computer Prediction of Triacylglycerol Composition of Vegetable Oils by HRGC, Chromatographia, 40 557-562 (1995).
Avhad, M.R. and Marchetti, J.M., A review on recent advancement in catalytic materials for biodiesel production, Renew. Sust. Energ. Rev., 50 696-718 (2015).
Batista, E., Monnerat, S., Kato, K., Stragevitch, L. and Meirelles, A.J., Liquid-liquid equilibrium for systems of canola oil, oleic acid, and short-chain alcohols, J. Chem. Eng. Data, 44, No. 6, 1360-1364 (1999a).
Batista, E., Wolf Maciel, M.R. and Meirelles, A.J.A.,
Simulation of the Deacidification of Vegetable Oil
and Optimisation for Energy Saving and Pollution Reduction. Budapest, Hungary (1999b).
Batista, E., Antoniassi, R., Wolf Maciel, M.R. and Meirelles, A.J.A., Liquid-liquid extraction for
deacidification of vegetable oils. Proceeding of
International Solvent Extraction Conference. South Africa (2002).
Bhosle, B. and Subramanian, R., New approaches in
deacidification of edible oils--a review, J. Food
Eng., 69, No. 4 481-494 (2005).
Bruns, R.E., Scarminio, I.S. and de Barros Neto, B., Statistical Design - Chemometrics. Elsevier, Campinas (2006).
Cai, Z.-Z., Wang, Y., Teng, Y.-L., Chong, K.-M., Wang, J.-W., Zhang, J.-W. and Yang, D.-P., A two-step biodiesel production process from waste cooking
oil via recycling crude glycerol esterification
catalyzed by alkali catalyst, Fuel Process. Technol., 137 186-193 (2015).
Canakci, M. and Sanli, H., Biodiesel production from
various feedstocks and their effects on the fuel
properties, J. Ind. Microbiol. Biot., 35, No. 5 431-441 (2008).
Canakci, M. and Van Gerpen, J., Biodiesel production from oils and fats with high free fatty acids, Transactions of the ASAE, 44, No. 6, 1429 (2001). Ceriani, R., Paiva, F.R., Goncalves, C.B., Batista,
E.A. and Meirelles, A.J., Densities and viscosities of vegetable oils of nutritional value, J. Chem. Eng. Data, 53, No. 8 1846-1853 (2008).
Cruz-Forero, D.-C., González-Ruiz, O.-A. and López-Giraldo, L.-J., Calculation of thermophysical properties of oils and triacylglycerols using an extended constituent fragments approach, Ciencia, Tecnología y Futuro, 5, No. 1 67-82 (2012).
Gnanaprakasam, A., Sivakumar, V.M., Surendhar, A., Thirumarimurugan, M. and Kannadasan, T., Recent strategy of biodiesel production from waste
cooking oil and process influencing parameters: a
review, J. Energy, 2013, (2013).
Iasmin, M., Dean, L.O., Lappi, S.E. and Ducoste, J.J.,
Factors that influence properties of FOG deposits
and their formation in sewer collection systems, Water Res., 49 92-102 (2014).
Jorge, N., Soares, B.B.P., Lunardi, V.M. and Malacrida, C.R., Physico-chemical alterations of
sunflower, corn and soybean oils in deep fat frying
(in portuguese), Quim. Nova, 28, No. 6, 947 (2005). Liu, Y., Lu, H., Liu, C. and Liang, B., Solubility
Measurement for the Reaction Systems in
Pre-Esterification of High Acid Value Jatropha curcas L.
Oil, J. Chem. Eng. Data, 54, No. 5 1421-1425 (2008).
Ma, F. and Hanna, M.A., Biodiesel production: a review, Bioresour. Technol., 70, No. 1 1-15 (1999). Mohite, S., Kumar, S., Pal, A. and Maji, S., Biodiesel
Production from High Free Fatty Acid Feed
Stocks through Transesterification. International
Conference of Advance Research and Innovation (ICARI). New Delhi (2015).
Mohsen-Nia, M. and Dargahi, M., Liquid-liquid equilibrium for systems of (corn oil+ oleic acid+ methanol or ethanol) at (303.15 and 313.15) K, J. Chem. Eng. Data, 52, No. 3 910-914 (2007).
Mohsen-Nia, M. and Khodayari, A., De-acidification of sunflower oil by solvent extraction:(Liquid+ liquid)
equilibrium data at T=(303.15 and 313.15) K, J. Chem. Thermodyn., 40, No. 8 1325-1329 (2008). Morad, N.A., Kamal, A.M., Panau, F. and Yew, T.,
Liquid specific heat capacity estimation for fatty
acids, triacylglycerols, and vegetable oils based on their fatty acid composition, J. Am. Oil Chem. Soc., 77, No. 9 1001-1006 (2000).
Noureddini, H., Teoh, B. and Clements, L.D., Densities of vegetable oils and fatty acids, J. Am. Oil Chem. Soc., 69, No. 12 1184-1188 (1992).
Ortner, M.E., Müller, W., Schneider, I. and Bockreis, A.,
Environmental assessment of three different utilization
paths of waste cooking oil from households, Resour. Conserv. Recy., 106 59-67 (2016).
Perry, E., Weber, W. and Daubert, B., Vapor pressures of phlegmatic liquids. I. Simple and mixed triglycerides, J. Am. Chem. Soc., 71, No. 11 3720-3726 (1949).
Pina, C.G. and Meirelles, A.J., Deacidification of
corn oil by solvent extraction in a perforated rotating disc column, J. Am. Oil Chem. Soc., 77 553-559 (2000).
Refaat, A., Different techniques for the production of
biodiesel from waste vegetable oil, Int. J. Environ. Sci. Tech., 7, No. 1 183-213 (2010).
Renon, H. and Prausnitz, J.M., Local compositions in thermodynamic excess functions for liquid mixtures, Aiche J., 14, No. 1 135-144 (1968). Rodrigues, C.E., Gonçalves, C.B., Batista, E. and
Meirelles, A.J., Deacidification of vegetable oils by
solvent extraction, Recent Pat. Eng., 1, No. 1 95-102 (2007).
Seader, J.D., Henley, E.J. and Roper, D.K., Separation process principles: chemical and biochemical operations. John Wiley & Sons, USA (2011).
Stragevitch, L. and d’Avila, S., Application of a generalized maximum likelihood method in the reduction of multicomponent liquid-liquid equilibrium data, Braz. J. Chem. Eng., 14, (1997).
Tsoutsos, T.D., Tournaki, S., Paraíba, O. and Kaminaris, S.D., The Used Cooking Oil-to-biodiesel chain in Europe assessment of best practices and environmental performance, Renew. Sust. Energ. Rev., 54 74-83 (2016).
Vaisali, C., Charanyaa, S., Belur, P.D. and Regupathi,
I., Refining of edible oils: a critical appraisal of
current and potential technologies, Int. J. Food Sci. Tech., 50, No. 1 13-23 (2015).
Van Gerpen, J., Biodiesel processing and production, Fuel Process. Technol., 86, No. 10 1097-1107 (2005). Zhang, Y., Dube, M., McLean, D. and Kates, M.,
Biodiesel production from waste cooking oil: 1. Process design and technological assessment, Bioresour. Technol., 89, No. 1 1-16 (2003).