DOI: 10.5935/2359-4802.20180017
ORIGINAL ARTICLE
Mailing Address: Marcos Antonio Almeida-Santos
Avenida Gonçalo Prado Rollemberg, 211, sala: 210. Postal Code: 49010-410, São José, Aracaju, SE - Brazil. E-mail: [email protected], [email protected]
Spatial Analysis and Mortality Trends Associated with Hypertensive Diseases in the
States and Regions of Brazil from 2010 to 2014
Marcos Antonio Almeida-Santos, Beatriz Santana Prado, Deyse Mirelle Souza Santos
Programa de Pós-graduação em Saúde e Ambiente da Universidade Tiradentes, Aracaju, SE - Brazil
Manuscript received June 09, 2017, revised manuscript October 20, 2017, accepted December 19, 2017.
Abstract
Background: Systemic Arterial Hypertension (SAH) represents the most relevant worsening factor and one of the major risk factors for cardiovascular diseases.
Objectives: To analyze trends in the mortality rate associated with hypertensive diseases in Brazil from 2010 to 2014, for states as well as regions.
Methods: An epidemiological study was performed from aggregate data obtained in populational strata. Cartographic data of the Brazilian territory in "shapefile" were provided by IBGE. Records of mortality associated with arterial hypertension were obtained in DATASUS, through notifications filtered by category I.10 of the International Classification of Diseases (ICD-10). The criterion of statistical significance was a two-tailed p-value < 0.05.
Results: The increase in age was progressively associated with an increase in the mean number of deaths related to hypertensive diseases between the years 2010 and 2014. In the age groups between 50-59 years, 60-69 years, 70-79 years and 80 or more years, the mean and standard deviation for the mortality rate were, respectively: 15.11% (35.35); 24.14% (55.34); 35.07% (81.03) and 57.87% (139.08). The overall mortality rate per 10,000 inhabitants varied between the regions: north (1.25); northeast (2.69); center-west (2.06); southeast (2.48) and south (2.04).
Conclusions: The mortality rate associated with hypertensive diseases was higher in the southeastern and northeastern states of Brazil, and remained stable between 2010 and 2014. Increased age and brown color were predictors of higher mortality. (International Journal of Cardiovascular Sciences. 2018;31(3)250-257)
Keywords: Cardiovascular Diseases / mortality; Hypertension / epidemiology; Hypertension / etiology; Ethnicity and Health; Stroke; Epidemiologic Studies.
Introduction
Cerebrovascular diseases have been classified among those with the greatest impact in terms of morbimortality.1 Among the major cardiovascular risk factors, systemic arterial hypertension (SAH) represents the most relevant worsening factor, requiring health actions in order to minimize the factors of impact that are determinant for the populations’ health.2
The global prevalence of arterial hypertension was 22%, in 2014, in adults aged 18 years and over.3 SAH is
characterized by increased blood pressure levels (≥ 140
and/or 90 mmHg), in which the clinical condition can be
caused by several reasons and may be worsened by other risk factors, such as dyslipidemia, abdominal obesity, glucose intolerance, diabetes mellitus (DM), in addition to other modifiable factors, socioeconomic determinants and inadequate access to health care.3,4
Several studies point to the influence of ethnic aspects in the emergence of hypertensive diseases.5 Often it is difficult to dissociate the role represented by an ethnic group of the socioeconomic factors simultaneously active.6 In Brazil, cerebrovascular mortality rates were higher in black people, followed by brown and white people.7
contributes direct or indirectly to 50% of deaths due to cardiovascular diseases (CVD).4 In low- and medium-income countries, where treatment and control are lower than in developed countries, it is estimated that the prevalence of HBP-related diseases is of about 80%.8 The impact of this illness reflects in high costs for the Brazilian Unified National Health System (SUS), with an annual treatment cost of approximately US$ 398.9 million, that is, about 1.43% of overall healthcare expenditures.9
The objective of this research is to estimate the impact of arterial hypertension in the Brazilian territory in a period of five years. For such purpose, we analyzed trends in mortality rates associated with hypertensive diseases in Brazil, between 2010 and 2014, stratified according to skin color and age group, both for states and regions.
Methods
An epidemiological study was performed from aggregate data obtained in population strata and combined with a spatial analysis.
Data regarding the organization of the Brazilian territory, including the coordinates and the estimated population for the years studied, were taken from the Brazilian Institute of Geography and Statistics (IBGE) website in shapefile format.10,11
Epidemiological information regarding mortality due to arterial hypertension was obtained from the Ministry of Health database, DATASUS.12 These data refer to notifications from the Mortality Data System (SIM).13 Deaths were filtered by category I.10 of the International Classification of Diseases (ICD-10). Then, the aggregate data were obtained per year, state, sex, age and skin color.
The selection of the analysis period, between 2010 and 2014, occurred due to the following reasons. First, because we consider that more recent analysis provides greater reliability in data collection, due to progressive improvements in the process of computerization with technological advances. Second, because it potentially portrays the transition scenario resulting from the introduction of losartan, an effective antihypertensive drug, which has been distributed free of charge by the “Popular Pharmacy Program” since 2010, and became in 2014 the most demanded medication in units of the Unified Health System (SUS), including in the countryside of Brazil.14,15
However, one must consider that the program’s effect may occur unevenly across the regions, which would potentially influence the analysis. Finally, the end of the
period under consideration, the year of 2014, arose from the fact that it is the most recent date available in DATASUS to obtain vital statistics all over the Brazilian territory.
The selected variables were year, sex, age, skin color, state, region and number of deaths. Since it is a chronic illness, the selected age groups used to calculate the rate of mortality associated with arterial hypertension were as follows: 50-59 years; 60-69 years; 70-79 years; 80 or more years. This calculation was computed for the twenty-six Brazilian states and the Federal District. The variable “skin color” basically portrays the skin color and ethnic traits, based on the death certificate data, and may be classified as “white”, “yellow”, “brown”, “black”, “indigenous” or “ignored”.
Statistical analysis
The categorical variables were presented as absolute number and percentage. The numerical variables were presented as average and standard error. Regression models (Poisson and negative binomial) for analyzing countable data have been used in longitudinal studies to estimate future mortality rates. Due to overdispersion, negative binomial regression was preferred. The estimate of the “effect size” was adjusted to sex, age groups, skin color, country region and year, and presented in the form of incidence rate ratio (IRR) and confidence intervals at 95%.
In order to minimize distortions resulting from spatial and temporal differences between the populations, random-effect models included annual population estimates for each state as an “exposition” factor, that is, the coefficient was restricted, producing an IRR equal to 1, with standard error (virtually) zero, adjusting the calculation for the other coefficients. In order to select the model that provides the best predictive adequacy, the Akaike information criterion (AIC) was used. For the spatial analysis, the “spmap” command was used to draw choropleth maps containing the Brazilian states and the Federal District, and representing the distribution of mortality rates associated with arterial hypertension in quintiles. Statistical significance was considered as a two-tailed p value < 0.05. The statistical calculations and the spatial analysis were conducted in Stata, version 14.2 (College Station, Texas, USA).
Ethnical aspects
Results
The progressive increase in age was associated with an increase in the mean number of deaths related to hypertensive diseases between the years 2010 and 2014. In the age groups between 50-59 years, 60-69 years, 70-79 years and 80 or more years, the mean and standard deviation for the mortality rate were, respectively: 15.11% (35.35); 24.14% (55.34); 35.07% (81.03) and 57.87% (139.08).
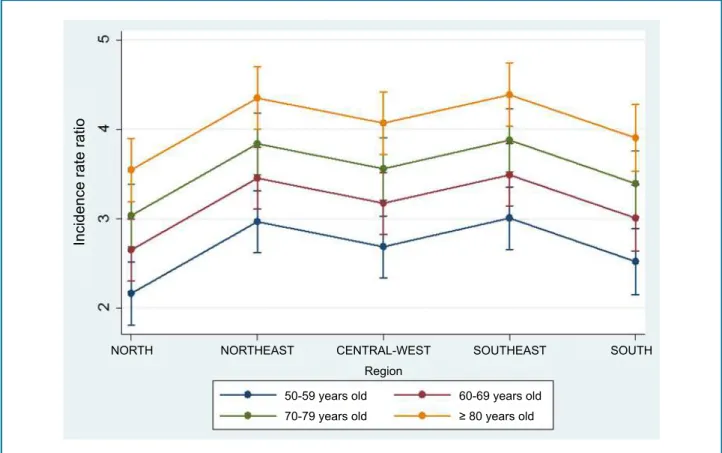
In the graphic representation of the binomial regression model extended to longitudinal data (Figure 1), adjusted to age, higher incidence rate ratios can be observed in the southeast and northeast regions, compared to the south, north and center-west regions.
According to IBGE’s population estimates for each year and state,11 the global mortality rate related to hypertensive diseases was calculated per 10,000 inhabitants, between 2010 and 2014, which varied between regions: north (1.25); northeast (2.69); center-west (2.06); southeast (2.48) and south (2.04). Table 1 shows the numbers per year and region.
It is possible to observe clearly, on the map of Brazil, the regions with the highest mortality rates related to hypertensive diseases in the year of 2014, as well as the regions with the lowest rates (Figure 2).
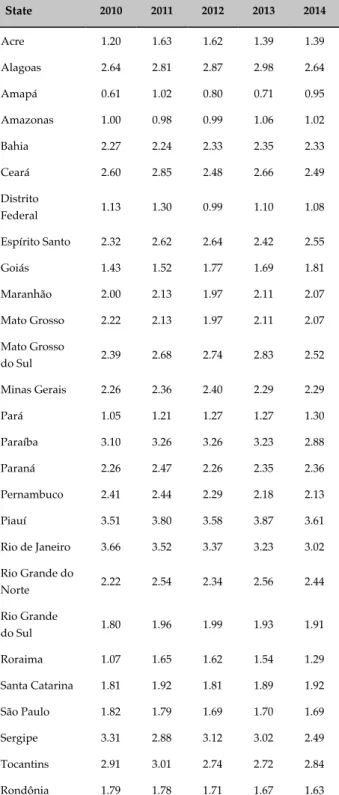
The analysis per state showed that Rio de Janeiro had the highest mean, with 3.66% of deaths associated with hypertensive diseases in the year of 2010, progressively decreasing until the year 2014, with a mean of 3.02% in that same year. On the other hand, in the years 2011, 2012, 2013 and 2014, the state of Piauí had the highest death average compared to the other states, with 3.80%, 3.58%, 3.87% and 3.61%, respectively (Table 2). The highest death rates occurred in the southeastern and northeastern regions of Brazil.
In the period of 2010 to 2014, The Federal District presented mortality rates similar to the state of Goiás, except for the year 2012, which showed one of the lowest death rates in the country.
A predictive model for fatality rates was estimated (Table 3). There were no sex differences in mortality, when adjusted to the other predictors. In relation to the
Figure 1 - Graphical representation of the binomial regression model extended for longitudinal data, with incidence rate ratio adjusted to age group and in accordance with Brazilian regions, in the period from 2010 to 2014.
Incidence rate ratio
NORTH NORTHEAST CENTRAL-WEST SOUTHEAST SOUTH Region
50-59 years old 70-79 years old
60-69 years old
Table 1 - Annual mortality rate associated with hypertensive diseases in Brazil, adjusted to 10,000 inhabitantes (average and standard error), between 2010 and 2014
Year
North Northeast Central-West Southeast South
Deaths SE Deaths SE Deaths SE Deaths SE Deaths SE
2010 1.12 0.02 2.67 0.02 2.02 0.04 2.52 0.05 1.96 0.02
2011 1.38 0.02 2.77 0.02 2.11 0.05 2.57 0.05 2.12 0.02
2012 1.31 0.02 2.02 0.02 2.09 0.04 2.52 0.04 2.02 0.02
2013 1.17 0.03 2.77 0.03 2.09 0.04 2.41 0.04 2.06 0.02
2014 1.26 0.01 2.56 0.02 2.03 0.04 2.39 0.03 2.06 0.02
SE: standard error.
Figure 2 - Choropleth map of Brazil, referring to deaths per 10,000 inhabitants associated with hypertensive disease, in the year 2014.
Mortality associated with arterial hypertension
Brazilian States, in 2014
Deaths/10,000 inhabitants
Table 2 - Average of deaths related to hypertensive diseases per 10,000 inhabitants in each Brazilian state, between 2010 and 2014
State 2010 2011 2012 2013 2014
Acre 1.20 1.63 1.62 1.39 1.39
Alagoas 2.64 2.81 2.87 2.98 2.64
Amapá 0.61 1.02 0.80 0.71 0.95
Amazonas 1.00 0.98 0.99 1.06 1.02
Bahia 2.27 2.24 2.33 2.35 2.33
Ceará 2.60 2.85 2.48 2.66 2.49
Distrito
Federal 1.13 1.30 0.99 1.10 1.08
Espírito Santo 2.32 2.62 2.64 2.42 2.55
Goiás 1.43 1.52 1.77 1.69 1.81
Maranhão 2.00 2.13 1.97 2.11 2.07
Mato Grosso 2.22 2.13 1.97 2.11 2.07
Mato Grosso
do Sul 2.39 2.68 2.74 2.83 2.52
Minas Gerais 2.26 2.36 2.40 2.29 2.29
Pará 1.05 1.21 1.27 1.27 1.30
Paraíba 3.10 3.26 3.26 3.23 2.88
Paraná 2.26 2.47 2.26 2.35 2.36
Pernambuco 2.41 2.44 2.29 2.18 2.13
Piauí 3.51 3.80 3.58 3.87 3.61
Rio de Janeiro 3.66 3.52 3.37 3.23 3.02
Rio Grande do
Norte 2.22 2.54 2.34 2.56 2.44
Rio Grande
do Sul 1.80 1.96 1.99 1.93 1.91
Roraima 1.07 1.65 1.62 1.54 1.29
Santa Catarina 1.81 1.92 1.81 1.89 1.92
São Paulo 1.82 1.79 1.69 1.70 1.69
Sergipe 3.31 2.88 3.12 3.02 2.49
Tocantins 2.91 3.01 2.74 2.72 2.84
Rondônia 1.79 1.78 1.71 1.67 1.63
Table 3 - Longitudinal analysis using a negative binomial model, having as dependent variable the number of deaths associated with hypertensive diseases, and as predictors “age group”, “sex”, “color”, “region” and “year”, adjusted to the annual population estimate for each location, between 2010 and 2014
Deaths IRR 95% CI p-value
Sex
Female (reference) - - -
-Male 1.03 0.99 1.08 0.158
Age group
50 – 59 years old
(reference) - - -
-60 – 69 years old 1.63 1.53 1.73 < 0.0001
70 – 79 years old 2.40 2.25 2.55 < 0.0001
≥ 80 years old 3.99 3.76 4.26 < 0.0001
Color
White (reference) - - -
-Black 0.27 0.25 0.29 < 0.0001
Brown 1.28 1.20 1.36 < 0.0001
Yellow 0.01 0.00 0.01 < 0.0001
Indígenous 0.01 0.01 0.01 < 0.0001
Ignored 0.13 0.12 0.14 < 0.0001
Region
Southeast (reference) - - -
-North 0.43 0.40 0.47 < 0.0001
Northeast 0.96 0.90 1.03 0.237
Central-West 0.73 0.67 0.78 < 0.0001
South 0.61 0.57 0.67 < 0.0001
Year
2010 (reference) - - -
-2011 106 0.99 1.14 0.112
2012 1.00 0.94 1.08 0.898
2013 0.96 0.90 1.03 0.267
2014 0.96 0.90 1.03 0.261
age groups, the greater the age, the greater the risk of death associated with systemic arterial hypertension. Skin color, taking “whites” as reference group, indicated greater association between hypertensive diseases and mortality in “browns”, and lower association in “blacks”, “yellows”, “indigenous” and in the cases in which this variable was “ignored”. It should be stressed that the total number of “indigenous” and “yellows” added to the “ignored” group corresponded to less than 6%. “Blacks” represented less than 12% of the “brown”, “white” and “black” groups, with the vast majority among the “whites”.
Since this is not an ethnical study, but still taking into account that skin color, as stated in the death certificate, has been considered a relevant data in the development of public health policies, the inclusion of this predictor has been less useful in producing racial inferences, than in adjusting this data to the other predictors and establishing iterative algorithms. In addition, it was observed that the models that include the variable “skin color”, compared to the models that exclude this predictor, in addition to presenting predictors with similar IRRs, also achieved convergence in less time and provided lower AIC values, which indicates higher adequacy from a statistical point of view.
Taking the southeast region as a reference, due to its highest development level and public policies applied for longer, there was no statistical difference compared to the northeast region, and the other regions presented a lower incidence rate ratio than the southeast Brazil.
The predictive model showed that there was no significantly statistical difference in the incidence rate ratio of mortality between the years, when adjusted to the other predictors. Similarly, sex differences had no influence. High-age group, brown skin and southeast and northeast regions were predictors of the greatest mortality during the period under study.
Discussion
An epidemiological study was carried out based on aggregate data, obtained in population strata. Therefore, in order to avoid the “ecological fallacy”, the applicability of the results cannot be extended to the individual level, to the doctor’s practice level, but only to state, regional and national levels.
Since the data were collected from public organizations, which, in turn, came from constant
notifications in death certificates, the outline of this article does not include methodological elements able to test their veracity. This also applies to the matter of item selection in the death certificates, which may potentially present differences related to preferences in each state or region to highlight, more or less often, hypertension as a relevant cause of death.
The number of deaths associated with hypertensive diseases is related with the increase in age, as can be observed in this study. The impact of this illness tends to aggravate, since the elderly population increases every year, corresponding nowadays to 15% of the world’s population. World projections indicate that this population will continue to increase, and it is estimated that this number may nearly double to 30% by the year 2050. This demands special attention to the development of measures that can help prevent and control hypertensive diseases.16
In another study, this time about the prevalence of arterial hypertension, the south and southeast regions of Brazil presented higher rates, compared to the other regions: 25% (95% CI: 23.8 - 26.1) and 25% (95% CI: 23.5 - 26.5), respectively.17 However, the present study focused on mortality rates associated with hypertensive diseases, and the regions with the highest rates were the northeast and the southeast. Although this issue is beyond the scope of the present research, it is speculated that the discrepancy between higher prevalence and lower mortality in the south could result from more intensive application of therapeutic strategies, both in health care and drug provision.
An opposite phenomenon could be observed in a northeastern state. This study showed that the state of Piauí presented, for four consecutive years, the highest mortality rate associated with hypertensive diseases. Nevertheless, a research conducted with elderly people in 2013, in the same state, indicated that the prevalence of SAH in this population is 40.2%, below than expected for that age group, whose prevalence is 68% among the population over 60 years of age.4,18 Once again, speculatively speaking, but still beyond the scope of this research, this finding could be a result of obstacles to health care and access to medications.
These considerations are mainly intended to formulate hypotheses that remain to be analyzed in future research.
compared to blacks, something that might have been influenced by eventual subjectivity in skin color identification and due to the predominance of miscegenation in Brazil.19 There are still few studies conducted in South America on the higher prevalence of arterial hypertension in blacks, with most scientific information concerning ethnicity coming from studies carried out in the United States.20
Several limitations arise from this type of study, which deals with aggregate data. For example, we cannot rule out the possibility of having occurred increased notifications, on the one hand, and hypertension control improvement, on the other hand, something that would generate an apparent constancy of the illness in the time series analysis of the data. However, from a methodological point of view, the research design sought to adjust the analysis for eventual influences of both temporal and geographic factors in the same region or state.
It is also important to highlight that we used the data considered more relevant for the elaboration of public policies nowadays, something that reflects in the planning, execution and evaluation of health actions towards the combat of the diseases of greatest impact in Brazil.21 Therefore, the implementation of Pharmaceutical Assistance by the Ministry of Health´s department has arisen as a major impact resource to reduce mortality due to non-transmitted chronic diseases, including arterial hypertension.9
Nevertheless, based on the information available on mortality associated with hypertensive diseases in public registries, and by submitting these data to a complex evaluation, corroborated by several analytical models, the absence of major reduction in mortality rates in the period of five years suggests that it is necessary, among other measures, to broaden the pharmacological scope of free distribution drugs and enhance healthcare programs.
Conclusion
Death rates associated with hypertensive diseases were higher in the southeastern and northeastern Brazil, compared to the other regions. This rate did not show significant alterations between the years 2010 and 2014, when assessed in relation to the same state and region of Brazil. Other predictors of higher rates of mortality were brown skin color and increase in age. Public health policies, concerning medical care for hypertensive patients and prevention of complications, must be preferably applied in the states with the highest rates.
Author contributions
Conception and design of the research: Santos MAA. Acquisition of data: Santos MAA. Analysis and interpretation of the data: Santos MAA. Statistical analysis: Santos MAA. Writing of the manuscript: Santos MAA, Prado BS, Santos DMS. Critical revision of the manuscript for intellectual content: Santos MAA, Prado BS, Santos DMS.
Potential Conflict of Interest
No potential conflict of interest relevant to this article was reported.
Sources of Funding
There were no external funding sources for this study.
Study Association
This study is not associated with any thesis or dissertation work.
Ethics approval and consent to participate
This article does not contain any studies with human participants or animals performed by any of the authors.
1. Guimarães RM, Andrade SS, Machado EL, Bahia CA, Oliveira MM, Jacques FV. Regional differences in cardiovascular mortality transition in Brazil, 1980 to 2012. Rev Panam Salud Publica. 2015;37(2):83-9.
2. Andrade SS, Rizzato S, Scalioni A, Landmann C, Malta DC. Self-reported hypertension prevalence in the Brazilian population: analysis of the National Health Survey, 2013. Epidemiol Serv Saúde. 2015;24(2):297-304.
3. World Health Organization (WHO). Global status report on noncommunicable diseases. Geneva; 2014.
4. Malachias MV, Souza WK, Plavnik FL, Rodrigues CI, Brandão AA, Neves MF, et al; Sociedade Brasileira de Cardiologia. 7a Diretriz Brasileira de hipertensão arterial. Arq Bras Cardiol. 2016;107(3 supl 3):1-83.
5. Thorpe RJ Jr, Bowie JV, Smolen JR, Bell CN, Jenkins ML Jr, Jackson J, et al. Racial disparities in hypertension awareness and management: are there differences among African Americans and Whites living in similar social and healthcare resource environments? Ethn Dis. 2014;24(3):269-75.
6. Judd SE, Kleindorfer DO, McClure LA, Rhodes JD, Howard G, Cushman M, et al. Self-report of stroke, transient ischemic attack, or stroke
This is an open-access article distributed under the terms of the Creative Commons Attribution License
symptoms and risk of future stroke in the reasons for geographic and racial differences in stroke (REGARDS) study. Stroke. 2013;44(1):55-60.
7. Lotufo PA, Bensenor IJ. [Race and stroe mortality in Brazil]. Rev Saude Publica. 2013;47(6):1201-4.
8. Chor D, Pinho Ribeiro AL, Sá Carvalho M, Duncan BB, Andrade Lotufo P, Araújo Nobre A, et al. Prevalence, awareness, treatment and influence of socioeconomic variables on control of high blood pressure: results of the ELSA Brasil Study. PLoS One. 2015;10(6):e0127382.
9. Oliveira PA, Menezes FG. Atenção farmacêutica a pacientes hipertensos. Revista Eletrônica de Farmácia. 2013;10(1):51-68.
10. Instituto Brasileiro de Geografia e Estatística. (IBGE). [Internet]. Organização do território, malhas territoriais e municipais em 2015 [Acesso em 2017 jan 20]. Disponível em: ftp://geoftp.ibge.gov.br/ organizacao_do_territorio/malhas_territoriais/malhas_municipais/ mun icipio_2015/Brasil/BR/.
11. Instituto Brasileiro de Geografia e Estatística. (IBGE). [Internet]. Estimativas da população residente no Brasil e unidades da federação com data de referência em 1º de julho de 2011. [Acesso em 2017 jan 20]. Disponível em: http://www.ibge.gov.br/home/estatistica/populacao/ estimativa2011/tab_Brasil_UF.pdf
12. Brasil. Ministério da Saúde [Internet]. Departamento de Informática do SUS. Datasus. Informações de Saúde. Estatísticas vitais. [Acesso em 2016 dez 10]. Disponível em: http://www2.datasus.gov.br/DATASUS/ index.php?area=0205.
13. Brasil. Ministério da Saúde. Sistema de Informações sobre Mortalidade – SIM. Consolidação da base de dados de 2011. Brasília; 2013.
14. Silva RM, Caetano R. “Farmácia Popular do Brasil” Program: characterization and evolution between 2004 and 2012. Cienc Saude Colet. 2015;20(10):2943-56.
15. Amorim ME, Ferreira MR, Oliveira SA, Fernandes CK. Programa Farmácia Popular no Brasil em uma drogaria de São Luís de Montes Belos (GO). Revista Faculdade Montes Belos (FMB). 2015;8(1):1-13.
16. Coelho Júnior HJ, Sampaio RA, Gonçalvez IO, Aguiar SS, Palmeira R. Cutoffs and cardiovascular risk factors associated with neck circumference among community-dwelling elderly adults: a cross-sectional study. Sao Paulo Med J. 2016;134(6):519-27.
17. Malta DC, Santos NB, Perillo RD, Szwarcwald CL. Prevalence of high blood pressure measured in the Brazilian population, National Health Survey, 2013. Sao Paulo Med J. 2016;134(2):163-70.
18. Oliveira Neto JG, Carvalho DA, Moura GG, Monteiro MM, Lopes KD, Martins MC. Pressão arterial e perfil socioeconômico de idosos atendidos na estratégia saúde da família de Floriano-Piauí. Rev Saúde Públ Santa Cat. 2014,7(2):17-28.
19. Menezes TN, Oliveira EC, Fischer MA, Esteves GH. Prevalence and control of hypertension in the elderly: a population study. Rev Port Saúde Pública. 2016;34(2):117-24.
20. Task Force of the Latin American Society of Hypertension. Guidelines on the management of arterial hypertension and related comorbidities in Latin America. J Hypertens. 2017;35(8):1529-45.