Dissertation
Master in Civil Engineering - Building Construction
Water Efficiency Analysis in the Classroom Building
and Hydraulics Laboratory of the Faculty of
Engineering, Physical Sciences and Mathematic –
Central University of Ecuador
Carlos Andrés Valenzuela Portilla
Dissertation
Master in Civil Engineering – Building Construction
Water Efficiency Analysis in the Classroom Building
and Hydraulics Laboratory of the Faculty of
Engineering, Physical Sciences and Mathematic –
Central University of Ecuador
Part of this work was presented at the conference: Valenzuela, Carlos; Gomes, Ricardo; Afonso, Armando; Rodrigues, Carla; Muñoz, Freddy. "Water Efficiency Evaluation Model in Non - Residential Buildings Case Study: University Buildings of Quito - Ecuador", in CIB W062 44th INTERNATIONAL SYMPOSIUM AUGUST 28th - 30th 2018, Ponta Delgada - Azores, Portugal.
Carlos Andrés Valenzuela Portilla
Dissertation developed under the supervision of Doctor Ricardo de Jesus Gomes, Professor at the School of Technology and Management of the Polytechnic Institute of Leiria and co-supervision of Doctor Armando B. Silva Afonso, full Professor at the University of Aveiro (retired) and Master Freddy Muñoz Tobar, Professor at the Faculty of Engineering, Physical Sciences and Mathematic of the Central University of Ecuador.
Dedication
To my beautiful wife, Karla… To my mother, Inés... To my father, Carlos.
Acknowledgements
I thank the Secretariat of Higher Education, Science, Technology and Innovation (Secretaría de Educación Superior, Ciencia, Tecnología e Innovación - SENESCYT) for the attribution of the individual master's scholarship (Contract No. AR2Q-000482-2016) and especially, I thank the Institute Polytechnic of Leiria for the shared knowledge and the support provided during the realization of this work. To its excellent Professors and Authorities.
My most sincere thanks to the “Associaçao Nacional para a Qualidade nas Instalações Prediais - ANQIP”, for its support in the execution of this work through the suggestions and recommendations for the application of the water efficiency calculation model in Ecuador.
I thank the scientific tutors of this thesis, Doctor Ricardo de Jesus Gomes, Professor at the School of Technology and Management of the Polytechnic Institute of Leiria and co-supervision of Doctor Armando B. Silva Afonso, full professor at the University of Aveiro (retired) in Portugal. To the tutor in Ecuador, Master of Science Freddy Muñoz Tobar, Professor at the Faculty of Engineering, Physical Sciences and Mathematics of the Central University of Ecuador. I thank you infinitely for your generosity, time and trust deposited; for your important suggestions and for sharing your valuable academic and work experience during the period of the research development. Thanks for your sincere friendship.
I want to thank Portugal, an exceptional country that welcomes foreign people with great kindness and hospitality. To the beautiful Leiria, which was my home for a year and that leaves me unforgettable memories.
I want to thank for the patience and love of my wife Karla, for her unconditional support and for her permanent dedication to me. To my parents, Inés and Carlos for their constant motivation, for their work and for their eternal love.
To God, for giving me this opportunity, the life and strength necessary to achieve this goal.
Resumo
O Equador, localizado no meio do mundo, é um dos menores países da América do Sul com o maior número de recursos de água doce superficiais e subterrâneas. O impacto global que afeta as reservas mundiais desse recurso natural também afeta os países da região devido ao acelerado crescimento populacional, às mudanças climáticas, ao obsoleto da tecnologia e à falta de hábitos sobre a necessidade de reduzir o consumo excessivo e o desperdício de bebida. agua.
A maior taxa de consumo de água potável entre os países da América do Sul é do Equador, com mais de 237 litros/(habitante.dia). Este número alarmante é uma das razões pelas quais é importante reduzir o consumo de água potável em edifícios não residenciais sem afetar o conforto dos usuários. O principal objetivo deste trabalho é analisar a eficiência hídrica de edifícios universitários em Quito através da aplicação do modelo de cálculo sugerido pela Associaçao Nacional para a Qualidade nas Instalaçoes Prediais - (ANQIP).
Diferentes estratégias e técnicas são aplicadas para cumprir este objetivo, entre elas, a caracterização arquitetônica e hidro-sanitária dos edifícios, a avaliação de cada dispositivo sanitário e sua eficiência hídrica, bem como a determinação de vazões volumétricas nas instalações dos edifícios. que fazem parte do estudo de caso.
A escassez gradual de água potável gera a necessidade de encontrar fontes alternativas para o fornecimento deste recurso. O projeto de um sistema de coleta de água da chuva se torna a solução integral proposta para fornecer água para usos não potáveis, reduzir o consumo de água potável, reduzir custos de faturamento e transformar edifícios em projetos hidraulicamente sustentáveis.
Conclui-se que os sistemas de captação de água da chuva fornecem volumes importantes de água para fins não potável em edifícios como estabelecimentos universitários.
Abstract
Ecuador, located in the middle of the world, is one of the smallest countries in South America with the largest number of surface and underground freshwater resources. The global impact that affects the world reserves of this natural resource, also affects the countries of the region due to an accelerated population growth, climate change, the obsoleting of technology and the shortage of habits about the need to reduce excessive consumption and waste of drinking water.
The highest rate of drinking water consumption among the countries of South America is from Ecuador, with more than 237 liters/(inhabitant.day). This alarming figure is one of the reasons why it is important to reduce drinking water consumption in non-residential buildings without affecting the comfort of users. The main objective of this work is to analyze the water efficiency of university buildings in Quito through the application of the calculation model suggested by the Portuguese Association for Quality in Building Services Installations (ANQIP).
Different strategies and techniques are applied to fulfill this objective, among them, the architectural and hydro-sanitary characterization of the buildings, the evaluation of each sanitary device and its water efficiency, as well as the determination of volumetric flows in the facilities of the buildings that form part of the case study.
The gradual shortage of drinking water generates the need to find alternative sources for the supply of this resource. The design of a rainwater harvesting system becomes the integral solution proposed to supply water for non-potable uses, to reduce consumptions of potable water, to reduce billing costs and to transform buildings into hydraulically sustainable projects.
It is concluded that rainwater harvesting systems provide important volumes of water for non-drinking purposes in buildings such as university establishments.
List of figures
Figure 1.1 – Water Reserves vs Current Population (2016) ... 3
Figure 1.2 – Availability of water in the World ... 5
Figure 1.3 – Fate of global freshwater withdrawals ... 6
Figure 1.4 – Water withdrawal and water consumption ... 6
Figure 1.5 - Total renewable water resources per capita, (2013) ... 7
Figure 1.6 - Tribunal Latinoamericano del Agua, (2017) ... 9
Figure 1.7 - Continental Ecuador... 10
Figure 1.8 - Hydrographic division of Ecuador ... 13
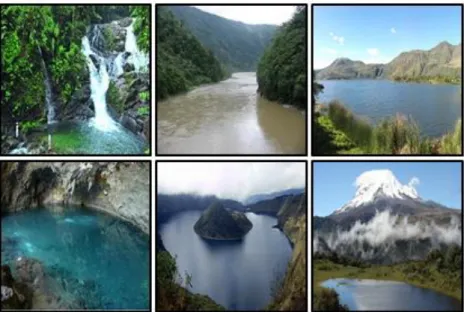
Figure 1.9 - Water potential of Ecuador ... 13
Figure 1.10 - Hydrographic Demarcations of Ecuador ... 15
Figure 1.11 - Consumptive water use in Ecuador ... 18
Figure 1.12 - Non- Consumptive water use in Ecuador ... 21
Figure 1.13 - Drinking water reserve tanks ... 23
Figure 1.14 - Water Consumption Indicators by EPMAPS - Quito ... 25
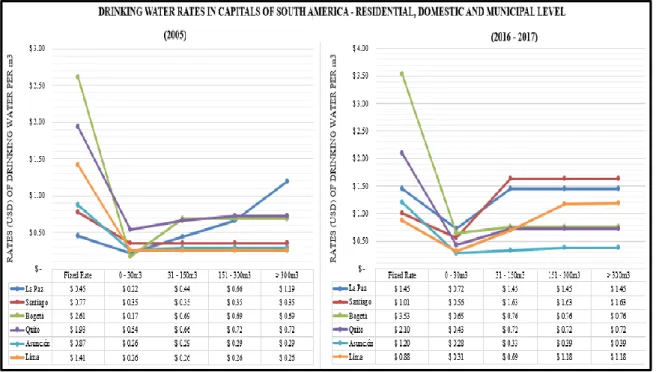
Figure 1.15 - Drinking water rates in capitals of South America ... 27
Figure 1.16 - Water at entry point system ... 29
Figure 1.17 - Index Variation of Unaccounted Water in Quito City per month ... 30
Figure 1.18 - Index of Unaccounted Water in Quito City per year ... 31
Figure 1.19 - Spatial distribution of water sources ... 33
Figure 1.20 - Area where hydraulic efficiency analysis would be applied ... 34
Figure 1.21. Floods in the areas near “Building A” ... 35
Figure 1.22. Methodology ... 38
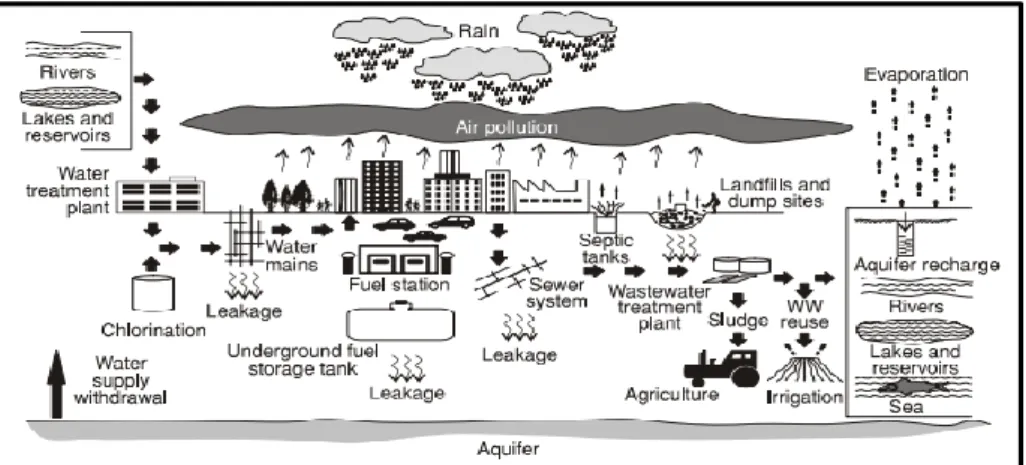
Figure 2.1 - Water Cycle ... 40
Figure 2.2 - Seawater Intrusions in Groundwater Phenomenon ... 42
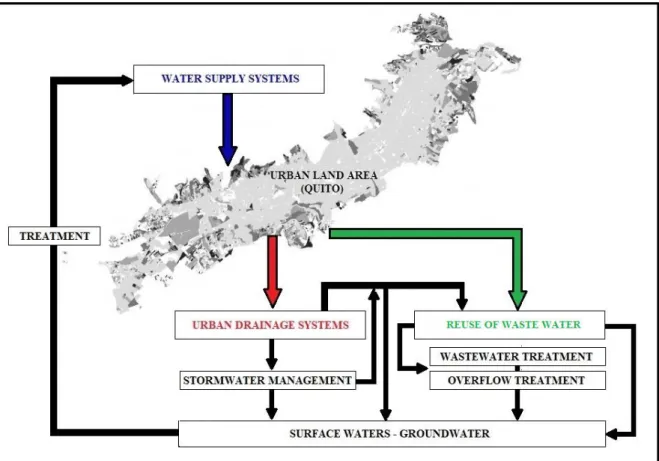
Figure 2.3 - The Urban Water Cycle shown pictorially ... 46
Figure 2.4 - Drinking, Recycled Water and Waste water ... 47
Figure 2.5 - Main Components of Urban Water Cycle ... 48
Figure 2.6 - Natural resources of water extraction ... 50
Figure 2.7 - Natural resources of water extraction ... 51
Figure 2.9 - Drinking Water Reservoirs in Quito ... 52
Figure 2.10 - Water Supply System Components ... 53
Figure 2.11 - Sewerage System Components ... 54
Figure 2.12 - Components in urban drainage system ... 56
Figure 2.13 - Components in urban drainage system ... 56
Figure 2.14 - U.W.C. modification by surface waterproofing (Before and After) ... 57
Figure 2.15 - Iterative Stages to develop site level drainage designs ... 58
Figure 2.16 - Coca Codo Sinclair Dam – Napo, Ecuador ... 60
Figure 2.17 - Dyke of Barcelona’s Port ... 61
Figure 2.18 - Urban Drainage System ... 62
Figure 2.19 - Artificial Retention Basin ... 62
Figure 2.20 - Green Roofs in Quito ... 63
Figure 2.21 - Natural storage - Multifunctional artificial storage (Skate Park) ... 64
Figure 2.22 - Infiltration Trench ... 65
Figure 2.23. Recovery of green spaces in Quito ... 65
Figure 2.24 - Models of Resilient Constructions ... 66
Figure 2.25 - Infiltration Wells ... 66
Figure 2.26 - Typical Detail of Permeable Pavements ... 67
Figure 2.27 - Urban Afforestation in Quito ... 67
Figure 2.28 - Living wall in the Mall of Quito ... 68
Figure 2.29 - Rainwater Harvesting system for Houses ... 69
Figure 2.30 - Rainwater Harvesting system for Buildings ... 69
Figure 2.31 - Policy of the 5 R's ... 70
Figure 2.32 - Distribution system for water supply in buildings ... 73
Figure 2.33 - Schematic Water Supply of a Building ... 76
Figure 2.34 - Detailed Components of Water Supply in a Building ... 77
Figure 2.35 - Schematic Components of Water Supply in a Building ... 77
Figure 2.36 - Lotic Water – Conventional Resources ... 79
Figure 2.37 - Lentic Water – Conventional Resources ... 79
Figure 2.38 - Underground Water – Conventional Resources ... 80
Figure 2.39 - Percentage of conventional water resources ... 80
Figure 2.40 - Rainwater Harvesting System ... 82
Figure 2.41 - Seawater Desalination Process ... 83
Figure 2.43 - Interventions made through the AUDITAQUA Program ... 90
Figure 2.44 - Buildings where water audits can be applied ... 91
Figure 2.45 - Efficient Toilets ... 95
Figure 2.46 - Efficient Urinals ... 96
Figure 2.47 - Efficient Devices for Showers ... 97
Figure 2.48 - Efficient Devices for Showers ... 100
Figure 3.1 - Examples of use around the world of Rainwater Harvesting Systems ... 104
Figure 3.2 - Summary of comparison between conventional and alternative water systems ... 108
Figure 3.3 - Stages in Rainwater Harvesting System ... 110
Figure 3.4 - Components of rainwater harvesting system ... 111
Figure 3.5 - Components of rainwater harvesting system ... 114
Figure 3.6 - First flush diverter ... 115
Figure 3.7 - Filtration Device ... 115
Figure 3.8 - Self-cleaning reserve operation scheme... 116
Figure 3.9 - Reservoir of first flush of rainwater with tank ... 116
Figure 3.10 - Different type of cisterns ... 117
Figure 3.11 - Different type of cisterns ... 118
Figure 3.12 - Potential Microbiological Hazards and Health Risks of RWH systems ... 124
Figure 3.13 - Methodology for the economic analysis of a RWH system ... 127
Figure 3.14 - Principles of LEED certification ... 131
Figure 4.1 - Faculty of Civil Engineering and University Citadel ... 137
Figure 4.2 - Structural configuration of the Classroom Building ... 138
Figure 4.3 - Classroom Building Facades... 139
Figure 4.4 - Structural configuration of the Hydraulics Laboratory ... 140
Figure 4.5 - Green areas close to the Classroom Building ... 141
Figure 4.6 - Rainwater collection surface on the top of the Classroom Building ... 142
Figure 4.7 - Rainwater collection surface on the top of the Hydraulics Laboratory ... 143
Figure 4.8 - Rainwater collection surface on the top of both buildings ... 143
Figure 4.9 – Hydraulics Laboratory and Classroom Building Roofs ... 144
Figure 4.10 – Hydraulics Laboratory and Classroom Building Roofs ... 144
Figure 4.11 - Levels of Classroom Building ... 146
Figure 4.14 - Second Floor of Classroom Building ... 149
Figure 4.15 - Third Floor of Classroom Building ... 150
Figure 4.16 - Fourth Floor of Classroom Building (Roof) ... 151
Figure 4.17 - Levels of Hydraulics Laboratory ... 152
Figure 4.18 - Lower Level Characterization ... 153
Figure 4.19 - First Floor of Hydraulics Laboratory ... 154
Figure 4.20 - Inaccessible Cover of the Hydraulics Laboratory ... 155
Figure 4.21 - Bathroom’s devices (Women) – Ground Floor ... 157
Figure 4.22 - Bathroom’s devices (Men) – Ground Floor ... 157
Figure 4.23 - Bathroom’s devices (Concierge) – Ground Floor ... 157
Figure 4.24 - Bathroom’s devices (Teacher’s bathroom) – Ground Floor ... 158
Figure 4.25 - Bathroom’s devices (Library Personnel) – First Floor ... 159
Figure 4.26 - Bathroom’s devices (Women) – Second Floor ... 160
Figure 4.27 - Bathroom’s devices (Men) – Second Floor ... 160
Figure 4.28 - Bathroom’s devices (Concierge) – Second Floor ... 160
Figure 4.29 - Bathroom’s devices (Women) – Third Floor ... 161
Figure 4.30 - Bathroom’s devices (Men) – Third Floor ... 162
Figure 4.31 - Teacher’s Bathroom – Hydraulics Laboratory ... 163
Figure 4.32 - Elevated Water Tank and Pumping System - Hydraulics Laboratory ... 163
Figure 4.33 - Average consumption of drinking water in Latin America ... 164
Figure 4.34 - Users of sanitary facilities by gender in the Classroom Building ... 167
Figure 4.35 - Percentage affects each use in the Classroom Building ... 167
Figure 4.36 - Internal use of water by fixture for the Classroom Building ... 168
Figure 4.37 - Users of sanitary facilities by gender in the Hydraulics Laboratory ... 169
Figure 4.38 - Percentage affects each use in the Hydraulics Laboratory ... 169
Figure 4.39 - Internal use of water by fixture for the Hydraulics Laboratory ... 170
Figure 4.40 - Materials to develop the traditional method of flow meter ... 177
Figure 4.41 - SpotOn® Irrigation Flow Meter used by the analysis of Water Efficiency 178 Figure 4.42 - Concrete surface for water collection according to the case study ... 189
Figure 4.43 - Green area for water collection according to the case study ... 190
Figure 4.44 - Roof water drainage in the buildings of the case study ... 194
Figure 4.45 - Scheme and operating process of the designed system ... 198
Figure 4.46 - Artificial Pond Architecture ... 207
Figure 4.48 - Self – cleaning reservoir ... 210
Figure 4.49 - 15m3 Rainwater Tank - Elevation View ... 212
Figure 4.50 - 15m3 Rainwater Tank – Top View ... 212
Figure 4.51 - Relative roughness 𝜀/𝐷 ... 215
Figure 4.52 - Moody’s diagram ... 216
List of tables
Table 1.1 - World Water Distribution ... 4
Table 1.2 – Fresh water availability compared to population ... 8
Table 1.3 – Fresh Water availability in Ecuador ... 11
Table 1.4 – Watersheds areas in Ecuador ... 12
Table 1.5 – Hydrographic Demarcations of Ecuador ... 14
Table 1.6 – Hydrographic Systems of Ecuador ... 16
Table 1.7 – Renewable water resources ... 17
Table 1.8 – Water extraction for consumptive uses ... 19
Table 1.9 – Hydroelectric growth in Ecuador ... 20
Table 1.10 – Irrigation Surface according to type ... 21
Table 1.11 – Systems that provide water for Quito ... 22
Table 1.12 – Volume of treated water in Quito ... 23
Table 1.13 – Distribution of drinking water in Quito ... 24
Table 1.14 – Comparison of Drinking Water Rates in Capitals of South America ... 26
Table 1.15 – Number of subsidized beneficiaries ... 28
Table 2.1. Dam’s advantages and disadvantages ... 60
Table 2.2. Certification and Labeling Systems ... 101
Table 4.3. Water Efficiency Labeling for Non Residential Buildings in Ecuador ... 102
Table 3.1 - Typical values of the Roughness Coefficient ... 112
Table 3.2 - Pipe diameter required according to average precipitation and area of the roof ... 113
Table 3.3 - LEED certification according water conservation points ... 132
Table 4.1 - Coordinates of Study Case ... 141
Table 4.2 - Distribution and use of the Classroom Building by areas ... 145
Table 4.3 - Distribution and use of the Hydraulics Laboratory by areas ... 152
Table 4.4 - Hydro sanitary characterization in the ground floor ... 156
Table 4.5 - Hydro sanitary characterization in the first floor ... 159
Table 4.6 - Hydro sanitary characterization in the second floor ... 159
Table 4.7 - Hydro sanitary characterization in the third floor ... 161
Table 4.9 - Classification of university buildings according to the consumption pattern 166
Table 4.10 - Water uses not included in the Classroom Building ... 170
Table 4.11 - Water uses not included in the Hydraulics Laboratory ... 171
Table 4.12 - Unit volumes for urinals ... 172
Table 4.13 - Unit volumes for washbasin faucets ... 173
Table 4.14 - Unit volumes for toilets ... 174
Table 4.15 - Comfort Factors for faucets ... 176
Table 4.16 - Characterization of Building Devices – Classroom Building ... 180
Table 4.17 - Water consumptions calculator – Classroom Building ... 181
Table 4.18 - Auxiliary table for calculating consumption in toilets ... 182
Table 4.19 - Auxiliary table for calculating consumption in bathroom faucets ... 183
Table 4.20 - Auxiliary table for calculating consumption in kitchen faucets ... 183
Table 4.21 - Auxiliary table for calculating consumption in urinals ... 184
Table 4.22 - Characterization of Building Devices – Hydraulics Laboratory ... 184
Table 4.23 - Water consumptions calculator – Hydraulics Laboratory ... 185
Table 4.24 - Auxiliary table for calculating consumption in toilets ... 186
Table 4.25 - Auxiliary table for calculating consumption in bathroom faucets ... 186
Table 4.26 - Runoff Coefficient and Water Efficiency of Filtration ... 190
Table 4.27 - Pluviometric Station Data ... 191
Table 4.28 - Monthly average rainfall ... 191
Table 4.29 - Calculation of Rainwater Harvesting System ... 192
Table 4.30 - Intensity, Duration and Frequency equations for M0024 pluviometric station ... 199
Table 4.31 - Design and sizing of PVC pipe from catch basin to the self-cleaning reservoir ... 201
Table 4.32 - Design and sizing of PVC pipe from catch basin to the self-cleaning reservoir ... 203
Table 4.33 - Design and sizing of PVC pipe from catch basin to the self-cleaning reservoir ... 204
Table 4.34 - Design and sizing of PVC pipe from catch basin to the self-cleaning reservoir ... 206
Table 4.35 – Analysis of water amount ... 208
List of
acronyms
ANQIP: Associaçao Nacional para a Qualidade nas Instalaçoes Prediais ASTM: American Society of Testing Materials
BEPAC: Building and Environmental Performance Assessment Criteria
BREEAM: Building Research Establishment Environmental Assessment Method C: Roughness Coefficient according with Hazen-Williams
CASBEE: Comprehensive Assessment System for Building Environmental Efficiency Di: Internal diameter [mm]
EPMAPS: Empresa Pública Metropolitana de Agua Potable y Saneamiento f: Friction Coefficient according with Moody’s Diagram
hB: Pressure drop due to broadening effect (steel pipes)
hf: Pressure drop according with Darcy-Weisbach
hN: Pressure drop due to narrowing effect (steel pipes)
i: Maximum Rainfall Intensity [mm/h]
INAMHI: Instituto Nacional de Meteorología e Hidrología INEN: Servicio Ecuatoriano de Normalización
IWA: International Water Association
J: Head loss according with Hazen-Williams [m/m] LEED: Leadership in Energy & Environmental Design m.a.s.l: Meters above sea level
MDQ: Metropolitan District of Quito
NASA: National Aeronautics and Space Administration PE: Polyethylene
PP: Polypropylene PVC: Polyvinyl chloride Q: Volumetric flow rate [l/s]
RHS: Rainwater Harvesting System S: Flow Speed inside the pipeline [m/s] SUDS: Sustainable Urban Drainage Systems UWC: Urban Water Cycle
Table of Contents
DEDICATION III ACKNOWLEDGEMENTS V RESUMO VII ABSTRACT IX LIST OF FIGURES XILIST OF TABLES XVII
LIST OF ACRONYMS XX
TABLE OF CONTENTS XXII
1. Introduction 1
1.1. Framework 1
1.2. Topic Overview 3
1.2.1. Natural resources available in Ecuador 10
1.2.2. Uses of water in Ecuador 18
1.2.3. Uses, figures and rates for potable water in Quito - Ecuador 22 1.2.4. Statistical information of water losses in Quito – Ecuador 29
1.3. Justification and objectives 32
1.3.1. Justification 32
1.3.2. Objectives 36
1.4. Methodology 37
2. Background and Literature 39
2.1. Introduction 39
2.2. Water Cycle and Urban Water Cycle 40
2.2.1. Water cycle 40
2.2.2. Urban water cycle 44
2.2.3. Components of water supply systems 48
2.2.4. Components of urban drainage systems 54
2.3. Sustainable urban drainage systems 57
2.3.1. Structural measures to prevent urban flooding 59 2.3.2. Non-structural measures to prevent urban flooding 63
2.4. Efficient use of water in buildings 70
2.4.1. Components of the buildings water distribution facilities 73
2.4.2. Conventional and alternative water resources 78
2.4.3. Water losses, consumption and energy reduction 84 2.4.4. Proposal of Water Efficiency Labeling for Ecuador 101
3. Rainwater harvesting systems 103
3.1. Introduction 103
3.1.1. Advantages of Rainwater Harvesting Systems 105
3.1.2. Disadvantages of Rainwater Harvesting Systems 107 3.1.3. International Rainwater Catchment Systems Associations 108
3.2. Components of the rainwater harvesting system 109
3.2.2. Pipes 113
3.2.3. Filters 114
3.2.4. Self-cleaning Reserve 115
3.2.5. Reservoir / cistern for rainwater storage 116
3.2.6. Treatment 117
3.2.7. Distribution pipelines 118
3.2.8. Strengths, Weaknesses, Opportunities, Threats 118
3.3. Water losses and energy consumption 119
3.4. Rainwater quality and treatment 124
3.5. Cost/benefits analysis 127
3.5.1. Input Data (Time and financial indicators) 128
3.5.2. Financial Indicators 129
3.5.3. Output Data 129
3.6. Certification and technical specifications 131
4. Case Study 134
4.1. Introduction 134
4.2. Current situation of the buildings selected 136
4.3. Description of Case Study 137
4.3.1. Location, topography and areas considered 141
4.3.2. Architectural characterization 145
4.3.3. Hydro-sanitary system of the building 156
4.4. Water consumption in the buildings 163
4.4.1. Average water endowments 164
4.4.2. Average of useful reference consumption 165
4.4.3. Classification of buildings according to the non-residential consumption pattern 165
4.4.4. Internal use of water by fixture 166
4.4.5. Correction for internal use of water 170
4.4.6. Volumes and unit consumptions of devices 172
4.4.7. Usage Factors 174
4.4.8. Methodology for flow measurement 176
4.5. Selected statistical method to discard data 179
4.6. Results obtained 180
4.6.1. Classroom Building 180
4.6.2. Hydraulics Laboratory 184
4.7. Solution and measures for the case study 187
4.7.1. Rainwater Harvesting System 187
4.7.2. System description and technical specifications 193
4.7.3. Design of new components 199
5. Conclusions 220
6. References 223
1. Introduction
1.1. Framework
Water has been, is and will be one of the most important non-renewable natural resources available for the existence of life on planet earth. This resource is essential for living beings, humans, fauna, flora, nature and even for the socioeconomic development of all nations in the world. Currently, one of the main problems facing the world is the shortage of fresh water used to meet the consumption needs of the population due to a set of factors that have caused this situation. The rapid population growth, increased consumption of drinking water, lack of consumption’s regulation and control mechanisms, global warming, climate change, uncontrolled exploitation of natural freshwater resources, the pollution of water resources, dependence on energy resources and lack of awareness to reduce the waste of this natural resource, are part of those factors that have produced the reduction in water availability.
In Latin America, especially in Ecuador, the concept of water preservation is still not well known or very little practiced. One of the aspects that cause this lack of social awareness and the application of regulatory measures has to do with the abundance of water that some countries have (at the moment) and that have not developed plans that conserve this resource to guarantee their quantity and quality to future generations. The population growth in Ecuador is indirectly proportional to the volumes of water available in existing water fields; reason enough to begin by changing the current situation related to the excessive and uncontrolled consumption of drinking water in buildings.
The obligation to preserve this natural resource taking into account the population growth of the country is one of the most special motivations to implement measures of consumptions reduction. For example, the installation of devices that improve the water efficiency of buildings, the use of another type of water (rainwater) as an alternative to water supply systems for buildings can be analyzed in order to preserve water and even to give other types of solutions related to urban flooding. Water supply is a basic need of the world population, which is why it is important to establish actions to ensure the availability of this resource for
future generations, through the implementation of measures at local and global level in order to achieve short, medium and long-term results.
With regard to local and specific solutions within Civil Engineering alternatives, it is proposed as an object of study in the present research, the analysis of measures of Water Efficiency that can be applied to buildings, with the aim of contributing to the reduction of consumption and waste of water. Although this type of research or study does not guarantee the availability of water in the future, it promotes and motivates the use of good and responsible practices for the conservation of this resource in public and private facilities, where the awareness of the users can be tested in the daily water expenditure.
Based on the current situation in Ecuador and the city of Quito, which will be detailed in the following points, this research work focuses mainly on the application of alternative systems or resources such as the use of rainwater that can be captured in the building studied. Heavy rains lasting from September to May each year in the city cause severe flooding due to its topography and deficiencies in the public drainage system. This is one of the most important reasons to take into account the use of alternative resources that allow to reduce the consumption of water from public water supply systems and therefore to reduce the energy consumptions that are required to provide this service to buildings from the city.
For the present case study, the basic considerations and characteristics of the rainwater harvesting system that could be implemented in the building, the area and volume of water collection, the treatment system and the storage system are analyzed. Through a thorough study of the water cycle, efficient use of water in water supply systems, urban sustainability of drainage systems and water efficiency in buildings related to measures, technologies, loss reduction devices, certifications and water balances. Based on the solutions, technical suggestions presented, and the development of the model that improves the water efficiency of the building under study, the aim is to reduce the consumption of drinking water, also reducing energy consumption and associated production costs. Taking into consideration that in Ecuador water efficiency in buildings is a completely new and necessary case study, it aims to raise social awareness about the need to preserve water as a natural resource from buildings, with the simple and planned implementation of systems that contribute to the improvement of the sustainability of the new constructions of today. To fulfill this objective, all materials and devices in the Ecuadorian market will be taken into consideration.
1.2. Topic Overview
In order to understand the need to preserve water as a natural resource for the population and as an essential basic service, it is important to analyze and evaluate the current situation through official figures or statistics, which describe reality in a better way.
According to UNESCO reports (United Nations Educational, Scientific and Cultural Organization), only 2.53%1 of the total water on the planet Earth is fresh water, that is, only this percentage can be used for consumption of living beings considering that the difference of percentage is saline water.
Certainly, one of the most important and up-to-date indicators that can contribute to identifying today's problem with the availability of fresh water in the world is the growth of the world's population. Official figures reveal that the total population in millions is 7,433 by 20162.
While it is true that fresh water reserves are sufficient to meet the needs of the current population as shows the Figure 1.1, exaggerated consumption and waste water, do not guarantee that this capacity will be maintained for future generations.
Figure 1.1 – Water Reserves vs Current Population (2016) Source: Author’s compilation
To have a clearer idea of the quantity of fresh water available on Earth, it is essential to review the official figures of some bibliographical references, in order to understand the need to establish control over water consumption. It is also important to analyze the use of water at a global level in order to identify the most common activities for which this resource is intended.
As shows Table 1.1 and Figure 1.2, the availability of fresh water is very small compared to the total volume of water that exists on Earth and is mostly unfit for human consumption. Due to the dramatic global warming and permanent climate change, glaciers and ice caps suffer a slow melting process due to the intensification in the ambient temperature, which causes an increase in the level of the sea and in turn that this type of fresh water resources disappear completely. In the last decades, the world has witnessed the radical change in the morphology of glaciers in the two poles and in the loss of glaciers present in volcanoes and mountains all over the world. Ecuador is one of the countries that has lost much of its glaciers located in volcanoes and mountains in recent years because of this climate change.
Table 1.1 - World Water Distribution
WORLD WATER DISTRIBUTION
Type Water Volume (million km3) Percent of fresh water (%) Percent of total water (%) TOTAL WATER 1386 100 Fresh water 35.0 100.0 2.53
Glaciers and ice caps 24.4 69.70 1.76
Groundwater 10.5 30.00 0.76
Lakes, rivers, atmosphere 0.1 0.30 0.01
Saline water 1351 97.47
Source: Food and Agriculture Organization of the United Nations – FAO, (2002)
One of the resources with more fresh water after glaciers is under surface (groundwater) however in many places of the world it is very difficult to exploit these resources because of the depth to which they are located and the costs generated by this activity. This type of resource contains high quality water in most cases but its extraction seems to be the next step to cover the water demands that will be required in 2050. The freshwater resource offered by rivers and lakes is very limited compared to other types of resources, but this resource is one of the most exploited currently by the extraction facilities it provides. The
surface resources are not only used to capture the water and provide this service to the cities, but also as a generator of electric power, which is why its availability is always threatened.
Of these 35 million km3 of fresh water, is satisfied not only the consumption needs of the population, of animals and plants, but also of the socioeconomic activities to which the inhabitants of the earth are dedicated. In general, fresh water is destined for three important sectors: urban (human consumption), industrial (commercial - economic) and agriculture.
Figure 1.2 – Availability of water in the World Source: Author’s drawings
As shows the Figure 1.3, global withdrawals and water consumption are directly related to the sectors mentioned above. Water efficiency in buildings is then associated to reducing water consumption and waste water at the urban level. While it is true that municipal water consumption and waste water is not the largest compared to other activities in which water is used, it is important to reduce water consumption and waste water, to ensure the availability of this resource in the future.
As can be seen, it is paradoxical that municipal waste water is higher (8%) than municipal water consumption (3%), reason for which it is important to pay attention to the concept of saving water. Maybe, the infiltration of rainwater in domestic drainage system has an effect about this.
Figure 1.3 – Fate of global freshwater withdrawals
Source: The United Nations World Water Development Report 2017, (2017)
It is very important to distinguish the percentages presented in the Figure 1.4 to differentiate between the water being withdrawn and the water consumed. Most of the water withdrawn for domestic consumption returns to rivers and aquifers as waste water often without treatment.
Figure 1.4 – Water withdrawal and water consumption
Source: The United Nations World Water Development Report 2017, (adapted)
It is also important to analyze the variation of the availability of fresh water through rainfall or precipitations according to the geographical location of each country. For example, Figure 1.5 shows that the total renewable water resources per capita for Ecuador varies between 15000 and 50000 m3. This data is very important for the present research project,
0% 20% 40% 60% 80% 100%
Agriculture Municipal Industry
Water Withdrawal 70% 11% 19% Water consumption 93% 3% 4% 70% 11% 19% 93% 3% 4% P E R C E NT A GE ( %)
WATER WITHDRAWAL AND WATER CONSUMPTION
considering that the case study takes into account the use of rainwater as an alternative resource of water supply for buildings according to the concept of water efficiency.
Figure 1.5 - Total renewable water resources per capita, (2013)
Source: UNESCO – The United Nations World Water Development Report 2015
“The average annual rainfall over land amounts to 119000 km3, of which some 74000 km3 evaporate back into the atmosphere. The remaining 45000 km3 flow into lakes, reservoirs and streams or infiltrate into the ground to replenish the aquifers. This represents what is conventionally called "water resources". Not all of these 45 000 km3 are accessible for use because part of the water flows into remote rivers and during seasonal floods. An estimated 9 000 - 14 000 km3 are all that are economically available for human use, a teaspoon in a full bathtub compared to the total amount of water on earth. …” (p. 1) 3
The figures presented above allow to understand the current and the global situation of water as a nonrenewable resource and emphasize the importance of establishing a control point that regulates the consumption levels of this resource in buildings, which would be classified within the municipal use of water (for human consumption). As for the sector of industry and agriculture, it is important to establish other water efficiency research to reduce water consumption.
Information about water availability in Latin America is scarce or at best has not been updated. However, it is important to know the current situation of the region that Ecuador is located. After Asia, South America has one of the largest water availabilities. One of the
advantages of South America is that it has this great concentration of fresh water and a population to serve very small compared to other regions of the world. Due to its geographical location, climatic conditions and extensive jungle regions, fresh water in South America is very abundant (Table 1.2). The problem is fundamentally, in spite of not having overpopulation, there is no control or mechanisms in place for the preservation of water in these reserves.
Table 1.2 – Fresh water availability compared to population
AVAILABILITY OF FRESH WATER IN THE CONTINENTS
Continent Population (%) Fresh water Availability (%) Africa 13 11 Asia 60 36
Australia & Oceania < 1 5
Europe 13 8
North & Central America 8 15
South America 6 26
Source: Amigos de la Tierra América Latina y el Caribe, (2016)
“The estimated extension of the water supply in South America is 13,555 km3…” (p. 16) 4
Another important factor that contributes with this amount of fresh water for South America is the number of rivers that have their countries, among them the Amazon River which is the largest river by volume of water in the world and that alone concentrates a fifth part of fresh water in the liquid state of the planet. The orographic influence of the countries of South America and especially of those that are crossed by the Andes Mountains like Ecuador, possess high availability of water in comparison to its surface and population.
The largest amount of water is concentrated in the central zone of South America, in one of the largest jungle extensions in the world located in Brazil. For this reason, water stress levels are different throughout the region.
This unequal distribution of water in the regions of South America can be perceived in some countries more than in others, due precisely to the lack of mechanisms, norms and
regulations that allow to control the consumption of water of the inhabitants through a responsible administration of this one resource.
As can be seen in Figure 1.6, the availability of the resource does not mean that it is accessible to the entire population. 5 This implies that the majority of countries with high availability levels experience declines in levels of drinking water coverage for their populations, as is the case in Ecuador. According to the source, between 71% and 80% of the population in Ecuador has access to potable water, that is, in the worst case, approximately 29% of its inhabitants do not have this basic service, or are victims of their scarcity or poor quality.
Figure 1.6 - Tribunal Latinoamericano del Agua, (2017)
Source: Population with access to drinking water in Latin America and the Caribbean
This fact is another element that justifies applying water efficiency systems in buildings, since despite having the necessary reserves of water, not all the inhabitants of the country have access to this natural resource. Contributing to reduce current water consumption, can contribute to more people who are beneficiaries of the potable water service.
1.2.1.
Natural resources available in Ecuador
Located in the northwestern part of South America, Ecuador is a country with an area of 283’560 km2 and an approximate population of 16.4 million inhabitants. Its capital Quito, becomes one of the most important and outstanding cultural heritages of humanity. Ecuador has four natural regions, Costa, Sierra, Orient or Amazon and the region of the Galapagos Islands located in the Pacific Ocean.
Privileged for being located in the center of the world, Ecuador becomes a small
country with one of the most abundant biodiversity in the world, with innumerable climates of tropical characteristics and an enormous natural resource heritage that become today, in the main economic and energy engine of the country. These natural resources are essential for the development of the population; they supply raw materials, food, energy and water for consumption as well as agriculture and industries. Ecuador has a set of renewable natural resources such as fauna, animals, water and soil and non-renewable as minerals, metals, petroleum, natural gas and inexhaustible ecological time resources, as sea wave energy, wind, sunlight, among others.
The concept of renewable water in Ecuador is very questionable. In order to adopt this statement as such, it is necessary to have a very rigorous control of its use, treatment, and, circulation, otherwise it becomes a non-renewable resource. For this reason and considering all the demographic and economic background, it is very difficult to guarantee that in Ecuador this resource will remain as renewable within a few years.
Because of its geographical location and the natural action of the Andes Mountains, Continental Ecuador has a diverse orography that give rise not only to three well-defined natural regions but also to a large number of rivers whose origin comes precisely from these
Figure 1.7 - Continental Ecuador Source: Google Earth v7.1.8.3036
mountains, being the country with more rivers per square meter in the world. Its freshwater reserves are not only concentrated in these rivers, but also in the aquifers of the eastern region, which are the most abundant in the country. It is impossible to forget the volcanoes and mountains of “perpetual” snow and glaciers, which give rise to large rivers that are the main resource for the withdrawal of water for consumption, agriculture and industry (energy generation).
As shown in the Table 1.3, the water availability of the Pacific slope is high in view of the 2000 m3/inhabitant/year, which is considered to be scarce especially in times of low precipitation. However, it is important to note that this value is not very far from the critical level.
According to the Diagnosis of Water Statistics in Ecuador and the study carried out by SENAGUA (Secretaría Nacional del Agua – Ecuador), the following statistical results are considered as starting data:
Under conditions of natural water regime and without regulation dams the availability of fresh water through natural slopes is as follows:
Table 1.3 – Fresh Water availability in Ecuador
FRESH WATER AVAILABILITY IN ECUADOR
Natural slope Resources of water
(GUARANTEE OF 90%) (Hm3/year)
m3/inhab/year
Pacific 60563 4600
Amazonas 228917 340000
Total Continental Ecuador 289480 21067
Source: Comisión Económica para América Latina y el Caribe - CEPAL, (2012)
Of course, this amount of freshwater considered as the current reserve of Ecuador varies with respect to the factors that determine the consumption of this resource: population growth, economic development, water demand and its uses, water management and policies established to preserve this natural resource. Considering the expectation of population growth worldwide of approximately 9 billion inhabitants by 2050, it is necessary to start applying water efficiency criteria that contribute to a uniform and responsible distribution of
These natural resources are distributed as follows. Within the wide range of hydrological resources conditioned by the physical and climatic diversity of the country thanks to its geographical location, the Esmeraldas and Guayas River in the coast are important hydric references of the natural resources of Ecuador.
In the mountain range, thanks to the extensive mountain range that crosses the country from north to south, there is an extensive amount of rivers that drain preferentially towards the eastern slope and whose bottoms are different sized aquifers. The difference of level between the zone of the mountain range and the zone of the east (Amazon region), generates an abrupt descent of these rivers that in the majority of the cases is used for the generation of electricity. The eastern region is one of the Amazon River basin; therefore, there is a large number of rivers and the largest reserve of underground aquifers in Ecuador, thanks to the abundance of rainfall, with areas of deficient flooding and drainage. All these natural resources are distributed in the watersheds as detailed in the Table 1.4.
Table 1.4 – Watersheds areas in Ecuador
WATERSHEDS AREAS
Natural slope Watersheds
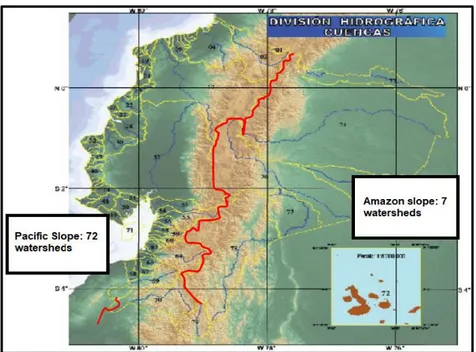
Pacific 72
Amazonas 7
Total Continental Ecuador 79
Source: Secretaría Nacional del Agua - SENAGUA, (2011)
Figure 1.8 shows the hydrographic division of Ecuador according to the drainage of its water bodies to the west and east of the Andes Mountains. As can be seen, the red line is precisely the line that separates neighboring drainage basins with opposite drainage directions. This mountainous chain exerts a significant influence on the water behavior, the drainage of rainwater and the country's current freshwater reserves.
Despite the large number of tributaries and underground aquifers, much of Ecuador's population can not be supplied with potable water in their homes. This problem is very common in the area of the Ecuadorian coast, especially in the province of Manabí, where the Esmeraldas and Guayas River basins exclude it, making it largely desert.
Figure 1.8 - Hydrographic division of Ecuador Source: Secretaría Nacional del Agua - SENAGUA, (2011)
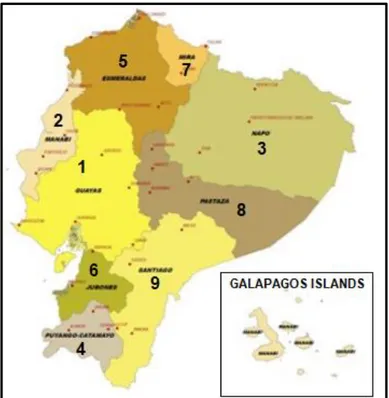
As shows Figure 1.9, the country's water potential is concentrated in the Amazon region where water resources are more abundant due to permanent rainfalls and the confluence of mountain rivers, however, the lowest percentage of Ecuador's population is concentrated in this region. This is another factor that obstructs an equitable distribution of water in the regions of the country.
As shows Table 1.5 and Figure 1.10, for water management as a natural resource in Ecuador there are nine hydrographic demarcations, which are terrestrial and marine zones composed of one or several neighboring watersheds and the underground and coastal transition waters associated with these basins. “The total of these hydrographic demarcations include 740 hydrographic units distributed in these associated basins and micro-basins. The Galapagos Islands are located within the Guayas hydrographic demarcation”… (p.10)6
Table 1.5 – Hydrographic Demarcations of Ecuador
HYDROGRAPHIC DEMARCATION OF ECUADOR
Nº Hydrographic Demarcation
Number of
hydrographic units Area (km
2) 1 Guayas 419 43’181.86 2 Manabí 57 11’933.39 3 Napo 6 65’206.18 4 Puyango – Catamayo 46 10’859.97 5 Esmeraldas 147 32’078.27 6 Jubones 2 11’409.29 7 Mira 58 6’847.54 8 Pastaza 12 32’154.88 9 Santiago 11 34’445.91 Galápagos 1 8’225.71 Total 740 256’370.00
Source: Comisión Económica para América Latina y el Caribe - CEPAL, (2012)
For the case study of the present investigation, it is important to note that Quito is located within the Esmeraldas hydrographic demarcation (No. 5), which is attributed the general water administration for this case. However, Quito has a public institution, which is responsible for managing and controlling the drinking water supply system (Empresa Pública Metropolitana de Agua Potable y Saneamiento - EPMAPS), in other words, to regulate the municipal water service in the country's capital.
It is also important to analyze that Quito has as its main resource of supply, the waters of Micacocha located in the moorlands of the Antisana Ecological Reserve, important natural "factories" of this precious resource. Due to the climatic conditions and its geographical location, this reserve becomes an essential resource of fresh water for the inhabitants of Quito.
Figure 1.10 - Hydrographic Demarcations of Ecuador Source: Secretaría Nacional del Agua - SENAGUA, (2011)
These figures allow to conclude that the Amazon region is the area with the most important water resources that the country has for its supply. At present, there are no inspections, surveys or surveys that allow updating information on the volumes of water that exist in these resources, which is why plans and strategies to encourage the care of these natural resources and to recharge these reserves through systems and techniques that prevent their disappearance.
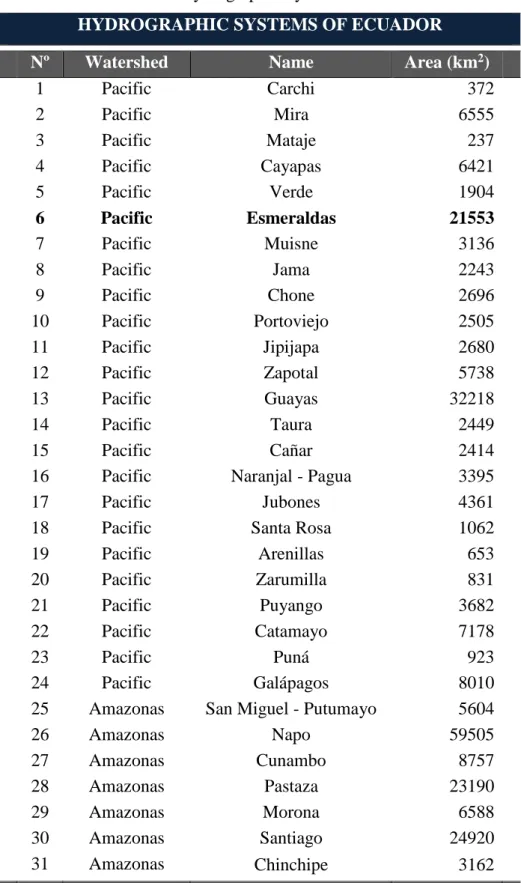
On the other hand, and based on the grouping of hydrographic basins with similar climatic and spatial characteristics (homogeneity), Ecuador has 31 hydrographic systems totaling an area of 131726 km2 that correspond to 51% of the total area of the country.7 The hidrographic
systems of Ecuador, are defined in the Table 1.6.
Table 1.6 – Hydrographic Systems of Ecuador
HYDROGRAPHIC SYSTEMS OF ECUADOR Nº Watershed Name Area (km2)
1 Pacific Carchi 372 2 Pacific Mira 6555 3 Pacific Mataje 237 4 Pacific Cayapas 6421 5 Pacific Verde 1904 6 Pacific Esmeraldas 21553 7 Pacific Muisne 3136 8 Pacific Jama 2243 9 Pacific Chone 2696 10 Pacific Portoviejo 2505 11 Pacific Jipijapa 2680 12 Pacific Zapotal 5738 13 Pacific Guayas 32218 14 Pacific Taura 2449 15 Pacific Cañar 2414
16 Pacific Naranjal - Pagua 3395
17 Pacific Jubones 4361
18 Pacific Santa Rosa 1062
19 Pacific Arenillas 653 20 Pacific Zarumilla 831 21 Pacific Puyango 3682 22 Pacific Catamayo 7178 23 Pacific Puná 923 24 Pacific Galápagos 8010
25 Amazonas San Miguel - Putumayo 5604
26 Amazonas Napo 59505 27 Amazonas Cunambo 8757 28 Amazonas Pastaza 23190 29 Amazonas Morona 6588 30 Amazonas Santiago 24920 31 Amazonas Chinchipe 3162
Source: Consejo Nacional de Recursos Hídricos del Ecuador - CNRH, (2002)
As shown in Table 1.6, 24 of Ecuador's 31 hydrographic systems flow into the Pacific's natural watershed. The hydrographic system number 6 called Esmeraldas is where the case study of this research work is located.
Several studies have been developed over the last decade in Ecuador, to determine the conditions of water resources and their main characteristics. According to the available information, the main characteristics of renewable water resources are detailed in Table 1.7.
Table 1.7 – Renewable water resources
RENEWABLE WATER RESOURCES (RWR) OF ECUADOR Long-term average annual rainfall Year Value Unit
Intensity 2274 mm/year
Volume 583 km3/year
Long-term average RWR Year Value Unit
Internal 442.40 km3/year
External 0 km3/year
Total 442.40 km3/year
Dependency rate 0 %
RWR per person 2014 27403 m3
Usable underground resources Year Value Unit
Potential 10.40 km3/year
Water supply of rivers from neighboring countries
Incoming (+) Country Value Unit
Water supply 0 km3/year
Outgoing (-) Country Value Unit
Water leak Colombia 35.00 km3/year
Water leak Peru 128.76 km3/year
Source: Food and Agriculture Organization of the United Nations - FAO, (2015)
The renewable water resources of Ecuador for each inhabitant guarantee a value of 27403 m3/inhabit according with the Table 1.7. This figure differs from that cited by CEPAL in Table 1.3, since in this case the insular region is also considered, and not only the continental one. In addition, the source of consultation has been updated through the latest water studies conducted in the country. It is very important to consider that in the case of Ecuador, there is no water contribution from neighboring countries, quite the opposite, there is the exit of water that originates from natural resources located in the country and that through certain rivers allow the water flows to Colombia and Peru. This lack of water supply is a
1.2.2.
Uses of water in Ecuador
Water demand and consumption are two very different terms. Their close relationship allows to understand the need and quantity with which water resources are used in each country.
Demand: is the amount of water that is needed to supply a specific use.
Consumption: the physical loss of water (in volume), that the specific use produces.
It is important to classify freshwater uses as consumptive and non-consumptive. Within the first group is the water consumption in quality and quantity such as domestic supplies, volumes of water for industry and of course for agriculture. In this case, the water that is used is not returned to the medium where it was captured nor with the same characteristics that was extracted. In contrast, non-consumptive uses include volumes of water intended to cover other types of activities such as navigation, power generation and water dams. In this case, the water used is returned to the medium from which it was extracted, although it is not always returned to the same place. In addition, this volume of water can present alterations in its physical, chemical and biological characteristics. Ecuador is one of the richest countries in water resources in the region. In the country, the uses of water to meet the requirements of the population focus on the areas according to SENAGUA.
A. CONSUMPTIVE WATER USE
As can be seen in Figure 1.11, the country's water is mostly used for agricultural purposes. However, it is logical that residential and public use represents one of the most significant percentages, since all inhabitants require this natural resource for their consumption and for the tasks that they perform daily.
Figure 1.11 - Consumptive water use in Ecuador Source: SENAGUA 2011 (adapted)
0% 20% 40% 60% 80% Agriculture Residential Use Industrial Use 80% 13% 7%
Table 1.8 shows the amount of water that the consumptive uses require. For this reason, it is very important to regulate or to control the consumption of water at the residential level, that is, to guarantee the expenditure of water exclusively necessary in homes, buildings, institutions, schools, among others. Although it is true that the study of water efficiency in a particular sector will not guarantee the existence of this resource in future years, at least it will allow to use the water that is really required in a specific building and therefore, will contribute to preserve this natural resource.
Table 1.8 – Water extraction for consumptive uses
WATER EXTRACTION FOR CONSUMPTIVE USES
By Sector Year Value Unit
Agriculture 8.076 km3
Residential Use (Municipal) 1.293 km3
Industrial 0.549 km3
Total 9.918 km3
Source: Food and Agriculture Organization of the United Nations - FAO, (2015)
B. NON-CONSUMPTIVE WATER USE
These types of uses are those that demand the most volume of water. However, it is also important to consider non-consumptive uses within this analysis.
b.1) DAMS – HYDROPOWER
These types of uses are those that demand the most volume of water. One of the clearest examples of this situation is the hydroelectric, which require large amounts of water volume to generate electricity through the movement of the turbines.
At present, Ecuador has experienced one of the most notable growths in this aspect, mainly due to the creation and construction of important projects for the generation of hydropower. Table 1.9 summarizes the hydroelectric growth that the country has experienced throughout its history.
Table 1.9 – Hydroelectric growth in Ecuador
HYDROELECTRIC GROWTH IN ECUADOR
Name of Dam River Operational
since Reservoir capacity (million m3) Power (MW) El Ambi - 1925 - 485 Cumbayá - 1961 - 40 Azúcar - 1967 5 - Pisayambo - 1967 100.7 -
Poza Honda Portoviejo 1971 100 -
Pucara - Pisayambo Tambo 1977 - 76
Guangopolo - 1977 - 31.2
Daniel Palacios (Paute) Paute 1983 120 1100
Tahuin Arenillas 1987 210 -
Agoyán - 1987 3.6 156
Chongón Chongón 1991 280 -
Daule Peripa Daule 1992 6300 -
La Esperanza El Carrizal 1996 450 -
La Mica (El Carmen) - 1997 50 -
Salve Faccha - 2002 12.5 -
San Vicente Javita 2003 60 -
Abanico Abanico 2005 - -
San Francisco Pastaza 2007 - 230
Pasochoa - 2012 - 4.5
San Miguel Caldera 2015 - 44.4
Manduriacu Guayllabamba 2015 10 65
Coca-Codo Sinclair Napo 2016 1.2 1500
Sopladora Paute 2016 10 487
Source: Food and Agriculture Organization of the United Nations - FAO, (2015)
The last three dams are part of the new energetic matrix program developed by the Ecuadorian Government and China, in order to increase and improve the energy capacity and to solve the current demands. The total capacity of these dams to store water and ensure the availability of this resource in drought stations is 7.69 km3.
b.2) WATER FOR IRRIGATION
The use of water for the agricultural activity through irrigation systems in Ecuador, as well as in other Latin American countries, is a priority. The official figures reveal that 80% (8.076 km3) of fresh water is destined to the agricultural sector per year, as the main economic activity of the country. The demand of this resource for the agricultural sector is significant due to the natural conditions of Ecuador, where a great variety of products are cultivated in order to be available for consumption of the national population and also, the international market. This percentage is distributed as shows the Table 1.10, through irrigation systems located in the Sierra, Coast, Amazon and Insular Regions of Ecuador.
Table 1.10 – Irrigation Surface according to type
IRRIGATION SURFACE TYPES IN ECUADOR
Nº Description Value Unit
Total surface equipped for irrigation 1’500,000 ha
1 Surface irrigation 663,900 ha
2 Sprinkler irrigation 170,100 ha
3 Localized irrigation 19,400 ha
Source: Food and Agriculture Organization of the United Nations - FAO, (2015)
Of all non-consumptive uses, hydropower is the activity that requires the most volume of water in the country. It is important to emphasize that these figures consulted correspond to the data obtained from the last decade (2010 - 2017) since not all these indicators are updated. The estimated flow for non-consumptive uses is summarized in Figure 1.12.
Figure 1.12 - Non- Consumptive water use in Ecuador
0.00 1000000.00 2000000.00 3000000.00 Public Administration
Irrigation Productive Hydropower
Series1 85155.76 519937.18 78723.50 2744311.57 F low -Di sc h ar g e (l /s )
1.2.3.
Uses, figures and rates for potable water
in Quito - Ecuador
Quito, as the capital of Ecuador, is the most important city in the country. Its political, social and economic importance make this city the main strategic axis for the development of the population. Located at 2800 meters above sea level and with the water resources described in literal (1.1.1), Quito has a permanent water supply service in the majority of its population.
According to the sustainability report prepared by the “Empresa Pública Metropolitana de Agua Potable y Saneamiento (EPMAPS -2016)”, the key performance indicators on the administration of this company in addition to the uses and rates are described in the following tables.
Table 1.11 summarizes the systems from which Quito is supplied with water to later make it drinkable and distribute it through the conduction networks to the different sectors of the city. These 7 water supply systems, become the most important and necessary resources for the contribution of 259.65 m3 of water, captured in an average of 8.21 m3/s.
Table 1.11 – Systems that provide water for Quito
SYSTEMS THAT PROVIDE WATER FOR QUITO Nº System Resource Millions m3 %
1 Papallacta Superficial 91.76 35.3
2 La Mica Superficial 39.59 15.2
3 Oriental pipelines of conduction Superficial 77.86 30.0% 4 Western pipelines of conduction Superficial 27.74 10.7%
5 Rural Superficial 3.37 1.3%
6 Wells Underground 4.78 1.8%
7 Water springs Superficial 14.56 5.6%
TOTAL 259.65 100.0%
Source: Empresa Pública Metropolitana de Agua Potable y Saneamiento, (2017)
On the other hand, Quito has 20 treatment plants that on average produce 7.87 m3/s of drinking water for the consumption of the inhabitants of this city. Table 1.12 shows the
volume of water that these plants must make drinkable according to each natural system of water supply.
Table 1.12 – Volume of treated water in Quito
VOLUME OF TREATED WATER IN QUITO
Nº System Resource Millions m3 %
1 Papallacta Superficial 92.43 37.1%
2 La Mica Superficial 38.77 15.6%
3 Oriental pipelines of conduction Superficial 68.90 27.7% 4 Western pipelines of conduction Superficial 26.19 10.5%
5 Rural Superficial 3.37 1.4%
6 Wells Underground 4.78 1.9%
7 Water springs Superficial 14.56 5.8%
TOTAL 249.00 100.00%
Source: Empresa Pública Metropolitana de Agua Potable y Saneamiento, (2017)
As for the number of reserve tanks available in Quito to store drinking water and distribute it later, is 333 units as shows Figure 1.13. The 51.7% of this total corresponds to tanks that allow the distribution of drinking water to the entire city of Quito and the remaining 48.3% of tanks, distribute drinking water to the neighboring parishes of the city.
Figure 1.13 - Drinking water reserve tanks
Reserve and distribution tanks
(city)
Distribution tanks
(parishes) TOTAL TANKS
Number of tanks 172 161 333 0 50 100 150 200 250 300 350 NU M BER OF T A NK S
The distribution of drinking water for the city of Quito is made through two networks: the transmission lines with a total of 602 km and the distribution pipelines with a total of 5,803.59 km. The Table 1.13 shows the amount of water coming from natural resources that is distributed in the city of Quito. On average, the water distributed is 7.73 m3/s.
Table 1.13 – Distribution of drinking water in Quito
DISTRIBUTION OF DRINKING WATER IN QUITO Nº System Resource Millions m3 %
1 Papallacta Superficial 89.69 36.7%
2 La Mica Superficial 38.31 15.7%
3 Oriental pipelines of conduction Superficial 68.19 27.9% 4 Western pipelines of conduction Superficial 25.70 10.5%
5 Rural Superficial 3.30 1.4%
6 Wells Underground 4.78 2.0%
7 Water springs Superficial 14.56 6.0%
TOTAL 244.52 100.00%
Source: Empresa Pública Metropolitana de Agua Potable y Saneamiento, (2017)
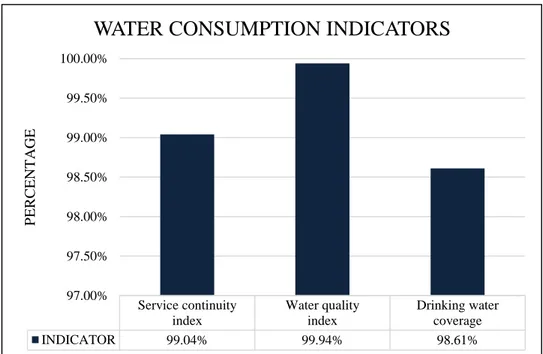
The use of tools to improve the performance of a Water Management Company through the application of pioneering practices (Benchmarking), can be evaluated through different quality indicators. This type of tools has substantially improved the quality of service that EPMAPS provides to the inhabitants of Quito. Thanks to its efficiency, the following indicators are currently guaranteed.
According to the Figure 1.14, 98.61% of the Metropolitan District of Quito has drinking water coverage at the residential, municipal, commercial and industrial levels. The remaining 1.39%, usually lacks the service due to geographical inconveniences that prevent distributing the water coming from the reserves by gravity. These sectors in most cases correspond to new neighborhoods settled in the highest areas of the city. From experience, the continuity of the water service in Quito is indeed satisfactory. Its discontinuity is usually due to maintenance tasks in the network, operational factors or inconveniences in the collection, driving and distribution works that may occur throughout the year. Thanks to the 20 treatment plants in the city, the evaluated quality of drinking water meets all the requirements and standards required by the current Ecuadorian standard NTE INEN 1108.