Scanning electron microscopy with energy dispersive spectroscopy and
Raman and infrared spectroscopic study of tilleyite Ca
5
Si
2
O
7
(CO
3
)
2
-Y
Ray L. Frost
a,⇑, Andrés López
a, Ricardo Scholz
b, Fernando A.N. de Oliveira
c aSchool of Chemistry, Physics and Mechanical Engineering, Science and Engineering Faculty, Queensland University of Technology, GPO Box 2434, Brisbane, Queensland 4001, Australia
b
Geology Department, School of Mines, Federal University of Ouro Preto, Campus Morro do Cruzeiro, Ouro Preto, MG 35,400-00, Brazil
c
Federal Institute of Minas Gerais, Campus Ouro Preto, Ouro Preto, MG 35,400-000, Brazil
h i g h l i g h t s
The mineral tilleyite-Y, a carbonate-silicate of calcium, was analysed.
Using SEM with EDX and vibrational spectroscopy.
Multiple carbonate stretching modes are observed.
Supporting the concept of non-equivalent carbonate units. Multiple Raman bands in the OH
stretching region are observed.
g r a p h i c a l
a b s t r a c t
a r t i c l e
i n f o
Article history:
Received 28 July 2014
Received in revised form 25 March 2015 Accepted 9 April 2015
Available online 23 April 2015
Keywords:
Tilleyite Silicate Carbonate Hydroxyl
Infrared and Raman spectroscopy
a b s t r a c t
The mineral tilleyite-Y, a carbonate-silicate of calcium, has been studied by scanning electron microscopy with chemical analysis using energy dispersive spectroscopy (EDX) and Raman and infrared spec-troscopy. Multiple carbonate stretching modes are observed and support the concept of non-equivalent carbonate units in the tilleyite structure. Multiple Raman and infrared bands in the OH stretching region are observed, proving the existence of water in different molecular environments in the structure of tilleyite. Vibrational spectroscopy offers new information on the mineral tilleyite.
Ó2015 Elsevier B.V. All rights reserved.
Introduction
The mineral tilleyite, a calcium silicate carbonate, with general chemical formula given as Ca5Si2O7(CO3)2. The mineral was first
described from Crestmore quarries, Riverside Co., California, USA
[1]. Other occurrences were also reported from Flekkeren,
Telemark, Norway[2]; Oravitßa Skarns, Banat Mts, Caras-Severin
Co., Romania [3] and Anakit Creek, Krasnoyarsk Territory,
Eastern-Siberian Region, Russia[4,5]. Tilleyite forms in the contact metamorphic zone between igneous rocks and limestones, formed at low pressure and high temperature.
The crystal structure was first determined by Smith[6]and lat-ter refined by Louisnathan and Smith[7]and in recent study by Grice[8]. Tilleyite crystalizes with monoclinic symmetry and the unit cell parameters are: P21/a, a= 15.082(3), b= 10.236(2), c= 7.572(1) Å,b= 105.17°,V= 1128.3(3) Å3[7,8]. The structure of tilleyite has [CaO8] polyhedra adjoining [CO3] groups in one layer,
whereas [CaO8] polyhedra intertwine [Si2O7] pairs of tetrahedra in
the other layer[7,8].
http://dx.doi.org/10.1016/j.saa.2015.04.015 1386-1425/Ó2015 Elsevier B.V. All rights reserved.
⇑ Corresponding author. Tel.: +61 7 3138 2407; fax: +61 7 3138 1804.
E-mail address:[email protected](R.L. Frost).
Contents lists available atScienceDirect
Spectrochimica Acta Part A: Molecular and
Biomolecular Spectroscopy
Spectroscopy of carbonate anion
It is important to understand the vibrational spectroscopy of the carbonate anion in different molecular environments. Nakamoto et al. first published and tabulated the selection rules for unidenate and bidentate anions including the carbonate anion[10,11]. The free ion, CO32 with D3h symmetry exhibits four normal vibrational
modes; a symmetric stretching vibration (
m
1), an out-of-plane bend (m
2), a doubly degenerate asymmetric stretch (m
3) and another dou-bly degenerate bending mode (m
4). The symmetries of these modes are A01(R) + A002(IR) + E0(R, IR) + E00 (R, IR) and occur at 1063, 879,
1415 and 680 cm1respectively. Generally, strong Raman modes
appear around 1100 cm1due to the symmetric stretching
vibra-tion (
m
1), of the carbonate groups, while intense IR and weak Raman peaks near 1400 cm1are due to the antisymmetricstretch-ing mode (
m
3). Infrared modes near 800 cm1are derived from the out-of-plane bend (m
2). Infrared and Raman modes around 700 cm1region are due to the in-plane bending mode (m
4). This
mode is doubly degenerate for undistorted CO32groups[11]. As
the carbonate groups become distorted from regular planar symme-try, this mode splits into two components[11]. Infrared and Raman spectroscopy provide sensitive test for structural distortion of CO32.
There have been very few studies of mixed anion minerals con-taining silicate and carbonate. This is the first study of the Raman and infrared spectroscopy of tilleyite. The novelty of this work rests with the application of vibrational spectroscopy to the study of the mineral tilleyite. This type of study is important as new materials based upon the tilleyite structure may be invented. As part of our comprehensive research into minerals containing oxyanions, we report the SEM with EDX and vibrational spectroscopy of tilleyite and related the spectra to the structure of the mineral.
Experimental
Samples description and preparation
The tilleyite sample studied in this work is from Kushiro, Hiba-gun, Hiroshima prefecture, Honshu Island, Japan. The mineral is part in a contact metamorphism paragenesis and occurs in asso-ciation with vesuvianite and wollastonite.
The compositions have been reported by Anthony et al. (page 192) [9]. The sample was incorporated to the collection of the Geology Department of the Federal University of Ouro Preto, Minas Gerais, Brazil, with sample code SAD-044. The sample was gently crushed and the associated minerals were removed under a stere-omicroscope Leica MZ4. Qualitative and semiquantitative chemical analysis via SEM/EDS were applied to the mineral characterization.
Scanning electron microscopy (SEM)
Experiments and analyses involving electron microscopy were performed in the Center of Microscopy of the Universidade Federal de Minas Gerais, Belo Horizonte, Minas Gerais, Brazil (http://www.microscopia.ufmg.br).
Tilleyite crystals were coated with a 5 nm layer of evaporated carbon. Secondary Electron and Backscattering Electron images were obtained using a JEOL JSM-6360LV equipment. Qualitative and semi-quantitative chemical analyses in the EDX mode were performed with a ThermoNORAN spectrometer model Quest and was applied to support the mineral characterization.
Raman microprobe spectroscopy
Crystals of tilleyite were placed on a polished metal surface on the stage of an Olympus BHSM microscope, which is equipped with
10, 20, and 50 objectives. The microscope is part of a Renishaw 1000 Raman microscope system, which also includes a monochromator, a filter system and a CCD detector (1024 pixels). The Raman spectra were excited by a Spectra-Physics model 127 He–Ne laser producing highly polarized light at 633 nm and col-lected at a nominal resolution of 2 cm1 and a precision of
±1 cm1in the range between 200 and 4000 cm1. Repeated
acqui-sitions on the crystals using the highest magnification (50) were accumulated to improve the signal to noise ratio of the spectra. Raman spectra were calibrated using the 520.5 cm1line of a
sili-con wafer. The Raman spectrum of at least 10 crystals was col-lected to ensure the consistency of the spectra.
An image of the tilleyite crystals measured is shown in the Supplementary information as Fig. S1. Clearly the crystals of til-leyite are readily observed, making the Raman spectroscopic mea-surements readily obtainable.
Infrared spectroscopy
Infrared spectra of tilleyite were obtained using a Nicolet Nexus 870 FTIR spectrometer with a smart endurance single bounce
dia-mond ATR cell. Spectra over the 4000–525 cm1 range were
obtained by the co-addition of 128 scans with a resolution of 4 cm1 and a mirror velocity of 0.6329 cm/s. Spectra were
co-added to improve the signal to noise ratio.
Spectral manipulation such as baseline correction/adjustment and smoothing were performed using the Spectracalc software package GRAMS (Galactic Industries Corporation, NH, USA). Band component analysis was undertaken using the Jandel ‘Peakfit’ soft-ware package that enabled the type of fitting function to be selected and allows specific parameters to be fixed or varied accordingly. Band fitting was done using a Lorentzian–Gaussian cross-product function with the minimum number of component bands used for the fitting process. The Lorentzian–Gaussian ratio was maintained at values greater than 0.7 and fitting was under-taken until reproducible results were obtained with squared corre-lations ofr2greater than 0.995.
Results and discussion
Chemical characterization
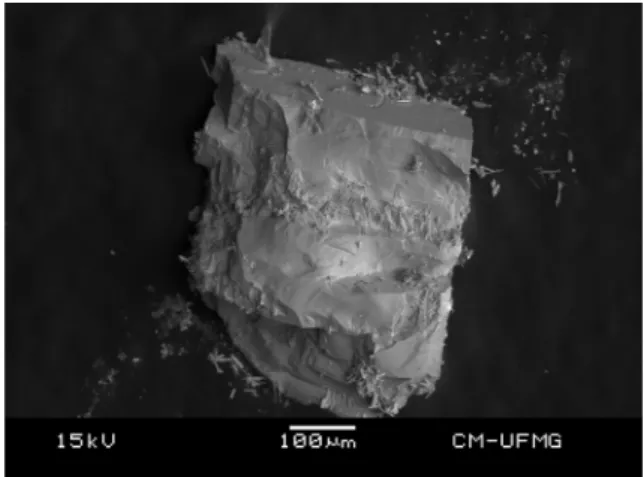
The SEM image of tilleyite sample studied in this work is shown inFig. 1. The image shows a fragment of a single crystal up to 0.5 mm. The fragment shows irregular and conchoidal fractures. The chemical analysis is provided in Fig. 2. The chemical
composition of the measured mineral sample shows the presence of Ca, C and Si. Minor amounts of Al were also observed.
Vibrational spectroscopy
Vibrational spectroscopy of tilleyite
The Raman spectrum of tilleyite in the 4000–100 cm1spectral
range is displayed inFig. 3a. This spectrum shows the position and relative intensities of the Raman bands. It is noted that there are
large parts of the spectrum where no intensity or minimal inten-sity is observed. Thus, the spectrum is subdivided into subsections depending upon the type of vibration being studied. The infrared spectrum of tilleyite in the 4000–500 cm1 spectral region is
shown in Fig. 3b. This figure shows the position of the infrared bands and their relative intensities. This spectrum displays the position and relative intensities of the infrared bands. As for the Raman spectrum, there are parts of the spectrum where little or no intensity is observed.
The Raman spectrum of tilleyite over the 1150–950 cm1
spec-tral range is reported in Fig. 4a. An intense Raman band at 1086 cm1with shoulder bands at 1080 and 1093 cm1is assigned
to the CO32
m
1 symmetric stretching mode [12–14]. Thus, there appears to be bands attributable to more than one symmetric stretching modes of the carbonate anion. One interpretation of this fact is that there are two distinct non-equivalent carbonate units in the structure of tilleyite. Two broad very low intensity Raman bands at 1047 and 1067 cm1 are attributed to the Si2O7
m
3 antisymmetric stretching mode. Other Raman bands are observed at 986, 999, 1010 and 1018 cm1. It is thought that some of thesebands are due to the Si2O7
m
1symmetric stretching mode[15–18]. The infrared spectrum of tilleyite over the 1150–650 cm1spec-tral range is shown inFig. 4b. The infrared spectrum is complex to say the least. In this spectrum, there are three distinct spectral fea-tures (a) the set of infrared bands centred upon 1060 cm1, (b) the
infrared bands around 873 cm1 and (c) the set of overlapping
bands between 650 and 750 cm1. The infrared bands are quite
well resolved. The set of infrared bands at 1020, 1037, 1060, 1080 and 1084 cm1are assigned to the CO
3
2antisymmetric and
symmetric stretching modes[16–18]. The infrared bands at 697, Fig. 2.EDX analysis of tilleyite.
Fig. 3.(a) Raman spectrum of tilleyite over the 100–4000 cm1spectral range (upper spectrum) (b) Infrared spectrum of tilleyite over the 500–4000 cm1spectral range (lower spectrum).
Fig. 4.(a) Raman spectrum of tilleyite (upper spectrum) in the 950–1150 cm1 spectral range and (b) infrared spectrum of tilleyite (lower spectrum) in the 650– 1150 cm1spectral range.
703 and 713 cm1are assigned to the CO 3 2
m
2bending modes. The
strong infrared bands at 918, 848, 973 and 998 cm1are
consid-ered to be associated with Si2O7 antisymmetric and symmetric
stretching modes.
The Raman spectrum of tilleyite over the 600–350 cm1
spec-tral range is reported in Fig. 5a. The Raman bands at 450, 456, 483, 493, 505, 528, 546 and 572 cm1 are assigned to the Si
2O7
m
4 bending modes. In the infrared spectrum (Fig. 4b), the series of low intensity bands at 687, 703 and 713 cm1 may also beattributed to this vibrational mode. The series of Raman bands at 589, 611, 674 and 689 cm1are assigned to the CO
3 2
m
2bending
modes[12–18]. In the Raman spectrum (Fig. 5b), the low intensity bands at 155, 176, 182, 197, 204, 234, 260. 273, 282, 295, 302, 321 and 329 cm1are attributed to lattice vibrational modes.
The Raman spectrum of tilleyite over the 3700–3500 cm1
spectral range is shown in Fig. 6a. The spectrum shows well resolved Raman bands with well resolved bands at 3574, 3578, 3594, 3629, 3635 and 3638 cm1. The first two bands at 3574
and 3594 cm1 are assigned to water stretching vibrations. The
Raman bands at 3629, 3635 and 3638 cm1are attributed to the
stretching vibrations of hydroxyl units. The observation of bands in the OH stretching region brings into question the actual formula of tilleyite. The Raman spectrum in this spectral region shows the presence of water and OH units in the structure of tilleyite. These observations are confirmed by the bands in the OH stretching region in the infrared spectrum.
The infrared spectrum of tilleyite over the 2800–3800 cm1
spectral range is shown inFig. 6b. Infrared bands are resolved at 3575, 3590, 3625 and 3635 cm1. These bands are attributed to
water and OH stretching vibrations. The infrared bands at 2851, 2919 and 2938 cm1are assigned to the stretching vibrations of
organic impurities.
The Raman spectrum of tilleyite over the 1800–1400 cm1
spectral range is shown inFig. 7a. Raman bands are observed at 1412, 1432, 1436, 1442 and 1501 cm1. These bands are assigned
to the CO32
m
3 antisymmetric stretching modes. Intense Raman bands are also noted at 1838, 1748 and 1752 cm1. Theobserva-tion of multiple bands in this spectral region is in harmony with the number of Raman bands in the OH stretching region (Fig. 6a). These bands show that water exists in the structure of tilleyite in different molecular environments with differing bond strengths. The infrared spectrum of tilleyite over the 1850–1700 cm1
spec-tral range is shown inFig. 7b. Infrared bands are found at 1776, 1795 and 1812 cm1.
Studies have shown a strong correlation between OH stretching frequencies and both O O bond distances and H O hydrogen
bond distances [19–24]. [20] showed that a regression
function can be employed relating the hydroxyl stretching frequencies with regression coefficients better than 0.96 using
infrared spectroscopy [24]. The function is described as:
m
1¼ ð3592304Þ 109 dðO—OÞ0:1321 cm
1. Thus OH
O hydrogen bond distances may be calculated using the Libowitzky empirical func-tion. The values for the OH stretching vibrations detailed above provide hydrogen bond distances of 0.2735 pm (3279 cm1),
0.27219 pm (3237 cm1). Frueh and Golightly suggested some
hydrogen bonding exists for tilleyite[24]. The values calculated here, support the concept of strong hydrogen bonding between the OH units and the carbonate anions in the tilleyite structure. Fig. 5.(a) Raman spectrum of tilleyite (upper spectrum) in the 350–600 cm1
spectral range and (b) Raman spectrum of tilleyite (lower spectrum) in the 100– 350 cm1spectral range.
Conclusions
The physical properties of the mineral tilleyite have not been forthcoming. In this work the mineral tilleyite from Japan was analysed using a combination of SEM with EDX and vibrational spectroscopy. EDX analysis shows the presence of Ca, C, Si and minor amounts of Al in substitution to Si.
Raman and infrared bands are attributed to the symmetric and antisymmetric stretching modes and bending modes of the CO32and Si2O7units. The mineral tilleyite is characterised by
mul-tiple CO32stretching and bending modes, giving credence to the
existence of more than one non-equivalent unit in the tilleyite structure. Intense Raman band at 1086 cm1with shoulder bands
at 1080 and 1093 cm1 is assigned to the CO 3 2
m
1 symmetric
stretching mode. Two broad very low intensity Raman bands at 1047 and 1067 cm1are attributed to the Si
2O7
m
3antisymmetric stretching mode. Raman bands at 765 and 775 cm1are assignedto the CO32
m
4 bending modes and Raman bands at 589, 611, 674 and 689 cm1 are assigned to the CO3 2
m
2 bending modes.
The Raman and infrared spectrum of tilleyite in the water OH stretching and water bending region shows multiple bands thus providing evidence for the existence of water in the structure of til-leyite in different molecular environments with different hydrogen bond strengths.
Acknowledgements
The financial and infra-structure support of the Discipline of Nanotechnology and Molecular Science, Science and Engineering Faculty of the Queensland University of Technology, is gratefully acknowledged. The Australian Research Council (ARC) is thanked for funding the instrumentation.
Appendix A. Supplementary data
Supplementary data associated with this article can be found, in the online version, athttp://dx.doi.org/10.1016/j.saa.2015.04.015.
References
[1]E.S. Larsen, K.C. Dunham, Am. Mineral. 18 (1933) 469–473.
[2]B. Jamtveit, S. Dahlgren, H. Austrheim, Am. Mineral. 82 (1997) 1241–1254. [3]S. Marincea, D.-G. Dumitras, N. Calin, A.M. Anason, A.M. Fransolet, F. Hatert,
Can. Mineral. 51 (2013) 359–375.
[4]M.F. Taner, R.F. Martin, R.A. Gault, Can. Mineral. 51 (2013) 893–911. [5]V.A. Zharikov, D.K. Vlasova, N.N. Pertsev, Tipomorfizm Miner, Ego Prakt.
Znachenie, 1972. pp. 194–201.
[6]J.V. Smith, Acta Crystallogr. 6 (1953) 9–18.
[7]S.J. Louisnathan, J.V. Smith, Z. Kristallogr. Kristallgeometrie Kristallphys. Kristallchem. 132 (1970) 288–306.
[8]J.D. Grice, Can. Mineral. 43 (2005) 1489–1500.
[9]J.W. Anthony, R.A. Bideaux, K.W. Bladh, M.C. Nichols, Handbook of Mineralogy, Mineral Data Publishing, Tuscon, Arizona, USA, 2003.
[10] K. Nakamoto, Bunko Kenkyu 5 (1957) 3–13.
[11]K. Nakamoto, J. Fujita, S. Tanaka, M. Kobayashi, J. Am. Chem. Soc. 79 (1957) 4904–4908.
[12]A. Lopez, R.L. Frost, Y. Xi, R. Scholz, Spectrosc. Lett. 47 (2014) 564–570. [13]R.L. Frost, Y. Xi, R. Scholz, A. Lopez, F.M. Belotti, J. Mol. Struct. 1042 (2013) 1–7. [14]R.L. Frost, J. Raman Spectrosc. 42 (2011) 1690–1694.
[15]R.L. Frost, B.J. Reddy, S. Bahfenne, J. Graham, Spectrochim. Acta A 72 (2009) 597–604.
[16]R.L. Frost, S. Bahfenne, J. Raman Spectrosc. 40 (2009) 360–365. [17]R.L. Frost, M.J. Dickfos, J. Cejka, J. Raman Spectrosc. 39 (2008) 582–586. [18]R.L. Frost, M.J. Dickfos, J. Raman Spectrosc. 38 (2007) 1516–1522. [19]J. Emsley, Chem. Soc. Rev. 9 (1980) 91–124.
[20] H. Lutz, Struct. Bond. 82 (1995) 85–103. [21]W. Mikenda, J. Mol. Struct. 147 (1986) 1–15. [22]A. Novak, Struct. Bond. 18 (1974) 177–216.
[23]E. Libowitsky, Monatsh. Chem. 130 (1999) 1047–1049. [24]A.J. Frueh Jr., J.P. Golightly, Can. Mineral. 9 (1967) 51–56. Fig. 7.(a) Raman spectrum of tilleyite (upper spectrum) in the 1400–1800 cm1
spectral range and (b) infrared spectrum of tilleyite (lower spectrum) in the 1700– 1850 cm1spectral range.