THE MILLENNIAL GENERATION: A STUDY ON DIGITAL
CONSUMPTION OF PORTUGUESE YOUTH
Inês Amaral
1, Paula Lopes
2, Célia Quintas
3, Bruno Reis
41
Centro de Estudos de Comunicação e Sociedade da Universidade do Minho / Universidade
Autónoma de Lisboa / Instituto Superior Miguel Torga (PORTUGAL)
2
Centro de Estudos de Comunicação e Sociedade da Universidade do Minho / Universidade
Autónoma de Lisboa (PORTUGAL)
3
Universidade Autónoma de Lisboa / Instituto Politécnico de Setúbal (PORTUGAL)
4Universidade Autónoma de Lisboa (PORTUGAL)
Abstract
The research project "Digital Rights: A password for the future" is framed within the context of an 18 lecture series in district capitals of Portugal on consumptions, digital literacy and rights. The project aimed to identify digital literacy as well as practices and media consumption, understand perceptions of new media, explain risk situations on the Internet and provide information about of rights and duties in the digital world.
In this paper we present the results of the project "Digital Rights: A password for the future", developed by a group of researchers from the Autonomous University of Lisbon in partnership with DECO, and describe indicators of digital consumption of young Portuguese students. By analysing the most common activities online, digital practices, digital consumption and behaviour on social networks, our aim is to describe the ‘Millennial Generation’ in an era of screens and mobility.
Keywords: Digital Consumption; Digital Practices; Digital Media; Audiences Practices.
1 INTRODUCTION
Digital media are integrated into everyday life and digitally mediated production is transforming social environments, as it creates new mechanisms for socially interventional participation. Social media services have transformed the way people communicate and interact with others online. The Web is social: new platforms allow users to become prosumers. The key concept that describes the paradigm shift promoted by the social Web is simple: user-created content.
Digital competence is assumed as “a transversal key competence”, enabling the acquisition of other key competences” and has been broadly defined by the European Commission as “the confident, critical and creative use of ICT to achieve goals related to work, employability, learning, leisure, inclusion and/or participation in society” [1]. In this paper, we assume digital competence as the skills that enable digital capital.
According to Martin [2], digital literacy “is the awareness, attitude and ability of individuals to appropriately use digital tools and facilities to identify, access, manage, integrate, evaluate, analyse and synthesize digital resources, construct new knowledge, create media expressions, and communicate with others, in the context of specific life situations, in order to enable constructive social action; and to reflect upon this process”. In this paper, we assume digital literacy as the skills and acquisition processes of digital competence, which enables digital capital.
The research project "Digital Rights: A password for the future" was framed within the context of an 18 lecture series in district capitals of Portugal on consumptions, digital literacy and rights. The project aimed to identify digital literacy as well as practices and media consumption, understand perceptions of new media, explaining risk situations on the Internet and provide information about of rights and duties in the digital world.
Assuming the focus on the dimensions and indicators to evaluate the levels of digital literacy, consumption and the perception of rights in the digital space, this paper evaluates a possible direct relation between practices and technical skills. The objectives are to discuss if (1) the most common online activities induce digital practices that have direct relationships with creative and communication skills; (2) the network sociability is related to technical skills. In this paper, we present the results of the project "Digital rights: A password for the future", developed by a group of researchers from the
Autonomous University of Lisbon in partnership with DECO, and we describe indicators of digital practices and consumption of young Portuguese students. By analysing the most common online activities, digital practices, digital consumptions and behaviours in social networks, our goal is to describe Millennium generation in an age of screens and mobility. Therefore, this paper presents a discussion about the empirical data and tries to evaluate a possible direct relationship between digital consumption and social practices.
2 METHOD
The empirical research was carried out through an extensive-quantitative methodology, by applying a survey between March 2014 and January 2015 to 1814 students attending the Basic Education (3rd cycle), Secondary Education and Vocational Education in schools in 18 capitals of Portugal Continental districts.
2.1 Sample
The convenience sample is not statistically representative of the population (students in basic, secondary, and vocational education in mainland Portugal).
The sample is made up of 1814 individuals who are students of basic education - 3rd cycle, secondary or professional, and attend schools in one of the 18 district capitals of mainland Portugal in the academic years 2013-2014 and 2014-2015. 14.3% of the respondents are attending elementary education, 43.8% are in secondary education and 41.9% are in vocational education in the school years indicated. There is a slight male dominance: 52.2%. The average age is 16 years and about 90% of the sample is minor - under 18 years of age.
Regarding the schooling (last year concluded) of the family of origin, it is recorded that there are still 26 cases of parents who cannot read or write, and 381 cases of parents with studies up to the 4th year. In this sample, there are more mothers than fathers with a course of High School or Higher (26.5% to 20.8%). It should also be noted that 54.6% of the mothers have at least the complete Secondary Education. Most fathers and mothers of these respondents are employed. It should be noted, however, that the percentage of unemployed persons is much more pronounced among women.
The profile of school education of the nuclear family of origin revealed that the students of primary and secondary teachings are children of fathers and mothers who completed mostly at least secondary education. The percentage of fathers of students attending Basic Education with a medium or higher course is equal to 22.4%. As for the mothers of these students, the percentage rises to 29.1%. The percentage of fathers of students attending Secondary School with an average or higher course is equal to 32.2%. As for the mothers of these students, the percentage rises to 39.9%. About 65% of the students of the Professional Education are children of parents with, at the most, the 9th year of schooling; about 55% of these students are children of mothers up to the 9th grade. The percentage of fathers of students attending vocational education with a course of high school or higher is 9%. As for the mothers of these students, the percentage rises to 12.5%.
2.2 Instruments
The operationalization of empirical research was based on the extensive questionnaire survey. This methodological tool was developed by a group of researchers from the Department of Communication Sciences of the Autonomous University of Lisbon, based on the crossing of several sources of information. The most important were the EU Kids Online [3; 4; 5; 6; 7] survey and several studies under the responsibility of the British Office of Communications [8; 9; 10, 11], the Portuguese Observatory of Communication [12; 13; 14; 15; 16; 17; 18; 19] and the Brazilian NGO SaferNet. In its final version, the questionnaire contained 27 questions, grouped into the following thematic blocks: (1) Socio-demographic data and family background; (2) Digital practices; (3) Risks and vulnerabilities in the digital world. In this paper we will analyse only the digital practices – access, use the Internet, activities,
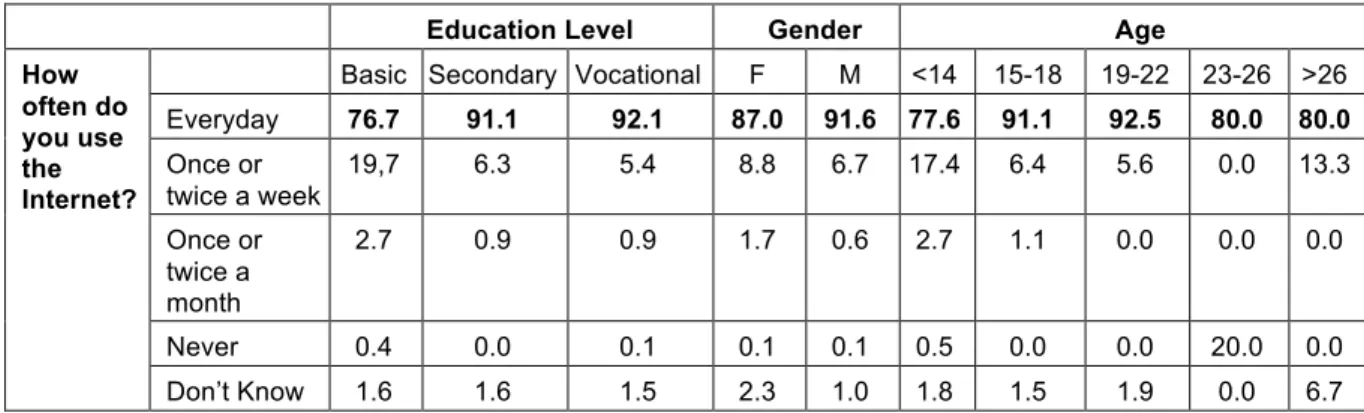
every day attend mainly secondary and vocational education, are boys and are between the ages of 15 and 22, as showed in table 1.
Table 1. Use of the Internet
Education Level Gender Age
How often do you use the Internet?
Basic Secondary Vocational F M <14 15-18 19-22 23-26 >26 Everyday 76.7 91.1 92.1 87.0 91.6 77.6 91.1 92.5 80.0 80.0 Once or twice a week 19,7 6.3 5.4 8.8 6.7 17.4 6.4 5.6 0.0 13.3 Once or twice a month 2.7 0.9 0.9 1.7 0.6 2.7 1.1 0.0 0.0 0.0 Never 0.4 0.0 0.1 0.1 0.1 0.5 0.0 0.0 20.0 0.0 Don’t Know 1.6 1.6 1.5 2.3 1.0 1.8 1.5 1.9 0.0 6.7
The average Internet usage is 253 minutes per day, as presented in figure 1. About 40% of students claim to be online for up to 2 hours a day, but there are almost 10% who take up surfing the web daily for more than 8 hours. In this situation, there are more boys and more students of Vocational Education. These data may suggest dependency or tendency for an additive use of the Internet.
Figure 1 – Time online (n = 1814)
We also found out that 91.8% of respondents claim to access to the Internet with a laptop. The second most often used device is the mobile phone (by 79.3% of respondents) and, thirdly, the tablet (gathering 38.7% of preferences). It should be noted that the project EU Kids Online has pointed out, over the years, young Portuguese as European leaders in Internet access with laptops. It is also interesting to highlight that the tablet is a device most used by younger students attending Basic Education.
The preferred activities of the respondents are listening to music online (59.7%), watching movies/series/videos online (56%) and participating in social networks (51.6%) - all activities in the entertainment area, as showed in tab. 2. Less favourite activities are those that require some proactivity in content production and management: maintaining a website (2.6%), keeping a blog (3.9%), posting videos on the Internet (4.7%), editing multimedia content (5.2%), share content with hashtags (6%) or upload music on the Internet (6.4%). Listening to music online is the activity most often identified by students in Basic and Professional education and mainly by girls. The choice of male students and high school students is to "watch videos / series / movies online". There are very few respondents to identify content production and editing activities. Indeed, the percentage is residual and never more than 10%.
Table 2. Three favourite activities on the Internet (n = 1814)
Activity Fi %
Watch videos / series / movies online 1015 56.0
Participate on social networks 936 51.6
Play online 780 43
Download music from the Internet 397 21.9 Search information that interests me 379 20.9 Download videos / series / movies from the Internet 325 17.9 Participate in online chats 322 17.8 Publish / Share information on my profile on social networks 304 16.8 Search information for a school project 285 15.7 Search for news 247 13.6 Download software from the Internet 213 11.7 Do online phone calls 182 10 Send and receive email 177 9.8
Upload pictures 167 9.2
Edit images 169 9.3
Watch TV online 148 8.2
Listen to online music 1083 59.7
Publish / Share content on the Internet 145 8 Publish / Share content with hashtags 108 6
Upload music 116 6.4
Upload videos 86 4.7
Keep a weblog 70 3.9
Keep a website 48 2.6
Edit multimedia content 95 5.2
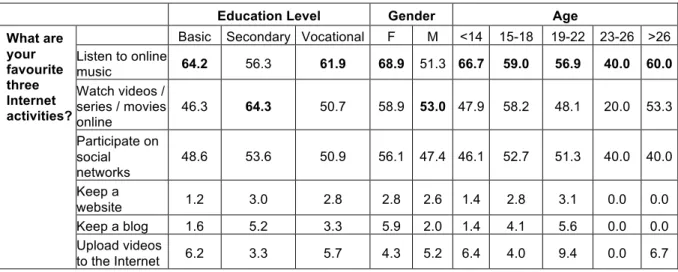
The results show that, on a daily basis, these young people participate in social networks (64.3%), listen to online music (60.5%) and play online (30.4%). Search news online every day is still a minority practice: daily, only 23.2% of respondents claim to do so. However, if we add to this value the search for online news at least once a week, the figure rises to 51.9%. The "search for information on different sites" and the "comparison of information on different sites" are not very expressive practices in this sample: only 14.3% of the students report searching for information on different sites every day and only 9.1% assume that they compare it.
There are more girls and more respondents attending Secondary School to participate daily in social networks. Still on a daily basis, there are more respondents boys, over the age of 26 and students attending Vocational Education preferring to "listen to music online" every day, as showed in tab. 3.
Table 3. Activities on the Internet on a daily basis
Education Level Gender Age
What are your favourite three Internet activities?
Basic Secondary Vocational F M <14 15-18 19-22 23-26 >26 Listen to online music 64.2 56.3 61.9 68.9 51.3 66.7 59.0 56.9 40.0 60.0 Watch videos / series / movies online 46.3 64.3 50.7 58.9 53.0 47.9 58.2 48.1 20.0 53.3 Participate on social networks 48.6 53.6 50.9 56.1 47.4 46.1 52.7 51.3 40.0 40.0 Keep a website 1.2 3.0 2.8 2.8 2.6 1.4 2.8 3.1 0.0 0.0
As expected, the daily demand for online news tends to increase as schooling increases. There are many more male respondents searching for this type of information on a daily basis (isolating students who say they are looking for this type of information on a daily basis, 71.5% from boys to 28.5% from girls).
"Searching for information on different websites" and "comparing information on different websites" are also more commonly identified by boys. These activities tend to also increase as the level of education increases.
Table 4. Search for information online
Where do you search for information and how often?
Education Level Gender Age
Search for News
Basic Secondary Vocational F M <14 15-18 19-22 23-26 >26 Everyday 17.9 24.1 24.2 13.9 31.5 19.3 23.0 30.7 0.0 20.0 Every week 19.9 31.1 29.0 28.3 28.9 18.4 29.7 33.3 0.0 46.7 Every month 8.1 17.1 14.9 16.4 13.5 9.4 15.8 13.3 0.0 13.3 At least once per month 21.1 16.3 16.3 23.3 11.6 21.2 16.7 16.7 0.0 6.7 Never 24.8 6.7 10.8 11.7 10.5 24.1 9.8 2.7 66.7 13.3 Don’t know 8.1 4.6 4.9 6.5 4.1 7.5 5.0 3.3 33.3 0.0 Search information in different websites Everyday 12.9 14.2 15.1 10.8 17.3 14.4 13.3 20.8 25.0 33.3 Every week 25.7 34.3 35.1 35.9 31.3 25.4 34.1 40.9 50.0 26.7 Every month 19.1 30.8 23.4 27.0 25.6 18.7 27.7 23.5 0.0 20.0 At least once per month 18.3 10.9 9.9 10.9 12.0 16.7 11.2 8.1 0.0 0.0 Never 10.4 4.3 7.3 6.9 5.9 10.5 6.2 2.0 0.0 13.3 Don’t know 13.7 5.5 9.2 8.4 7.9 14.4 7.6 4.7 25.0 6.7 Compare information in different websites Everyday 8,6 9.2 9.3 6.7 11.3 8.1 8.2 17.2 25.0 20.0 Every week 18.4 27.0 29.5 25.9 27.4 17.1 28.4 27.6 25.0 26.7 Every month 15,1 28.0 21.5 24.5 22.9 15.7 24.7 24.1 0.0 26.7 At least once per month 18.4 14.3 12.5 13.9 14.4 16.7 14.0 13.8 0.0 0.0 Never 29.0 13.2 16.1 19.2 14.2 31.0 15.4 7.6 25.0 13.3 Don’t know 10.6 8.3 11.1 9.9 9.8 11.4 9.4 9.7 25.0 13.3
Respondents reveal that they do the search for information is on Google, as presented in fig. 2. Almost half of young people indicate this search engine as "the site they are looking for information on". Wikipedia ranks second in information searches (21.6%) and social networks in third place (3.4%). It should be noted that general news sites were identified by only 2.1% of the population surveyed in this study. There are more girls, more vocational students and older students to "trust" in Google. Wikipedia is more commonly used by boys than by girls and more by secondary school students than by their Basic or Professional colleagues.
Figure 2 – Websites for search information (n = 1814)
Most of the students surveyed (69.3%) report having only one active profile and having less than 1,000 friends (70.6%), as indicated in figures 3 and 4.
!"#$ %&#$ !#$ '$()*+,-$ .*)-$/012$'$3)*+,-$ 4*$3)*+,-$
Figure 3 – Profiles in social networks
!"#$
"%#$
%#$
&#$
'#$
"#$
"(")))$
"))"(&)))$
&))"(*)))$
*))"(')))$
'))"(+)))$
,$+)))$
Figure 4 – Friends in social networks!"#$ %&#$ %'#$ "#$ '#$ !#$ ()*+,--.$ /012+3$ 4567)83)9$ /:9,;3$ <-:/:,+$ =5)>*?)7$
Figure 5 – Profile on social networks
The identification of Facebook by the respondents is totally homogenous: there are no contrasting differences depending on the level of education, sex or age (all values are above 80%). Twitter and Instagram are social networks most used by secondary school students, by girls and by respondents between 15 and 18 years old.
Table 5. Profile on social networks by educational level, gender and age
Social Networks Education Level Gender Age
Basic Secondary Vocational F M <14 15-18 19-22 23-26 >26
Facebook 84.4 85.9 86.2 87.6 83.5 82.6 86.5 81.3 80.0 86.7
Twitter 24.1 36.7 26.6 35.3 26.4 23.3 33.8 13.8 20.0 26.7
Instagram 21.0 28.9 23.7 33.1 18.6 22.4 27.1 20.0 0.0 6.7
Respondents provide on social networks many and diverse information: photographs of themselves (81.3%), real name (76%), the nickname (61.5%), their preferences (56.3%), photos of friends (55.9%), the true age (52.3%), the name of the school (51.6%). There is even a small group of young people who reveal the mobile phone number (6%) and the home address (5.4%), as showed in tab. 6.
Table 6. Information shared on social networks (n = 1814)
Information Fi % Photographs of themselves 1475 81.3 Photographs of friends 1014 55.9 Real name 1378 76.0 Real surname 1116 61.5 True age 949 52.3 False age 293 16.2
Name of the school 936 51.6
Address 98 5.4
Phone number 108 6.0
Preferences 1021 56.3
None 77 4.2
The privacy settings on social networks were changed by 67.3% of these students. 22.3% of the respondents in this study never did so. We add that there are 32.5% of respondents to attend Basic Education and students up to age 14 who claim to have never changed the privacy settings on social networks. About 10% of students attending the same level of education and students in the same age group assume that they do not know how to "do this".
!"#$
%&#$
'&#$
"#$
()*+,-.$/0123451$-65$ 711$ (628+3$92,0681.$45+3$ :3$;2,15<7$65<$ ;2,15<7$4;$:3$;2,15<7$ -65$711$ (2,0681.$45+3$:3$ ;2,15<7$-65$711$ Figure 6 – Privacy settings on social networks4 CONCLUSIONS
Digital media are integrated into everyday life and digitally mediated production is transforming social environments, as it creates new mechanisms for social participation and interaction. The results of this study corroborate this idea. The results show that in all districts of mainland Portugal the frequencies of daily access to the Internet are higher than 70%. The results also revealed that almost 90% of the young respondents access the Internet every day with an average time of use of 253 minutes per day. The results show that nearly 90% of respondents surf the Internet every day. The three favourite activities in the digital world are listening to music online, watching movies/series/videos online and participating in social networks. There are very few students surveyed to identify content production and editing activities. Almost 65% of respondents claim to participate in social networks every day. Facebook is the social network most often identified. As expected, the daily demand for online news tends to increase as schooling increases. Search news online every day is still a minority practice: daily, 23.2% of respondents claim to do so. However, if we add to this value the search for online news at least once a week, the figure rises to 51.9%.
The receiver has now been converted into a user, with the possibility of personalizing and mediating communication in a collective context that assumes itself as a new universe of interaction and socialization: cyberspace. And in this sense, we conclude that the most common practices are focused on access, communication and creation, demonstrating that social media services have transformed the way young people communicate and interact with others online.
The global results of this study allow us to conclude that (1) there is a direct relationship between digital consumption and social practices, and (2) digital consumption of the so-called ‘Millennial generation’ is essentially shaped by the technological determinism of the most used platforms.
REFERENCES
[1] A. Ferrari, “DIGCOMP: A framework for developing and understanding digital competence in Europe”, 2013.
[2] A. Martin, “DigEuLit-a European framework for digital literacy: a progress report”, Journal of eLiteracy, vol. 2, nº 2, pp. 130-136, 2005.
[3] S. Livingstone, “Risks and safety on the Internet: The perspective of European children. Full findings and policy implications from the EU Kids Online survey of 9-16 year olds and their parents in 25 countries”. London: LSE, 2011.
[4] S. Livingstone, L. Kirwil, C. Ponte and E. Staksrud, “In their own words: What bothers children online?”, London: LSE, 2013.
[5] A. Barbosa, B. O'Neill, C. Ponte, S. Simões and T. Jereissati. "Risks and safety on the internet: Comparing Brazilian and European children", 2013.
[7] S. Livingstone, G. Mascheroni, K. Ólafsson and L. Haddon, "Children’s online risks and opportunities: comparative findings from EU Kids Online and Net Children Go Mobile", 2014. [8] Ofcom – Office of Communications, 2UK Children’s Media Literacy”, London: Ofcom, 2011. [9] Ofcom – Office of Communications, “Children Media Literacy in the Nations”, London: Ofcom,
2011.
[10] Ofcom – Office of Communications, “Ofcom Children and Parents Media Literacy Audit 2011”, London: Ofcom, 2012.
[11] Ofcom – Office of Communications, “Children and Parents: Media Use and Attitudes”, London: Ofcom, 2013.
[12] Obercom, “E-Generation 2008: Os Usos de Media pelas Crianças e Jovens em Portugal”, Lisboa: Obercom, 2009.
[13] Obercom, “A Utilização da Internet em Portugal”, Lisboa: Obercom, 2010.
[14] Obercom, “Nativos Digitais Portugueses: Idade, Experiência e Esferas de Utilização das TIC”, Lisboa: Obercom, 2010.
[15] Obercom, “A Sociedade em Rede 2012: A Internet em Portugal 2012”, Lisboa: Obercom, 2012. [16] Obercom, “A Sociedade em Rede 2012: A Apropriação dos Telemóveis em Portugal”, Lisboa:
Obercom, 2012.
[17] Obercom, “A Internet em Portugal: A Sociedade em Rede 2014”, Lisboa: Obercom, 2014. [18] Obercom, “A Internet e o consumo de notícias online em Portugal 2015”, Lisboa: Obercom,
2015
[19] Obercom, “Perfil sociodemográfico do consumo de notícias em Portugal”, Lisboa: Obercom, 2016.