Nereu Augusto Streck , Gizelli Moiano de Paula , Felipe Brendler Oliveira , Ana Paula Schwantes(1) and Nilson Lemos de Menezes(1)
(1)Universidade Federal de Santa Maria, Avenida Roraima, no 1.000, Bairro Camobi, CEP 97105‑900 Santa Maria, RS, Brazil. E‑mail: [email protected], [email protected], [email protected], [email protected], [email protected]
Abstract – The objective of this study was to improve the simulation of node number in soybean cultivars with determinate stem habits. A nonlinear model considering two approaches to input daily air temperature data (daily mean temperature and daily minimum/maximum air temperatures) was used. The node number on the main stem data of ten soybean cultivars was collected in a three‑year field experiment (from 2004/2005 to 2006/2007) at Santa Maria, RS, Brazil. Node number was simulated using the Soydev model, which has a nonlinear temperature response function [f(T)]. The f(T) was calculated using two methods: using daily mean air temperature calculated as the arithmetic average among daily minimum and maximum air temperatures (Soydevtmean); and calculating an f(T) using minimum air temperature and other using maximum air temperature
and then averaging the two f(T)s (Soydevtmm). Root mean square error (RMSE) and deviations (simulated minus
observed) were used as statistics to evaluate the performance of the two versions of Soydev. Simulations of node number in soybean were better with the Soydevtmm version, with a 0.5 to 1.4 node RMSE. Node number can be
simulated for several soybean cultivars using only one set of model coefficients, with a 0.8 to 2.4 node RMSE. Index terms: Glycine max, node appearance rate, vegetative development, V-stages.
Melhoria na simulação do número de nós em soja
Resumo – O objetivo deste trabalho foi melhorar a simulação do número de nós em cultivares de soja de hábito de crescimento determinado. Foi utilizado um modelo não linear que considera duas abordagens para entrada dos dados de temperatura diária do ar (temperatura média diária e temperaturas mínima/máxima diárias). Foram usados dados de número de nós na haste principal de dez cultivares de soja coletados em um experimento de campo durante três anos (de 2004/2005 a 2006/2007) em Santa Maria, RS. O número de nós foi simulado com o modelo Soydev, que tem uma função não linear de resposta à temperatura [f(T)]. A f(T) foi calculada por dois métodos: pela temperatura média diária do ar, determinada pela média aritmética entre as temperaturas mínima e máxima diárias (Soydevtmédia), e pela média entre os valores das f(T)s da temperatura
mínima do ar e da temperatura máxima do ar (Soydevtmm). A raiz do quadrado médio do erro (RQME) e os
desvios (simulado menos observado) foram as estatísticas usadas para avaliar o desempenho das duas versões do Soydev. A simulação do número de nós em soja foi melhor com a versão Soydevtmm, com um RQME de 0,5
a 1,4 nós. O número de nós pode ser simulado em várias cultivares de soja usando-se apenas um conjunto de coeficientes, com uma RQME entre 0,8 e 2,4 nós.
Termos para indexação: Glycine max, taxa de aparecimento de nós, desenvolvimento vegetativo, estádios-V.
Introduction
The calculation of node appearance rate (NAR) is an important part of simulation models for soybean [Glycine max (L.) Merrill] growth, development and yield (Jones & Laing, 1978; Sinclair, 1986; Sinclair
et al., 2005). Integrating NAR over time results in the
accumulated number of nodes on a stem (NN), which is an excellent measurement for plant development (Streck et al., 2006). The NN is also related to the timing of the developmental stages. In the most widely used phenology staging system for soybean by
Fehr & Caviness (1977), vegetative development (VD) is described by assigning a number based on the status of the leaf on a node above it. The VD is coded as V-stages, so that VC = cotyledonary stage (the edges of the unifoliate leaf pair are not touching), V1 = unifoliate leaf pair is expanded and the edges of
the first trifoliolate leaf are not touching, and so forth
until Vn = the last main stem node. Other developmental
stages in soybean, such as R1 (beginning of flowering), R3 (beginning pod), and R5 (beginning seed) are also
to the end of node appearance) overlaps the reproductive phase (from R1 to physiological maturity) (Johnson, 1997). The NN is also related to the expansion of leaf area index (Sinclair, 1986).
There are several models to simulate soybean
development (Major et al., 1975; Jones & Laing, 1978;
Piper et al., 1996; Jones et al., 2000; Wolf, 2002). Setiyono et al. (2007) developed a soybean phenology model, named Soydev model, in which developmental
events are simulated considering five main phases: emergence, main stem node appearance, flowering,
pod and seed set, and maturity. Soydev is a model that assembles the current knowledge about the response of soybean development to environmental factors. For the main stem node appearance phase in Soydev, temperature drives development and the temperature response function [f(T)] is calculated using a nonlinear beta function. Simulation of V-stages of 20 soybean cultivars in the Central Great Plains of the USA using Soydev improved when compared to the simulations using the Cropgro model, which uses a linear spline function for [f(T)] (Jones et al., 2000).
Soydev was calibrated and evaluated for two types of stem termination soybean groups (indeterminate and semi-determinate) grown under non-limiting water and nutrient conditions in a high-latitude temperate region (Setiyono et al., 2007). Commercial soybean cultivars currently grown in Brazil are adapted for low-latitude tropical and subtropical environments, have determinate
stem termination habits (Sinclair et al., 2005) and are
mainly grown under rainfed conditions. Thus, further calibration and evaluation of the Soydev model under Brazilian conditions is required, which constituted one rationale for this study.
Another rationale for this study is related to the calculation of f(T). There are two approaches to input daily temperature data for f(T): calculating the daily mean temperature (Tmean, calculated as the average of minimum and maximum daily temperatures or as the average of 24-hour temperatures) and then using the Tmean to calculate one daily f(T) (Streck et al., 2003a, b; Streck et al., 2006; Martins & Streck, 2007; Streck et al., 2007, 2008b); and calculating f(T) for each daily temperature (minimum and maximum temperature or 24-hour values) and then averaging the f(T) values, thus obtaining a daily mean f(T) (Xue et al., 2004; Streck et al., 2008c). The latter approach works better when air temperatures are near the cardinal temperatures
(Streck et al., 2008c). Soydev uses the former approach for f(T) (Setiyono et al., 2007), but when soybean is grown in low latitude and under rainfed conditions, like in Brazil, it is expected that air temperatures during the growing season fall into the supra-optimum temperature range more often than in the high-latitude and irrigated conditions with which Soydev was calibrated and evaluated. Therefore, calculating f(T) based on daily minimum and maximum air temperature might improve the simulation of soybean NN using Soydev under Brazilian conditions in comparison to the original version of the model.
The objective of this study was to improve the node number simulation in determinate stem termination habit soybean cultivars.
Materials and Methods
The data used in this study were from a three-year
field experiment using ten soybean cultivars with
determinate stem termination habits (Table 1), conducted at Departamento de Fitotecnia, Universidade Federal de Santa Maria, Santa Maria, RS, Brazil (29o43'S,
53o43'W, 95 m altitude), during the 2004/2005,
2005/2006 and 2006/2007 growing seasons. This
region has a wet subtropical climate with warm summers (Cfa formula according to Köppen System). The soil type at the experimental site was an Argissolo Bruno-Acinzentado alítico úmbrico (Rhodic Paleudalf) (Streck et al., 2008a). Tillage consisted of plowing and disking for seedbed preparation. Weeds were controlled by manual hoeing, and insects and diseases were controlled by spraying chemical insecticides and fungicides in order to avoid stress by biotic factors. Six
cultivars were used in the 2004/2005 growing season, five cultivars in the 2005/2006 growing season and
two cultivars in the 2006/2007 growing season totaling
ten cultivars (CD 205 was used in all three years and
CD 209 was used in the last two years) with distinct developmental cycles, varying from early to mid-late maturation (Table 1).
The experimental design was a completely randomized block with two replicates (plots with three
3 m‑long rows and 0.5 m spacing between rows) in 2004/2005 and three replicates (plots with four 4 m‑long rows and 0.5 m spacing between rows) in 2005/2006. Plant density in 2004/2005 and in 2005/2006 was of
cultivars (CD 205 and CD 209) and three plant densities
(24, 32 and 40 plants m-2) were arranged in a factorial
scheme with three replicates (plots with four 4 m-long
rows with 0.5 m spacing between rows). Fertilization
followed local recommendations.
The sowing dates were December 3rd, 2004; November
23rd, 2005 and December 2nd, 2006 in the three growing
seasons, respectively, which are within the recommended sowing period for this region (Reunião de Pesquisa de Soja da Região Sul, 2007). Emergence was determined in each plot by counting the number of visible plants above soil surface on a daily basis. The date of emergence was
the average among the dates when 50% of plants with
cotyledons appeared above soil surface in each plot. One
week after emergence, five plants in the center row in the 2004/2005 growing season, and six plants in the two center rows in the 2005/2006 and 2006/2007 growing
seasons were randomly selected and tagged with colored wires. In these selected plants, the number of visible nodes (NN) on the main stem was counted three times a week (every other day, from Monday to Friday). A node was assumed visible when the edges of at least one of the foliolates of the leaf associated to the node were not touching (Johnson, 1997). The NN was considered the
average of the tagged plants. The final node number
(FNN) on the main stem of the tagged plants was counted at the end of the experiment.
Daily minimum (TN) and maximum (TX) air temperature and precipitation data during the node appearance phase were measured using a conventional weather station (Instituto Nacional de Meteorologia) located about 300 m distant from the plots.
The Soydev model (Setiyono et al., 2007) used in this study is a mechanistic model that has two important features: the genotype component and the environment component are combined in a multiplicative fashion, and environmental factors that drive development (i.e. temperature) are represented by nonlinear response functions that vary from zero to one. The node number in Soydev is calculated by (Setiyono et al., 2007): NAR = NARmax f(T), where NAR is the daily node
appearance rate (nodes per day), NARmax is the
maximum daily node appearance rate (nodes per day) under optimum temperature, and f(T) is a dimensionless temperature response function (0–1) for NAR. Temperature response funtion is a beta function:
f(T) = [2(T - Tmin)α(Topt - Tmin)α - (T - Tmin)2α]/(Topt - Tmin)2α
α = ln2/ln[(Tmax - Tmin)/(Topt - Tmin)],
where Tmin, Topt, and Tmax are the cardinal temperatures
(minimum, optimum, and maximum) for NAR, and T is the daily air temperature. The cardinal temperatures for NAR are 7.6, 31 and 40oC for T
min, Topt, and Tmax,
respectively (Setiyono et al., 2007). The main stem NN is calculated by accumulating daily NAR values (i.e. at a one-day-time step) starting at the emergence date, i.e.,
NN = ∑NAR.
Temperature response function in the Soydev model was calculated using two different approaches: using daily mean air temperature calculated as the arithmetic average (Tmean) of daily TN and TX (Soydevtmean); and
calculating a f(T) using TN and a f(T) using TX and then averaging the two f(T)s (Soydevtmm). The NARmax
coefficient is genotype‑dependent and was estimated for cultivars CD 205 and CD 209 using the NN data
Table 1. Soybean cultivars used in the study during the three growing seasons(1).
(1)Sources: Associação dos Produtores e Comerciantes de Sementes do Rio Grande do Sul (2006), Cooperativa Central de Pesquisa Agrícola (2006) and
collected from the 40 plants m-2 treatment in the
2006/2007 growing season. The NARmax coefficient
was estimated by changing (increasing and decreasing)
an initial value (0.4 nodes per day) by a 1% step until obtaining the best fit between observed and simulated
values – least square method (Xue et al., 2004) with an algorithm in Excel software.
The performance of the two versions of the Soydev node appearance model was evaluated using the NN
data of cultivar CD 205 grown in the 2004/2005 and 2005/2006 growing seasons and NN data of cultivar CD 209 grown in the 2005/2006 growing season, which
are independent data sets. The NN data for cultivars
CD 205 and CD 209 collected in the 32 plants m-2 and
24 plants m-2 treatments during the 2006/2007 growing
season were also used to evaluate the two versions
of the model in order to test the models when a field
management is changed (change in plant density). The recommended plant density for soybean in southern Brazil has changed from 40 plants m-2 in the early
2000’s (Reunião de Pesquisa de Soja da Região Sul, 2000) to 30–32 plants m-2 in the 2006/2007 growing
season (Reunião de Pesquisa de Soja da Região Sul, 2006, 2007). The density of 24 plants m-2 represents field
situations that can happen when the number of emerged soybean plants is low due to stress factors such as low soil moisture, low or high temperature, seed damage by insects, among others.
A second evaluation of the Soydev model was performed for simulating the NN of the other eight soybean cultivars (Table 1). Because these cultivars were grown in a single sowing date, there is no calibration data set plus independent data set for these cultivars. In this second evaluation, the version of the
Soydev model with best performance for cultivars CD 205
and CD 209 was run for each of the other eight cultivars using the NARmax estimated for the cultivar CD 205 and the
NARmax estimated for the cultivar CD 209. This alternative
evaluation was used to test the ability of Soydev to simulate
NN without the need for cultivar‑specific calibration and to
identify cultivars that have similar node appearance rates, as data for calibrating individual cultivars are often not available and commercial soybean cultivars change frequently.
The statistic root mean square error (RMSE) was calculated with the independent data and used as a measure of the models’ performance. The RMSE was calculated as
(Janssen & Heuberger, 1995): RMSE = [Σ(Si - Oi)2/n]0.5,
where Si are simulated NN data, Oi are observed NN data, n
is the number of observations, and i varies from 1 to n.
The RMSE expresses the spread in Si - Oi and has the
same units as the predicted and the observed data (in this study the unit is nodes). The lower the RMSE, the better the model simulation. The method based on the deviations (simulated minus observed) proposed by Mitchell (1997) was also used for assessing models performance. The approach of regressing simulated versus observed NN was avoided in this study, since it has been suggested that this method is not appropriate for assessing model performance (Harisson, 1990; Mitchell, 1997). Pearson correlation between simulated and observed NN values, and normality and homogeneity of variance of observed and simulated NN values were also performed for model evaluation (Martin et al., 2007), using the Kolmogorow-Smirnov and Bartlett tests, respectively.
Results and Discussion
Meteorological conditions (temperature and precipitation) during the node appearance phase were distinct in the three growing seasons. The 2006/2007 growing season, which was used to estimate NARmax, was the mildest and the wettest. During
13 weeks of node appearance in the 2006/2007 growing season, the average weekly minimum temperature varied from 18.3to 22.6oC and the average weekly maximum
temperature varied from 27.6to 33.8oC, and the total
precipitation was 448.2 mm. The 2004/2005 growing
season was the warmest, with the highest average weekly maximum temperature (36oC), and the driest,
with 142.4 mm of precipitation during 13 weeks of
node appearance. The 2005/2006 growing season was
intermediate in terms of precipitation (302.8 mm during 11 weeks of node appearance) and had the lowest average
weekly minimum temperature (15.2oC). Maximum air
temperature exceeded the optimum temperature for NAR (31oC) in most weeks during the node appearance phase,
mainly in the 2004/2005 growing season, while minimum
air temperature was always above minimum temperature for NAR (7.6oC) in all three growing seasons. These distinct
meteorological conditions in the three growing seasons represent expected interannual climate variability for this location and are appropriate for calibrating and evaluating the two versions of the Soydev node appearance model.
The estimated NARmax for cultivar CD 205 was of
0.4088 nodes per day and 0.3736 nodes per day and for cultivar CD 209 was of 0.4237 nodes per day and 0.4027 nodes per day with Soydevtmean and Soydevtmm,
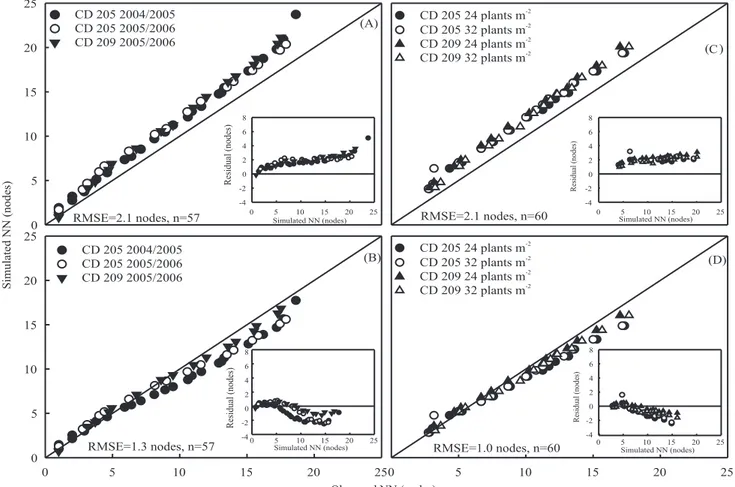
Simulated versus observed values of main stem
NN for the independent data of cultivars CD 205
and CD 209 are presented in Figure 1. Pooling the
data of the two cultivars during the 2004/2005 and 2005/2006 growing seasons, the RMSE was of
2.1 nodes with the Soydevtmean version of the model
(Figure 1 A) and of 1.3 nodes with the Soydevtmm
version (Figure 1 B). The RMSE was also reduced from 2.1 nodes (Figure 1 C) to 1.0 node (Figure 1 D) when the NN of the two cultivars grown in 2006/2007 at 24 and 32 plants m-2 was simulated using Soydev
tmean and
Soydevtmm, respectively. A consistent overprediction
of the NN was observed with the Soydevtmean version
of the model, as the residuals (simulated minus observed) were positive and curved up as the crop aged (insets of Figures 1 A and 1 C), with residuals
greater than two nodes for NN higher than ten nodes. Simulations of NN using the Soydevtmm resulted in data
points more scattered around the 1:1 line with a small overprediction (less than one node) at the beginning of the season (when NN was lower than about seven nodes), and an underprediction afterwards that reached
up to about two nodes at NN between 10 and 15 nodes
(Figures 1 B and 1 D). For data presented in Figure 1,
Pearson correlation coefficient was high for both
Soydevtmean (r = 0.99) and for Soydevtmm (r = 0.99),
observed and simulated NN were normally distributed
at 1%, and the variance of simulated data was not
different from the variance of observed data according
to the Bartlett test at 1%. These results indicate that
the Soydevtmm version is superior to the Soydevtmean
version of the node appearance model.
Figure 1. Simulated versus observed number of nodes (NN) in two soybean cultivars (CD 205 and CD 209) using two versions
of the Soydev model during two growing seasons (2004/2005 and 2005/2006). (A) and (C) show the simulations with the Soydev model using mean air temperature in the f(T) (Soydevtmean), and (B) and (D) show the simulations with the Soydev model using daily
minimum and maximum air temperature in the f(T) (Soydevtmm). In (A) and (B) the plant density was 40 plants m-2 and in (C) and
(D) the plant density was 24 and 32 plants m-2. Plots of residual (simulated minus observed) versus simulated NN are shown in the
The better performance of the Soydevtmm version over
the Soydevtmean version was also detected when the RMSE
for cultivars CD 205 and CD 209 was calculated across
growing seasons, cultivars, planting dates and plant densities (Table 2). The RMSE varied from 1.9 to 2.3 nodes with Soydevtmean and from 0.5 to 1.4 nodes with the Soydevtmm
model. The RMSE values obtained with the Soydevtmm
version in this study are within the range (0.3 to 1.5 nodes)
obtained with the Soydev model for semi-determinate and indeterminate soybean cultivars grown under non-limiting water and nutrient conditions in a high-latitude temperate region in the USA (Setiyono et al., 2007).
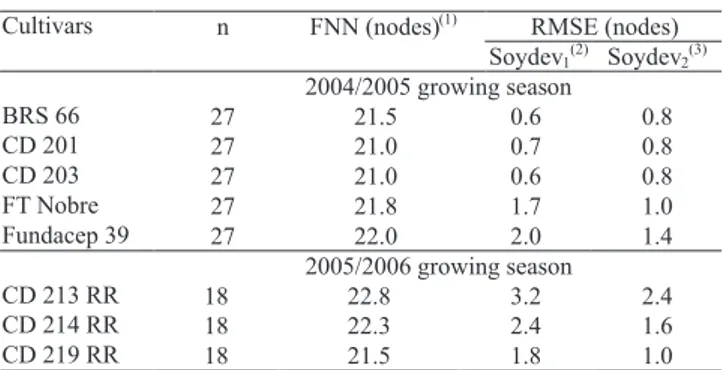
The RMSE of the simulation of NN with the Soydevtmm
version for each of the other eight cultivars in the second evaluation of the Soydev model is in Table 3. The lowest RMSE for cultivars BRS 66, CD 201 and CD 203 (0.6, 0.7 and 0.6 nodes, respectively) was when the Soydevtmm
model was run with NARmax of cultivar CD 205, whereas
the lowest RMSE for the other five cultivars (FT 9,
Fundacep 39, CD 213 RR, CD 214 RR and CD 219 RR) (1.0, 1.4, 2.4, 1.6 and 1.0 nodes, respectively) was when the Soydevtmm model was run with NARmax of cultivar CD
209. The RMSE for cultivars BRS 66, CD 201 and CD 203 increased only by 0.1 or 0.2 nodes when the NARmax of
cultivar CD 209 was used, resulting in lower RMSE (0.8
nodes) than the RMSE for the other five cultivars with the
NARmax of cultivar CD 209. Therefore, when Soydevtmm
was run with NARmax estimated for cultivar CD 209 for
all the other eight cultivars (i.e., without cultivar‑specific
calibration), the RMSE varied from 0.8 to 2.4 nodes, and only two cultivars (CD 213 RR and CD 214 RR) had
RMSE outside the range of 0.3 to 1.5 nodes reported by Setiyono et al. (2007) for 22 cultivars using cultivar‑specific
calibration. For data presented in Table 3, Pearson correlation was high for both Soydevtmean (r = 0.98) and
for Soydevtmm (r = 0.98), observed and simulated NN were
normally distributed at 1%, and the variance of simulated
data was not different from the variance of observed data
according to the Bartlett test at 1%. These results indicate
that NAR is a trait that varies little among the soybean genotypes and one single NARmax value can represent
a group of genotypes with no major loss of predictive ability by the Soydev model.
The RMSE values (Table 3) were associated with the maturity group of the cultivars (Table 1), but no clear
trend could be detected. For instance, CD 205 (a mid‑late genotype) reached R1 3–5 days later than CD 209 (a medium
genotype), and when the Soydevtmm was run with NARmax
of CD 209 it gave lower RMSE for CD 219 RR (a mid-late genotype). A lack of association between the performance of a NN simulation model with maturity group for the determinate soybean cultivars used in the present study is consistent with the results reported by Setiyono et al. (2007) for semi-determinate and indeterminate soybean cultivars and indicates that vegetative development (node appearance) is independent of reproductive development in soybean, even though the former overlaps the latter.
The 2004/2005 growing season was quite dry
compared to the other two growing seasons. Even though no apparent symptoms of water stress (wilting or leaf rolling) was observed in the plants, the duration of the
emergence (EM) – R1 phase of cultivar CD 205 was slightly shorter in 2004/2005 (56 days) than in 2005/2006 (62 days) and 2006/2007 (58 days). This reduction in the EM–R1 phase in 2004/2005 may have occurred due
to a partial stomatal closure in an attempt to save water and keep cell turgescence that might have led to a slight increase in canopy temperature, which may hasten crop development. In terms of Soydev performance, RMSE with the Soydevtmm was the lowest in 2004/2005 (Table 3),
indicating that node appearance was not affected by the lower precipitation during this growing season.
Table 2. Values of root mean square error (RMSE) for the simulation of node number in two soybean cultivars using two
versions of the Soydev model during three growing seasons.
The results of this study indicate that the simulation of node number in soybean with Soydev can be improved by using the minimum and maximum air temperature as the input for calculating the temperature response function (Soydevtmm version). Similar results were reported for winter
wheat (Xue et al., 2004) and maize (Streck et al., 2008c). When air temperature is near the cardinal temperatures, the response of crop development to temperature falls into the nonlinear range and in this situation the approach of calculating an f(T) for TN and an f(T) for TX is more appropriate than calculating an f(T) for Tmean (Xue et al.,
2004; Streck et al., 2008c). In this study, during the node appearance phase, the highest TX were 39, 38.6 and 37.4oC, and TX was higher than 37oC in 8, 7 and 1 day
during the 2004/2005, 2005/2006 and 2006/2007 growing
seasons, respectively. These TX values are near the Tmax
for node appearance in soybean (40oC). Therefore, the
hypothesis tested in the present study, that the approach of calculating f(T) based on daily minimum and maximum air temperatures improves the simulation of soybean NN using Soydev in comparison to the original version of the
model under Brazilian conditions, has been confirmed.
Simulations of NN with Soydevtmm for cultivars CD 205
and CD 209 grown at plant densities of 32 and 24 plants m-2
were good (Table 2), with RMSE varying from 0.5 nodes (CD 209) to 1.2 nodes (CD 205). These results indicate that
changing plant density in the range from 24 to 40 plants m-2 has no considerable impact on node appearance rate
and that Soydevtmm can be used to predict NN with no
additional input or calibration for plant density, which is an advantage from a modeling viewpoint. Another important result of the present study was that NN was well simulated
in a dry year (2004/2005) with model calibration for a wet
year (2006/2007). Furthermore, the RMSE of six out of eight cultivars was low (0.8 to 1.4 nodes) when the model was run with a simple NARmax value. These results indicate
robustness and generality of the Soydev model, and
confirm that this model is suitable for practical applications because of its reduced need for genotype‑specific
calibration (Setiyono et al., 2007). One practical application of the NN simulations with the Soydev model is to describe the V-Stages of a soybean crop. In order to calculate the V-Stage, one has to subtract NN by one, i.e., if the simulated NN = 2, then crop is at V1 (unifoliolate leaf pair); if
NN = 3, then crop is at V2 (first trifoliolate leaf), and so forth.
Conclusions
1. The simulation of node number in soybean is improved when daily minimum and maximum air temperatures are used as input for the temperature response function (Soydevtmm version) compared to
using daily mean temperature (Soydevtmean version).
2. The Soydevtmm model can be used to simulate
main stem node number in soybean when plant density varies from 24 to 40 plants m-2 with no additional input
or calibration.
3. Main stem node number of determinate stem habit soybean cultivars can be simulated for several cultivars
using only one set of model coefficients (NARmax and
cardinal temperatures).
4. The simulation of node numbers in soybean grown in rainfed conditions is good in a dry year using model calibration from a wet year.
Acknowledgements
To Conselho Nacional de Desenvolvimento Científico
e Tecnológico and Coordenação de Aperfeiçoamento de Pessoal de Nível Superior, for scholarships.
References
ASSOCIAÇÃO DOS PRODUTORES E COMERCIANTES DE SEMENTES DO RIO GRANDE DO SUL. Descrição de cultivares: soja. Available at: <http://www.apassul.com.br/ conteudo.asp?content=12&a=view&ID=12>. Acessed on: 28 mar. 2006.
COOPERATIVA CENTRAL DE PESQUISA AGRÍCOLA.
Produtos: soja. Available at: <http://www.coodetec.com.br/ >. Acessed on: 28 mar. 2006.
Table 3. Values of root mean square error (RMSE) for the
simulation of node number in eight soybean cultivars with the version of the Soydev model that uses minimum and maximum daily air temperature as the input to calculate the f(T) (Soydevtmm), during two growing seasons.
(1)FNN, average main stem final node number observed. (2)Soydev
model run with maximum daily node appearance rate (NARmax) of cultivar
CD 205 (0.3736 nodes per day). (3)Soydev model run with NAR
max of cultivar
FEHR, W.R.; CAVINESS, C.E. Stages of soybean development. Ames:
Iowa State University of Science and Technology, 1977. 15p. (Special
Report, 80).
FUNDAÇÃO CENTRO DE EXPERIMENTAÇÃO E PESQUISA.
Produtos: variedades de soja. Available at: <http://www.fundacep.com. br/>. Acessed on: 28 mar. 2006.
HARISSON, S.R. Regression of a model on real-system output: an invalid test of model validity. Agricultural Systems, v.34, p.183-190, 1990.
JANSSEN, P.H.M.; HEUBERGER, P.S.C. Calibration of process-oriented models. EcologicalModelling, v.83, p.55‑66, 1995.
JOHNSON, S.R. How a soybean plant develops. Ames: Iowa State
University of Science and Technology, 1997. 18p. (Special Report, 53).
JONES, J.W.; WHITE, J.; BOOTE, K.; HOOGENBOOM, G.; PORTER, C.H. Phenology module in DSSAT v. 4.0: documentation and source code listing. Gainesville: University of Florida, 2000. 98p.
JONES, P.G.; LAING, D.R. Simulation of the phenology of soybean.
Agricultural Systems, v.3, p.295‑311, 1978.
MAJOR, D.J.; JOHNSON, D.R.; TANNER, J.W.; ANDERSON, I.C. Effects of day length and temperature on soybean development. Crop Science, v.15, p.174‑179, 1975.
MARTIN, T.N.; STORCK, L.; DOURADO NETO, D. Simulação estocástica da radiação fotossinteticamente ativa e da temperatura do ar por diferentes métodos. Pesquisa Agropecuária Brasileira, v.42, p.1211-1219, 2007.
MARTINS, F.B.; STRECK, N.A. Aparecimento de folhas em mudas de eucalipto estimado por dois modelos. Pesquisa Agropecuária Brasileira, v.42, p.1091-1100, 2007.
MITCHELL, P.L. Misuse of regression for empirical validation of models.
Agricultural Systems, v.54, p.313‑326, 1997.
PIPER, E.L.; BOOTE, K.J.; JONES, J.W.; GRIMM, S.S. Comparison
of two phenology models for predicting flowering and maturity date of
soybean. Crop Science, v.36, p.1606-1614, 1996.
REUNIÃO DE PESQUISA DE SOJA DA REGIÃO SUL, 28., 2000, Santa Maria. Anais. Santa Maria: Universidade Federal de Santa Maria, 2000. 148p.
REUNIÃO DE PESQUISA DE SOJA DA REGIÃO SUL, 34., 2006, Pelotas. Atas e resumos. Pelotas: Embrapa Clima Temperado, 2006. 237p.
REUNIÃO DE PESQUISA DE SOJA DA REGIÃO SUL, 35., 2007,
Santa Maria. Atas e resumos. Santa Maria: Universidade Federal de Santa Maria. 203p.
SETIYONO, T.D.; WEISS, A.; SPECHT, J.; BASTIDAS, A.M.; CASSMAN K.G.; DOBERMANN, A. Understanding and modeling the effect of temperature and day length on soybean phenology under high-yield conditions. Field Crops Research, v.100, p.257‑271, 2007.
SINCLAIR, T.R. Water and nitrogen limitations in soybean grain productivity. I. Model development. Field Crops Research, v.15, p.125‑141, 1986.
SINCLAIR, T.R.; NEUMAIER, N.; FARIAS, J.R.B.; NEPOMUCENO, A.L. Comparison of vegetative development in soybean cultivars for low-latitude environments. Field Crops Research, v.92, p.53‑59, 2005.
STRECK, E.V.; KÄMPF, N.; DALMOLIN, R.S.D.; KLAMT, E.; NASCIMENTO, P.C. do; GIASSON, E.; PINTO, L.F.S. Solos do Rio Grande do Sul.2 ed. Porto Alegre: UFRGS: Emater/RS, 2008a. 222p. STRECK, N.A.; BOSCO, L.C.; LAGO, I. Simulating leaf appearance in rice. Agronomy Journal, v.100, p.490‑501, 2008b.
STRECK, N.A.; DE PAULA, F.L.M.; BISOGNIN, D.A.; HELDWEIN,
A.B.; DELLAI, J. Simulating the development of field grown potato
(Solanum tuberosum L.). Agricultural and Forest Meteorology, v.142, p.1-11, 2007.
STRECK, N.A.; LAGO, I.; BURIOL, G.A.; HELDWEIN, A.B.; TIBOLA, T. A non-linear model to simulate node appearance in muskmelon (Cucumis melo L.) grown inside plastic greenhouse as a function of air temperature. Revista Brasileira de Agrometeorologia, v.14, p.210-216, 2006.
STRECK, N.A.; LAGO, I.; GABRIEL, L.F.; SAMBORANHA, F.K. Simulating maize phenology as a function of air temperature with a linear and a nonlinear model. Pesquisa Agropecuária Brasileira, v.43,
p.449‑455, 2008c.
STRECK, N.A.; WEISS, A.; XUE, Q.; BAENZIGER, P.S. Improving
predictions of developmental stages in winter wheat: a modified Wang
and Engel model. Agricultural and Forest Meteorology, v.115,
p.139‑150, 2003a.
STRECK, N.A.; WEISS, A.; XUE, Q.; BAENZIGER, P.S. Incorporating a chronology response into the prediction of leaf appearance rate in winter wheat. Annals of Botany, v.92, p.181-190, 2003b.
WOLF, J. Comparison of two soya bean simulation models under climate change. I. Model calibration and sensitivity analyses. Climate Research, v.20, p.55‑70, 2002.
XUE, Q.; WEISS, A.; BAENZIGER, P.S. Predicting leaf appearance
in field‑grown winter wheat: evaluating linear and non‑linear models. Ecological Modelling, v.175, p.261‑270, 2004.