ISSN 0101-2061 Food Science and Technology
DI:
D http://dx.doi.org/10.1590/1678-457X.6455
1 Introduction
Grape and wine quality are often influenced by the soil and climatic conditions, cultural practices, and training system; all of which interact with the concept of terroir and grape variety (Deloire et al., 2005). In general, soil and climate, or the interaction between them, are considered to be the simplest methods used for the determination of terroir (Spayd et al., 2002). European vignerons (winemakers) have found that planting grapevines in a suitable soil can make a difference between a great wine and a poor wine. In addition, a previous research shows that the localization of the vineyards have more influence on the characteristics of wine than the maceration type (Daudt & Fogaça, 2013). However, another study shows that the vintage effect on grape metabolic profiles prevailed over the soil effect in a place where climatic traits, such as the seasonal sum of temperatures and water balance, were the main factors (Pereira et al., 2006).
Phenolic compounds are one of the major quality factors in wine grapes and in the resulting wines. In addition, phenolic compounds have a direct effect on some important organoleptic characteristics of wines, such as color, flavor, bitterness, and astringency (Garrido & Borges, 2011). Although phenolic compounds found in wines can also originate from microbial and oak sources, the majority of the phenolic compounds are grape-derived (Kennedy, 2008). Grapes contain two groups of phenolics: flavonoids and non-flavonoids. Phenolic compounds include non-flavonoid compounds, such as hydroxycinnamic acid esters and stilbenes, and flavonoid compounds, such as anthocyanins, flavonols, and proanthocyanidins (PAs). The anthocyanins are the principal source of color in red grape skins and wines, and there are many interactions occurring
among the three flavonoid compounds in wine resulting in new pigments (Brouillard et al., 2003; Jackson, 2008; Wrolstad et al., 2005). Proanthocyanidins (PAs) or condensed tannins are composed of flavan-3-ol subunits and are primarily responsible for the astringency of wine and contribute to its bitterness (Vidal et al., 2003). In addition, many phenolics have antioxidative, anticarcinogenic, and antimicrobial activities (Eberhardt et al., 2000; Kawaii et al., 1999; Kim et al., 2000). Some phenolics, including flavonoids in fruits and vegetables, may reduce the risk of cardiovascular disease (Cook & Samman, 1996).
The corridor area is located in China’s Gansu province. The climate in the corridor area is described as hot and arid with a high biologically effective day degrees, sufficient sunlight, and low rainfall. The soils are gravelly sandy and have high content of salt. In recent years, the grape and wine industry has showed fast development in China, and many wineries have been established. In the corridor area, there are three representative wine grape growing regions for their different climatic conditions and soil properties, Zhangye, Wuwei, and Jiayuguan. However, there have been little experimental studies on the influence of terroir on wine grape composition and antioxidant capacity in China. In the present study, grape composition and antioxidant capacity of main wine grape varieties cultivated in the corridor area were investigated and compared. The purpose was to determine the effect of different regions on berry composition and antioxidative activity, providing a general evaluation of red and white wine grape quality in the corridor area of China and determine the suitable grape variety for different regions.
Research on the quality of the wine grapes in corridor area of China
Guo CHENG1, Jie-Qiong FA1, Zhu-Mei XI2, Zhen-Wen ZHANG1*
Received 24 July, 2014 Accepted 23 Nov., 2014
1College of Enology, Northwest A&F University, Yangling, Shaanxi, P. R. China
2Shaanxi Engineering Research Center for Viti-Viniculture, Northwest A&F University, Yangling, Shaanxi, P. R. China.
*Corresponding author: [email protected] Abstract
The corridor area of Gansu Province is one of the most important wine grape growing regions in China, and this strip of land results in a significant difference in terms of terroir between its regions. Chemical composition and antioxidant capacity of the main wine grape varieties (Vitis vinifera L.) cultivated in the corridor area of Gansu Province in northwest China were compared. Three regions (Zhangye, Wuwei, and Jiayuguan) were selected to explain the influence of soil and climate conditions on the quality of wine grapes. This study aims to investigate the effect of different regions on berry composition and antioxidant capacity, providing a general evaluation of red and white wine grapes quality in the corridor area of China. The results showed that ‘Merlot’ grapes grown in Zhangye had the best quality among the different varieties in the three regions of Gansu evaluated. The moderate temperature and nitrogen deficiency were associated with improved fruit quality. It was identified that the most suitable grape variety from Zhangye is ‘Merlot’, and that ‘Cabernet Sauvignon’ and ‘Italian Resling’ are the most suitable varieties from Wuwei and Jiayuguan, respectively.
2 Materials and methods
2.1 Meteorological survey
The meteorological data of three different regions were obtained from the local meteorological administration. Sunlight duration (hour), temperature (°C) and rainfall (mm) were recorded daily.
2.2 Soil sampling and analysis
The chosen soils belonged to three regions with three different depths: 0-20 cm, 20-40 cm, and 40-60 cm. The 10 soil sampling points selected were in a Z-shape, and 500 g of soil were collected from each depth and point, maintaining a distance of 100 cm away from the trunk. All soils from the same depth were mixed, and 1 kg was retained for every sample based on ‘quartering’. A Mastersizer 2000E laser particle size analyzer was used to determine the physical properties of the soil samples from the three regions. The soil texture sorting method followed the criteria of the Soil Survey Manual (Soil Survey Division Staff, 1993). Drganic matter and the pH of the soil samples were measured by potassium dichromate volumetry and potentiometry, respectively. The nutrient elements present in the soils were identified using a plasma spectrometer (Vista-AX, Varian, USA) after extraction and digestion.
2.3 Grape samples
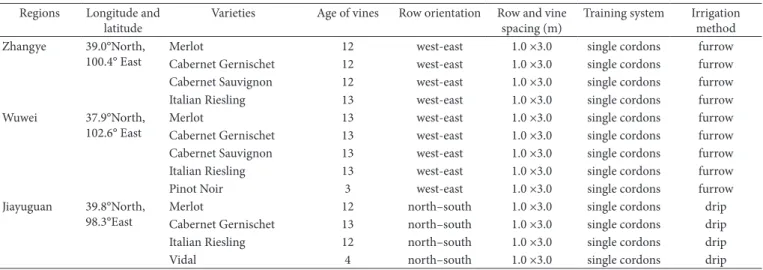
Four Vitis vinifera grape cultivars were investigated in this study, which included four red-skinned cultivars (Merlot, Cabernet Gernischet, Cabernet Sauvignon, and Pinot Noir), and two white-skinned cultivars (Italian Riesling and Vidal). The grapes were grown in Zhangye, Wuwei, and Jiayuguan, regions of Gansu province in northwest China, and were managed equally in terms of fertilizer application, soil management, disease control, and pruning. More information of experimental sites and plant materials are shown in Table 1. Canopy management is generally performed to maintain growing shoots and their fruit in an optimal microclimate for grape quality.
Grapes were manually harvested when the soluble solids in the berries reached the maximum value (approximately 150-180 g/L). The white-skinned grapes were harvested in the middle of September in 2012, and the three red-skinned cultivars were harvested in early Dctober in 2012. In order to have a representative grape sample, 900 berry samples (300 per replicate) were collected from at least seven 30-cluster selections at similar positions in 100 vines at maturity stage. Sampling was performed at a fixed time: from 9:00 to 10:00 in the morning. The fresh samples were kept in refrigerated bags and taken to the laboratory within a few hours. Then, 300 berry samples (100 per replication) were crushed in a hand press through 2 layers of cheesecloth. Titratable acidity and the content of sugar, total phenolics, and anthocyanidins were quantified according to the National Standard of the People’s Republic of China (China National Standardization Administration, 2006). The pH of the juice was measured using a Mettler-Toledo LE438 pH meter. The tannin levels were determined in 300 berry samples (100 per replication) by methyl cellulose precipitation (Sarneckis et al., 2006). Additionally, the berry skins were separated from the rest of the 300 berry samples (100 per replication) and were immediately frozen in liquid nitrogen and then ground to a fine powder, freeze-dried, and stored at –40 °C until analysis.
2.4 Measurement of antioxidant capacity
A total amount of 1.0 g of grape skin powder was immersed in 20 mL methanol, which contained 60% methanol and 0.1% hydrochloric acid. Grape skin extraction was performed using ultrasound-assisted extraction at dark at 25 °C for 30 min. The homogenate was then centrifuged at 10,000 ×g for 10 min, and the supernatant was collected. The residues were re-extracted four times, and all the supernatants were mixed and used as an antioxidant solution to measure the parameters describe below.
Determination of total flavonoids:total flavonoids were measured by a colorimetric assay developed by Zhishen et al. (1999). An aliquot of 1 mL of the antioxidant solution of appropriately diluted sample or standard solutions of catechin (20, 40, 60, 80, and 100 mg/L) was added to a 10 mL volumetric
Table 1. Data of experimental sites and plant materials from three different wine grape growing-regions in Gansu province of China.
Regions Longitude and latitude
Varieties Age of vines Row orientation Row and vine spacing (m)
Training system Irrigation method Zhangye 39.0°North,
100.4° East
Merlot 12 west-east 1.0 ×3.0 single cordons furrow
Cabernet Gernischet 12 west-east 1.0 ×3.0 single cordons furrow Cabernet Sauvignon 12 west-east 1.0 ×3.0 single cordons furrow
Italian Riesling 13 west-east 1.0 ×3.0 single cordons furrow
Wuwei 37.9°North, 102.6° East
Merlot 13 west-east 1.0 ×3.0 single cordons furrow
Cabernet Gernischet 13 west-east 1.0 ×3.0 single cordons furrow Cabernet Sauvignon 13 west-east 1.0 ×3.0 single cordons furrow
Italian Riesling 13 west-east 1.0 ×3.0 single cordons furrow
Pinot Noir 3 west-east 1.0 ×3.0 single cordons furrow
Jiayuguan 39.8°North, 98.3°East
Merlot 12 north–south 1.0 ×3.0 single cordons drip
Cabernet Gernischet 13 north–south 1.0 ×3.0 single cordons drip Italian Riesling 12 north–south 1.0 ×3.0 single cordons drip
flask containing 4 mL ddH2D. At zero time, 0.3 mL 5% NaND2 was added to the flask. After 5 min, 0.3 mL 10% AlCl3 was
added. At 6 min, 2 mL 1 M NaDH was added to the mixture. Immediately, the reaction flask was diluted to volume with the addition of 2.4 mL of ddH2D and thoroughly mixed. The
absorbance of the mixture, pink in color, was determined at 510 nm against prepared water blank. The results were calculated from a calibration curve using catechin as a standard.
Determination of total flavanols:the antioxidant solution (0.1mL) was added to 3.0 mL of a 6 × 10⁻⁵ mol/L p-DMAC
solution, left at room temperature for 20 min, and the absorbance was read at 643 nm. The results were calculated from a calibration curve using catechin as a standard (Li et al., 1996).
Antiradical activities of potent antioxidants by DPPH:the antioxidant solution (0.1mL) was added to 3.9 mL of a 6 × 10⁻⁵
mol/L methanol DPPH solution. The decrease in absorbance was determined at 515 nm at 0 min, 1 min, and every 15 min until the reaction reached a plateau. The exact initial DPPH* concentration (CDPPH) in the reaction medium was calculated from a Trolox calibration curve (Brand-Williams et al., 1995).
The reducing power of Cu measurement: To a test tube 1 mL of Cu (II), Nc, and NH4Ac buffer solutions was added. The antioxidant sample (or standard) solution (x mL) and H2D [(1.1 - x) mL] were added to the initial mixture so as to make the final volume 4.1 mL. The tubes were stoppered, and after 1 h, the absorbance at 450 nm (A450) was recorded against a reagent blank. The results were calculated from a Trolox calibration curve (Apak et al., 2004).
2.5 Statistical analysis
Means and standard deviation were obtained from at least 3 repetitions. Dne-way ANDVA and Tukey’s Range Test were used to evaluate the differences among the three regions for each grape cultivar. Significance analysis was performed using SPSS (SPSS Inc., Chicago, IL) for Windows, version 20.0.
Principal component analysis (PCA) was used to determine the discrimination index of the different regions and cultivars. Prior to the PCA, the evaluation factors must be standardized because of different dimension of assessment indexes. Both the positive indexes (reducing sugar, pH, total phenols, tannin, and total anthocyanidins) and negative indexes (total acidity) were standardized using the following formulas:
(1) the positive indexes: yij=(xij-min xij)/(max xij-min xij);
(2) the negative indexes: yij=(max xij- xij)/(max xij-min xij)
The number of principal components was determined by the cumulative variance of traits. Then, the function of the main ingredients was listed according to the eigenvectors of the correlation matrix. Lastly, the comprehensive quality ratings of the wine grapes were determined by the comprehensive principal component values. PCA was performed with the SAS factor procedure.
3 Results and discussion
3.1 Analysis of grape quality of the main wine grape varieties cultivated in the corridor area
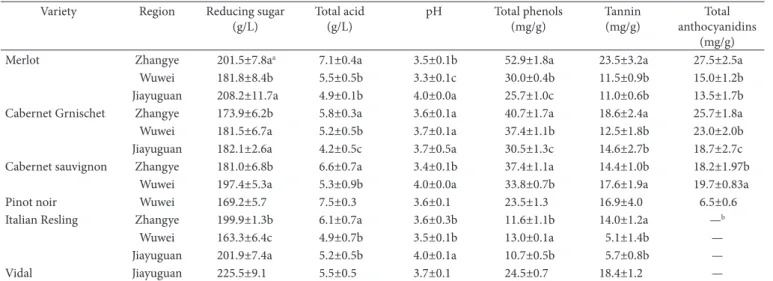
Table 2 shows different performances of the main grape varieties quality in different regions. the reducing sugar of the‘Merlot’ grapes of Wuwei was lower than that of the other two regions; Total acidity, total phenols, tannins, and total anthocyanidins were the highest in Zhangye, while there were no significant differences of total acidity, tannins, and total anthocyanidins between Wuwei and Jiayuguan; The order of pH value in the different regions was as follows: Jiayuguan>Zhangye>Wuwei. Reducing sugar of the ‘Cabernet Grnischet’ grapes form Zhangye, was lower than that of the other two regions; However, the total acidity, total phenols, tannins, and total anthocyanidins of the grapes from Zhangye had the highest values among the regions; In addition, there was no significant difference in the pH values among the three regions.
Table 2. Chemical analysis of the main wine grape varieties cultivated in the corridor area.
Variety Region Reducing sugar (g/L)
Total acid (g/L)
pH Total phenols (mg/g)
Tannin (mg/g)
Total anthocyanidins
(mg/g)
Merlot Zhangye 201.5±7.8aa 7.1±0.4a 3.5±0.1b 52.9±1.8a 23.5±3.2a 27.5±2.5a
Wuwei 181.8±8.4b 5.5±0.5b 3.3±0.1c 30.0±0.4b 11.5±0.9b 15.0±1.2b
Jiayuguan 208.2±11.7a 4.9±0.1b 4.0±0.0a 25.7±1.0c 11.0±0.6b 13.5±1.7b Cabernet Grnischet Zhangye 173.9±6.2b 5.8±0.3a 3.6±0.1a 40.7±1.7a 18.6±2.4a 25.7±1.8a
Wuwei 181.5±6.7a 5.2±0.5b 3.7±0.1a 37.4±1.1b 12.5±1.8b 23.0±2.0b
Jiayuguan 182.1±2.6a 4.2±0.5c 3.7±0.5a 30.5±1.3c 14.6±2.7b 18.7±2.7c Cabernet sauvignon Zhangye 181.0±6.8b 6.6±0.7a 3.4±0.1b 37.4±1.1a 14.4±1.0b 18.2±1.97b
Wuwei 197.4±5.3a 5.3±0.9b 4.0±0.0a 33.8±0.7b 17.6±1.9a 19.7±0.83a
Pinot noir Wuwei 169.2±5.7 7.5±0.3 3.6±0.1 23.5±1.3 16.9±4.0 6.5±0.6
Italian Resling Zhangye 199.9±1.3b 6.1±0.7a 3.6±0.3b 11.6±1.1b 14.0±1.2a —b
Wuwei 163.3±6.4c 4.9±0.7b 3.5±0.1b 13.0±0.1a 5.1±1.4b —
Jiayuguan 201.9±7.4a 5.2±0.5b 4.0±0.1a 10.7±0.5b 5.7±0.8b —
Vidal Jiayuguan 225.5±9.1 5.5±0.5 3.7±0.1 24.5±0.7 18.4±1.2 —
The reducing sugar, pH, tannins, and total anthocyanidins of the ‘Cabernet sauvignon’ grapes from Wuwei were the highest, but the total acidity and total phenols were significantly higher in the grapes from Zhangye. The total acidity and tannins of the ‘Italian Resling’ grapes from Zhangye were significantly higher, and the total phenols of the grapes from Wuwei were the highest among the three regions; Grapes from Jiayuguan had the highest values of reducing sugar and pH.
3.2 Climatic conditions
The climate was described as hot and arid with a high biologically effective day degrees and low rainfall in all the experimental regions. The meteorological data of 2012 were obtained from the local meteorological administration. With respect to annual mean temperature, average maximum temperature, and GDD (growing degree days, calculated from daily mean temperatures, base temperature of 10°C), Wuwei was significantly warmer than the other two regions (Table 3). With regard to the average minimum temperature, Jiayuguan was the coldest among the three regions. These results are expected according to the latitude-longitude of three regions in Gansu. However, the sunlight duration in Jiayuguan was longer than that in Wuwei and Zhangye during the growing season (April-Dctober), the ripening period (August-September), and during the whole year. The shortest sunlight duration and the highest rainfall were observed in Wuwei; Jiayuguan had the lowest rainfall during the period of time evaluated.
The wine grape-growing regions of China have unique ecological conditions either from south to north or from east to west. The regions in the study, located in Gansu of China, have semi-arid climate with a significant temperature difference between daytime and nighttime. They have abundant sunshine and an annual rainfall of 100-150 mm, just like the conditions of Ningxia wine grape-growing region, which are very different from those of Hebei, semi-humid climate and annual rainfall of 700 mm (Jiang et al., 2013). Thus, the same variety may show different features in different regions of Gansu.
Climate has the greatest influence on the grapevine growing and wine production (Hidalgo, 1999). Although low temperatures (14/9°C day/night) are not conducive to high concentrations of anthocyanin (Coombe, 1987), temperatures of 30°C or higher lead to lower anthocyanin synthesis (Spayd et al., 2002; Tarara et al., 2008). The anthocyanin accumulation is inhibited in regions where the temperature is higher, and the controlled high temperature decreases their contents (Kliewer, 1970; Mori et al., 2007; Winkler et al., 1962). Several studies have demonstrated a positive association between temperature and seed number or total proanthocyanidin concentrations per
berry at harvest (Del Rio & Kennedy, 2006; Ewart & Kliewer, 1977). The influence of temperature on total acidity has been widely discussed (Koundouras et al., 2006) and higher concentrations have been reported in grapes grown in cool regions than that of grapes from warm regions (Lakso & Kliewer, 1975). In the present study, the temperature of Zhangye was moderate when compared with that of Wuwei and Jiayuguan, and the low temperatures and GDD of Jiayuguan might have resulted in the low concentrations of phenols (Table 3).
3.3 Analysis of chemical and physical properties of the soil
The selected soils from three regions had different physical and chemical properties (Table 4). The soils from Wuwei and Jiayuguan were classified as ‘clay’ according to the texture classes in the soil survey manual. However, the soil from Zhangye was classified as ‘sand’, because the soil from Zhangye was richer than that of Wuwei and Jiayuguan. Specifically, the sand percentage was 85.59% in Zhangye, and only 44.92% and 40.28% in Wuwei and Jiayuguan, respectively (Table 4).
Higher organic material may result in less compact soils. In the present study, the concentrations of organic matter and total N, P, and K of the soil samples were higher in Wuwei than in the other two regions (Table 4). This suggests that there are different physical and chemical properties of the soils in different regions of Gansu.
The pH of soils in the three regions ranged from 8.0-9.0 (alkaline). At pH values from 5.0 to 5.5, grapevine performance should not be seriously impeded (Conradie, 1983), and none of the soils showed any signs of sodicity in the experimental regions. Among the physical and chemical indicators, those most used by winegrowers are soil bulk density, pH, availability of major nutrients (N, P, K, Ca, Mg), and organic matter content, which is known to increase soil water holding capacity to promote soil aggregation and constitute a pool of available nutrients (Haynes, 1999; Morlat & Chaussod, 2008; Teixeira et al., 2011). The soil properties have great influence on grape and wine quality (Esteban et al., 2001; Gurovich & Páez, 2004). The content of nitrogen was associated with grape and wine quality, which when in excess can affect the contents of sugar and phenolics in grapes (Xoné et al., 2001; Hilbert et al., 2003). Studies on terroir have shown that moderate nitrogen deficiency has been associated with improved fruit quality (Xoné et al., 2001). Thus, moderate temperature and nitrogen deficiency results in better performance of grape quality. In addition, the influence of environment and soil on grape compositions should be correlated with characteristics of different varieties.
Table 3. Main climate parameters for the growing season (April–Dctober) and the ripening period (August–September) in the studied regions.
Regions
Average temperature (°C)
Average maximum temperature (°C)
Average minimum temperature (°C)
Growing degree days (°C)
Sunlight duration (hour)
Rain (mm)
Aug -Sep
Apr -Dct
Year Aug -Sep
Apr -Dct
Year Aug -Sep
Apr -Dct
Year Aug -Sep
Apr -Dct
Year Aug -Sep
Apr -Dct
Year Aug -Sep
Apr -Dct
Year
3.4 The comprehensive quality ratings of the of red and white wine grapes
All parameters evaluated were standardized using a standardization method. The eigenvalues, the cumulative proportions, and the eigenvectors are shown in Table S1 and Table S2. Using the dimension-reduction technique, Prin1, Prin2, and Prin3 explained respectively 43.86%, 30.93%, and 15.26% of the total variance for red wine grapes; thus, the first three principal components were selected, accounting for 90.05% of the total variance (Table S1). As for the white grapes, Prin1, Prin2, and Prin3 explained respectively 55.36%, 25.50% and 19.14% of the total variance, and the three major components were selected because they accounted for 100.00% of the total variance (Table S1). Then, the predictive models (Q) of the red and white wine grapes were established, respectively, using the principal components and their cumulative proportions. Lastly, the comprehensive quality ratings of the wine grapes were determined based on the Q values. Specifically, the higher the Q value, the better the performance of the grape quality. The general evaluation of the red and white wine grape
quality in the corridor area is shown in Table S3. Among the four red wine grapes from the three regions evaluated, ‘Merlot’ grown in Zhangye had the best quality, followed by ‘Cabernet Sauvignon’ grown in Wuwei and ‘Cabernet Gernischet’ grown in Zhangye. Dn the other hand, ‘Merlot’ was better in Zhangye and Jiayuguan. In Wuwei, ‘Cabernet Sauvignon’ had the best quality than that the other varieties. As for the two white wine grapes from the three regions, ‘Vidal’ grown in Jiayuguan ranked first, followed by ‘Italian Riesling’ grown in Zhangye. In addition, ‘Pinot Noir’ and ‘Italian Riesling’ grown in Wuwe had the lowest scores among the red and white wine grapes, respectively.
3.5 Antioxidant capacity of grapes grown in the Corridor Area
Different methods are used to determine the antioxidant capacity of fruits (Apak et al., 2004; Brand-Williams et al., 1995; Li et al., 1996; Zhishen et al., 1999). We chose four indexes to evaluate the antioxidant capacity of grapes grown in different regions of the corridor area based on the antioxidant concentrations (total flavonoids and flavanols), reducing Table 4. Physical and chemical properties of the selected soils from three different wine grape growing regions in Gansu province of China.
Regions Clay (%)
Slit (%)
Sand (%)
Textural Class
pH Drganic
matter (%)
Total N (%)
Total P (%)
Total K (%)
Zhangye 6.32 8.10 85.59 Sand 9.00 0.28 0.07 0.10 1.35
Wuwei 33.02 22.07 44.92 Clay 8.46 0.93 0.16 0.16 1.56
Jiayuguan 36.33 23.39 40.28 Clay 8.18 0.69 0.11 0.12 1.40
capacity (the copper (II) (or cupric) ion reducing ability), and radical-scavenging activity (DPPH). The concentrations of total flavonoids and flavanols, CUPRAC and DPPH clearance rate in ‘Merlot’, ‘Cabernet Grnischet’, and ‘Italian Resling’ grapes grown in Zhangye was significantly higher than those of Wuwei and Jiayuguan although there was no significant difference in DPPH clearance rate for ‘Italian Resling’ among the three regions (Figure 1). ‘Cabernet Sauvignon’ grown in Wuwei and Jiayuguan showed no significant difference in the concentrations of total flavonoids (Figure 1A), but ‘Cabernet Sauvignon’ grown in Jiayuguan had higher concentrations of total flavanols (Figure 1B). ‘Cabernet Sauvignon’ grown in Wuwei had higher value of CUPRAC than that of Jiayuguan (Figure 1C), but ‘Cabernet Sauvignon’ grown in Wuwei and Jiayuguan had no significant difference in DPPH clearance rate (Figure 1D).
Moreover, the concentrations of total flavonoids and flavanols, CUPRAC, and DPPH clearance rate of the red grapes were higher than those of the white grapes in general (‘Vidal’ had higher values of total flavonoids and flavanols, and CUPRAC, than those of ‘Pinot Noir’). In Zhangye, the concentrations of total flavonoids and flavanols in ‘Merlot’ grapes were 241.1 mg/L and 162.3 mg/L, respectively, which were 25-30% higher than those in ‘Cabernet Gernischet’ grapes. However, the concentrations of total flavonoids and flavanols of ‘Merlot’ grapes were lower than those of ‘Cabernet Grnischet’ and ‘Cabernet Sauvignon’ grapes grown in Wuwei and Jiayuguan. This suggests that the influence of environment on the quality of wine grapes was greater than that of the variety characteristics. ‘Merlot’ grapes grown in Zhangye had the highest values of CUPRAC and DPPH, followed by ‘Cabernet Gernischet’ grapes grown in Zhangye and ‘Cabernet Sauvignon’ grown in Wuwei (Figure 1C and D). ‘Italian Resling’ grapes showed the lowest values of CUPRAC and DPPH in all regions.
There are many studies that have reported that the antioxidant capacity of grapes and wines is closely related to their content of phenolic compounds (Cimino et al., 2007; Minussi et al., 2003). Flavonoids, as the most abundant phenolics, are important for their antioxidant and free radical scavenging activities; its content can reflect the antioxidant capacity of the fruit (Verzelloni et al., 2007). In the present study, the concentrations of total flavonoids and flavanols were higher in the red grapes than in the white grapes, in general, and the ‘Merlot’ grapes grown in Zhangye had the highest concentrations of total flavonoids and flavanols. These results are in agreement with our findings of the chemical analysis of the phenolics in the main grape varieties (Figure 1). Moreover, the CUPRAC and DPPH clearance rate also showed consistency with the chemical analysis results, Figure 1.
4 Conclusions
The chemical analysis and the antioxidant capacity measurements in the grapes of main wine grape varieties cultivated in the corridor area were investigated and compared. Three interesting results were found in the present study: ‘Merlot’ grapes grown in Zhangye had the best quality among the different varieties in the three regions of Gansu; the moderate temperature and nitrogen deficiency were associated with improved fruit quality; and the most suitable grape variety
in the region Zhangye is ‘Merlot’, and in the regions Wuwei and Jiayuguan, the most suitable grape varieties are ‘Cabernet Sauvignon’ and ‘Italian Resling’, respectively.
Acknowledgements
The authors acknowledge the grant provided by the China Technology System for Grape Industry (CARS-30). The authors would like to thank the College of Resources and Environment, Northwest A&F University for providing technical support and laboratory facilities during the course of this study.
References
Apak, R., Güçlü, K., Dzyürek, M., & Karademir, S. E. (2004). Novel total antioxidant capacity index for dietary polyphenols and vitamins C and E, using their cupric ion reducing capability in the presence of neocuproine: CUPRAC method. Journal of Agricultural and Food Chemistry, 52(26), 7970-7981. http://dx.doi.org/10.1021/jf048741x. PMid:15612784
Brand-Williams, W., Cuvelier, M., & Berset, C. (1995). Use of a free radical method to evaluate antioxidant activity. LWT-Food Science and Technology, 28(1), 25-30. http://dx.doi.org/10.1016/S0023-6438(95)80008-5.
Brouillard, R., Chassaing, S., & Fougerousse, A. (2003). Why are grape/ fresh wine anthocyanins so simple and why is it that red wine color lasts so long? Phytochemistry, 64(7), 1179-1186. http://dx.doi. org/10.1016/S0031-9422(03)00518-1. PMid:14599515
China National Standardization Administration. (2006). GB/T 15038-2006 Ampeliology analytical methods of wine and fruit wine (pp. 2-23). Beijing, China: China Standards Press.
Cimino, F., Sulfaro, V., Trombetta, D., Saija, A., & Tomaino, A. (2007). Radicalscavenging capacity of several Italian red wines.
Food Chemistry, 103(1), 75-81. http://dx.doi.org/10.1016/j. foodchem.2006.07.042.
Conradie, W. J. (1983). Liming and choice of rootstocks as cultural techniques for vines in acid soils. South African Journal for Enology and Viticulture, 4(2), 39-44.
Cook, N. C., & Samman, S. (1996). Flavonoids-chemistry, metabolism, cardioprotective effects, and dietary sources. The Journal of Nutritional Biochemistry, 7(2), 66-76. http://dx.doi. org/10.1016/0955-2863(95)00168-9.
Coombe, B. G. (1987). Influence of temperature on composition and quality of grapes. In ISHS Acta Horticulturae 206: Symposium on Grapevine Canopy and Vigor Management, XXII IHC (pp. 23-35). Davis, USA.
Daudt, C. E., & Fogaça, A. D. (2013). Phenolic compounds in Merlot wines from two wine regions of Rio Grande do Sul, Brazil. Food Science and Technology (Campinas.), 33(2), 355-361. http://dx.doi. org/10.1590/S0101-20612013005000045.
Del Rio, J. L. P., & Kennedy, J. A. (2006). Development of
proanthocyanidins in Vitis vinifera L. cv. Pinot noir grapes and extraction into wine. American Journal of Enology and Viticulture,
57(2), 125-132.
Deloire, A., Vaudour, E., Carey, V., Bonnardot, V., & Van Leeuwen, C. (2005). Grapevine responses to terroir, a global approach. Journal International des Sciences de la Vigne et du Vin, 39(4), 149-162. Eberhardt, M. V., Lee, C. Y., & Liu, R. H. (2000). Antioxidant activity
of fresh apples. Nature, 405(6789), 903-904. PMid:10879522. Esteban, M., Villanueva, M. J., & Lissarrague, J. R. (2001). Effect of
of cv. Tempranillo (Vitis vinifera L.) grape berries during ripening.
Journal of the Science of Food and Agriculture, 81(4), 409-420. http://dx.doi.org/10.1002/1097-0010(200103)81:4<409::AID-JSFA830>3.0.CD;2-H.
Ewart, A., & Kliewer, W. M. (1977). Effects of controlled day and night temperatures and nitrogen on fruit-set, ovule fertility, and fruit composition of several wine grape cultivars. American Journal of Enology and Viticulture, 28(2), 88-95.
Garrido, J., & Borges, F. (2011). Wine and grape polyphenols––A chemical perspective. Food Research International, 44(10), 3134-3148. http://dx.doi.org/10.1016/j.foodres.2011.11.001.
Gurovich, L. A., & Páez, C. I. (2004). Influencia del riego deficitario controlado sobre el desarrollo de las bayas y la composición química de los mostos y vinos. Ciencia e investigación agraria, 31(3), 175-186. Haynes, R. J. (1999). Labile organic matter fractions and aggregate
stability under short-term, grass-based leys. Soil Biology & Biochemistry, 31(13), 1821-1830. http://dx.doi.org/10.1016/S0038-0717(99)00102-9.
Hidalgo, L. (1999). Tratado de viticultura general (pp. 1172). Madrid: Mundi-Prensa.
Hilbert, G., Soyer, J. P., Molot, C., Giraudon, J., Milin, S., & Gaudillere, J. P. (2003). Effects of nitrogen supply on must quality and anthocyanin accumulation in berries of cv. Merlot. Vitis, 42(2), 69-76.
Jackson, R. S. (2008). Wine science: principle and applications (3rd ed., pp. 287-295). Dxford: Elsevier-Academic Press.
Jiang, B., Xi, Z. M., Luo, M., & Zhang, Z. W. (2013). Comparison on aroma compounds in Cabernet Sauvignon and Merlot wines from four wine grape-growing regions in China. Food Research International, 51(2), 482-489. http://dx.doi.org/10.1016/j. foodres.2013.01.001.
Kawaii, S., Tomono, Y., Katase, E., Dgawa, K., & Yano, M. (1999). Antiproliferative effects of the readily extractable fractions prepared from various citrus juices on several cancer cell lines. Journal of Agricultural and Food Chemistry, 47(7), 2509-2512. http://dx.doi. org/10.1021/jf9812228. PMid:10552518
Kennedy, J. A. (2008). Grape and wine phenolics: Dbservations and recent findings. Ciencia e Investigación Agrari, 35(2), 107-120. Kim, M. Y., Choi, S. W., & Chung, S. K. (2000). Antioxidative flavonoids
from the garlic (Allium sativum L.) shoot. Food Science and Biotechnology, 9, 199-203.
Kliewer, W. (1970). Effect of day temperature and light intensity on coloration of Vitis vinifera L. grapes. Journal of the America Society Horticultural Science, 95(6), 693-697.
Koundouras, S., Marinos, V., Gkoulioti, A., Kotseridis, Y., & van Leeuwen, C. (2006). Influence of vineyard location and vine water status on fruit maturation of nonirrigated cv. Agiorgitiko (Vitis vinifera L.). Effects on wine phenolic and aroma components.
Journal of Agricultural and Food Chemistry, 54(14), 5077-5086. http://dx.doi.org/10.1021/jf0605446. PMid:16819919
Lakso, A. N., & Kliewer, W. M. (1975). The influence of temperature on malic Acid metabolism in grape berries: I. Enzyme responses. Plant Physiology, 56(3), 370-372. http://dx.doi.org/10.1104/pp.56.3.370. PMid:16659305
Li, Y. G., Tanner, G., & Larkin, P. (1996). The DMACA–HCl protocol and the threshold proanthocyanidin content for bloat safety in forage legumes. Journal of the Science of Food and Agriculture, 70(1), 89-101. http://dx.doi.org/10.1002/(SICI)1097-0010(199601)70:1<89::AID-JSFA470>3.0.CD;2-N.
Minussi, R. C., Rossi, M., Bologna, L., Cordi, L., Rotilio, D., Pastore, G. M., & Durán, N. (2003). Phenolic compounds and total antioxidant potential of commercial wines. Food Chemistry, 82(3), 409-416. http://dx.doi.org/10.1016/S0308-8146(02)00590-3.
Mori, K., Goto-Yamamoto, N., Kitayama, M., & Hashizume, K. (2007). Loss of anthocyanins in red-wine grape under high temperature.
Journal of Experimental Botany, 58(8), 1935-1945. http://dx.doi. org/10.1093/jxb/erm055. PMid:17452755
Morlat, R., & Chaussod, R. (2008). Long-term additions of organic amendments in a Loire valley vineyard. I. Effects on properties of a calcareous sandy soil. American Journal of Enology and Viticulture,
59(4), 353-363.
Pereira, G. E., Gaudillere, J.-P., Leeuwen, C., Hilbert, G., Maucourt, M., Deborde, C., Moing, A., & Rolin, D. (2006). H-1 NMR metabolite fingerprints of grape berry: comparison of vintage and soil effects in Bordeaux grapevine growing areas. Analytica Chimica Acta,
563(1-2), 346-352. http://dx.doi.org/10.1016/j.aca.2005.11.007. Sarneckis, C. J., Dambergs, R. G., Jones, P., Mercurio, M., Herderich,
M. J., & Smith, P. A. (2006). Quantification of condensed tannins by precipitation with methyl cellulose: development and validation of an optimised tool for grape and wine analysis. Australian Journal of Grape and Wine Research, 12(1), 39-49. http://dx.doi. org/10.1111/j.1755-0238.2006.tb00042.x.
Soil Survey Division Staff. (1993). Soil survey manual (United States
Department of Agriculture Handbook, No. 18). Washington: United
States Department of Agriculture.
Spayd, S. E., Tarara, J. M., Mee, D. L., & Ferguson, J. C. (2002). Separation of sunlight and temperature effects on the composition of Vitis Vinifera cv. Merlot berries. American Journal of Enology and Viticulture, 53(3), 171-182.
Tarara, J. M., Lee, J., Spayd, S. E., & Scagel, C. F. (2008). Berry temperature and solar radiation alter acylation, proportion, and concentration of anthocyanin in merlot grapes. American Journal of Enology and Viticulture, 59(3), 235-247.
Teixeira, R. F. M., Domingos, T., Costa, A., Dliveira, R., Farropas, L., Calouro, F., Barradas, A. M., & Carneiro, J. (2011). Soil organic matter dynamics in portuguese natural and sown rainfed grasslands.
Ecological Modelling, 222(4), 993-1001. http://dx.doi.org/10.1016/j. ecolmodel.2010.11.013.
Verzelloni, E., Tagliazucchi, D., & Conte, A. (2007). Relationship between the antioxidant properties and the phenolic and flavonoid content in traditional balsamic vinegar. Food Chemistry, 105(2), 564-571. http://dx.doi.org/10.1016/j.foodchem.2007.04.014. Vidal, S., Francis, L., Guyot, S., Marnet, N., Kwiatkowski, M., Gawel, R.,
Cheynier, V., & Waters, E. J. (2003). The mouth-feel properties of grape and apple proanthocyanidins in a wine-like medium. Journal of the Science of Food and Agriculture, 83(6), 564-573. http://dx.doi. org/10.1002/jsfa.1394.
Winkler, A. J., Cook, J. A., Kliewer, W. M., & Lider, L. A. (1962). Development and composition of grapes. In A. J. Winkler, General viticulture (pp. 138-196). Berkeley: University of California Press. Wrolstad, R. E., Durst, R. W., & Lee, J. (2005). Tracking color and
pigment changes in anthocyanin products. Trends in Food Science & Technology, 16(9), 423-428. http://dx.doi.org/10.1016/j. tifs.2005.03.019.
Xoné, X., Van Leeuwen, C., Chéry, P., & Ribéreau-Gayon, P. (2001). Terroir influence on water status and nitrogen status of non-irrigated Cabernet Sauvignon (Vitis vinifera). Vegetative development, must and wine composition (Example of a Medoc Top Estate Vineyard, Saint Julien Area, Bordeaux, 1997). South African Journal for Enology and Viticulture, 22(1), 8-15.