Received 6/1/2010 Accepted 5/6/2010 (004613)
1 Centro Tecnologia de Frutas e Hortaliças - FRUTHOTEC, Instituto de Tecnologia de Alimentos - ITAL, CEP 13070-178, Campinas, SP, Brasil, e-mail: [email protected] 2 Apta Regional (Pólo Centro Sul), CEP 13412-050, Piracicaba, SP, Brasil
3 Centro de Ciência e Qualidade dos Alimentos – CCQA, Instituto de Tecnologia de Alimentos - ITAL , CEP 13070-178, Campinas, SP, Brasil
4 Centro de Tecnologia de Cereais e Chocolates – CEREAL CHOCOTEC, Instituto de Tecnologia de Alimentos - ITAL, CEP 13070-178, Campinas, SP, Brasil 5 Faculdade de Engenharia de Alimentos, Universidade de Campinas - UNICAMP, CEP 13083862, Campinas, SP, Brasil
*Corresponding author
Color degradation kinetics in low-calorie strawberry and guava jellies
Cinética de degradação de cor em geleias light de morango e de goiaba
Silvia Cristina Sobottka Rolim de MOURA1*, Patrícia PRATI2, Fernanda Zaratini VISSOTTO3, Rita de Cássia Salvucci Celeste ORMENESE4, Marina dos Santos RAFACHO5
1 Introduction
The world is perceived by human beings through their senses, from which sight is the most pronounced one. Visual impact does not involve objects form and aspect only, but also their color. In food industry, color constitutes an important parameter applied to quality control, since acceptance or rejection of a given food occurs mainly through human eyes (TORREZAN et al., 2000).
Fruit species have different types of pigment which may somehow influence the resistance to color degradation. Strawberry has anthocyanin pigment, and its stability may be affected by other components of the fruit, such as ascorbic acid and phenolic components (MOURA et al., 2001). Regarding guava pulp, the color varies from yellow to red as a result of the presence of carotenoids (β-carotene and lycopene) (TORREZAN et al., 2000). Process conditions and storage
period also influence color deterioration of products containing anthocyanin and carotenoids.
Anthocyanin stability in spinach fruit strata (Basella rubra L.) in relation to degradation factors such as light, temperature and pH, acting separately or jointly, was studied by Ozela, Stringheta and Chauca (2007). The authors concluded that pigments extracted from fruit are more stable under pH 5 and pH 6. Moreover, they verified that temperature increase and light presence affect pigment stability. Degradation reaction followed first order, with half-life period from 2 (40 °C) to 6 hours (60 °C). Ferreira (2001) conducted an α-carotene, β-carotene, lutein, and lycopene degradation kinetics study in model systems of low moisture content (corn starch, potato starch and microcrystalline cellulose) and aqueous at room temperature, both in the presence of light and in the dark. The results showed
Resumo
O objetivo do estudo foi o acompanhamento das alterações de cor em geleias de morango e goiaba light, durante a estocagem. Para o estudo, uma formulação de cada sabor foi preparada, variando a aplicação de hidrocoloides (pectina e amido modificado). As geleias foram caracterizadas quanto ao pH, sólidos solúveis, atividade de água e sinérese. Para acompanhamento das alterações de cor, as amostras permaneceram armazenadas durante 180 dias em câmaras com temperaturas controladas de 10 °C (controle) e 25 °C (comercial) e, a cada 30 dias, foram realizadas análises instrumentais de cor (L*, a* e b*). O modelo de Arrhenius foi aplicado às velocidades de reação (k), nas diferentes temperaturas, mostrando que as geleias de morango e goiaba light apresentaram maiores alterações quando armazenadas na temperatura de 25 °C, quando comparadas com as amostras armazenadas a 10 °C. Foram obtidos valores de energia de ativação entre 13 e 15 kcal.mol-1 e valores de Q
10 entre 2,1 e 2,3, para geleia lightde morango e geleia light de goiaba, respectivamente. Concluiu-se, portanto,
que, em termos de alterações de cor, a cada 10 °C de aumento de temperatura a vida de prateleira das geleias light foi reduzida pela metade.
Palavras-chave: doce light; estudo cinético; alterações de cor.
Abstract
The purpose of this study was to follow-up color changes in low-calorie strawberry and guava jellies during storage. To this end, one formulation of each flavor was prepared varying the application of hydrocolloids (pectin and modified starch). The jellies were studied regarding pH, soluble solids, water activity and syneresis. In order to follow-up color changes, the samples remained stored for 180 days in chambers with controlled temperatures of 10 °C (control) and 25 °C (commercial), and color instrumental analyses (L*, a*, and b*) were performed every 30 days. Arrhenius model was applied to reaction speeds (k) at different temperatures, where light strawberry and guava jellies showed greater color changes when stored at 25 °C compared to the samples stored at 10 °C. Activation energy values between 13 and 15 kcal.mol-1 and Q
10
values between 2.1 and 2.3 were obtained for light strawberry jelly and light guava jelly, respectively. Therefore, it was concluded that, with respect to color changes, every 10 °C temperature increase reduces light jellies shelf-life by half.
Keywords: low-calorie sweets; kinetic study; color alterations.
With this premise, the purpose of this research was to study the low-calorie (“light”) strawberry and guava jellies varying the application of hydrocolloids and assessing color stability products over time.
2 Materials and methods
Strawberry and guava jelly samples were elaborated in pilot scale, using a steam jacketed tank, with stirring, to the atmospheric pressure. The process comprises the following: formulation (fruit pulp, sucrose, glucose, pectin), concentration, addition of citric acid and potassium sorbate, hot filling, closure, flasks reversal, cooling, and storage.
Sample formulations had 60% of pulp, 23% of glucose (Excell 1040), 13.3% of sucrose, 0.2% of citric acid, and 0.05% of potassium sorbate. The hydrocolloids applied were:
• Strawberry: 1% Pectin (8003) – CpKelco, and 0.8%
Modified starch (Snow-Flake 6704) – Corn Products;
• Guava: 1% Pectin (8003) – CpKelco;
The choice of hydrocolloid type and the percentage of application were defined in preliminary studies (FEFIM et al., 2006; MOURA et al., 2006) based on manufacturer’s information, texture and rheological behavior analyses initially conducted for standard solutions and for jellies thereafter.
Product end point was obtained by soluble solid contents of 40 °Brix, through a refractometer. Hot filling (above 85 °C) was performed in 267 mL-glass flasks and closing was performed with metal lug closures (type ARJEK BR-1 63) with four clips (Rojek Ltda.) and flasks reversal for around 3 minutes. At first, cooling was performed in water bath 60 °C, and after a few minutes cold water flow was initiated in the tank, avoiding a sudden thermal shock and possible glass breaking. Product cooling was conducted in a tank with running water until the temperature of 38-40 °C was reached. This technique is recommended so packages can dry naturally and faster, avoiding rust formation in cans and glassware closures.
One batch of each formulation was obtained i.e. two processes were made and in each one of them, 50 flasks were gotten and equally distributed in chambers with controlled temperatures of 10 °C (control) and 25 °C (commercial) in the absence of light.
In order to study the samples, physical-chemical evaluations of pH (INSTITUTO ADOLFO LUTZ, 1985), soluble solids (INSTITUTO ADOLFO LUTZ, 1985), water activity
(DECAGON CX-2), and syneresis (BAIDÓN et al., 1987) were performed.
Instrumental color was followed-up in colorimeter Color Eye 2020 Plus, Macbeth (Newburgh, USA), with software COMCOR 1500Plus, illuminant D65 (daylight), observation angle of 10°, for a period of 180 days. The results were presented using CIELab system (parameters L*, a*, b*). For statistical analysis, software SAS (STATISTICAL ANALISYS SYSTEM INSTITUTE, 1993) was used with an Analysis of Variance (Anova) and means test (Tukey) at p < 0.05.
predominance of first order kinetics model. In the dark, guava lycopene and β-carotene demonstrated lower degradation rates. Light exhibited prominent effect on carotenoids degradation in model systems and lyophilized food.
1st order reaction is that in which conversion speed depends on reagents concentration as shown below. Thus, for a reaction such as:
A + 02 → A oxidized
Where reagent oxygen is not limited by diffusion, we will have Equation 1:
0 ln A A C k t C = − × (1) ( ) 0 exp A A
C =C × − ×k t
By integrating them, we have Equation 2:
A
A A
dC
r k C
dt − − = = × (2) A A dC k dt
C = − ×
Consequently, every time the decrease or increase of a reagent concentration is plotted on a monologarithmic scale in view of reaction time and a straight line is obtained, a 1st order reaction is being studied. A slope of straight line drawn represents constant reaction speeds (k).
Several authors have used color parameters (L*, a*, b*) and sensorial evaluations to establish the shelf-life of fruit products
(JAYARAMAN, 1998; NEGRETE, 2001; MOURA et al., 2001,
2007; NACHTIGALL et al., 2004). The results obtained have demonstrated that fruit samples may suffer color and taste variation when stored at room temperature.
The demand for low-calorie food has stimulated the use of fruits as ingredients, since it allows for products with low caloric value and characteristics similar to conventional food (CAMPOS; CÂNDIDO, 1995). The low-calorie products market has noticeably increased, incited by a great number of
consumers concerned about their health (SALGADO, 2001).
According to the Ordinance of ‘Secretaria de Vigilância em Saúde do Ministério da Saúde’- SVS/MS [Health Surveillance Department of the Ministry of Health], Brazil, no. 27 of 01/13/98, “light” means a statement of a nutritional property of the product meaning a reduction in a given nutrient or caloric value content. Nevertheless, it is required that this reduction be of at least 25% compared to the conventional value so that the product be considered as “light” (FREITAS, 2005).
3.2 Follow-up of instrumental color of low-calorie strawberry and guava jellies
Strawberry Jelly
Table 2 shows the results for L*, a*, and b* parameters for strawberry jelly samples due to storage period.
In samples stored at 25 °C, a tendency of darkening (L* diminishing) and presenting a red color (+a*) with lower intensity was verified for strawberry jelly during the period of 180 days. Regarding the yellow color (+b), a significant reduction in the first 30 days of storage both 10 °C and 25 °C was verified, as well as a tendency of maintaining the color during the remaining time of assessment.
Strawberry jelly stored at 25 °C tends to present luminosity (L*) and yellow color (+b) similar to product stored at 10 °C, and a lower intensity of red color (+a*) as from the second month of evaluation.
Products containing anthocyanins, as strawberry jelly, are susceptible to color deterioration during processing and storage as a result of the combined effects of anthocyanin degradation and dark pigments formation (SKREDE et al., 1992). A similar effect occurred in a trial developed by Miguel, Albertini and Spotp (2009), when strawberry marmalade degradation kinetics was studied. According to the author, ascorbic acid oxidation may also occur through anaerobic pathway leading to the formation of hydroxymethylfurfural and furfural, respectively, which, in turn, generate melanoidines that cause darkening, as observed in the Maillard reaction. The anaerobic phase occurs during storage and tends to be more intense as temperature increases. In addition to non-enzymatic darkening (Maillard), the emergence of an unnatural taste in products, resulting in loss of quality and shelf-life reduction, is also noted.
Regarding the color attribute, low-calorie jellies usually have a less intense color than conventional formulations (NACHTIGALL et al., 2004). This is due to the application of BTM pectin, which leads to a reduction in the products coloring. However, in Nachtigall et al. (2004), a negative influence of adding starches on the coloring of blackberry jelly samples, where main pigment is anthocyanin, was not verified, and the same was observed for strawberry jelly. Every formulation had a stable behavior for 90 days, and coloring loss during storage was not observed.
The results obtained by Soler et al. (1998) in the analysis of guava paste (carotenoid pigment) luminosity (L*) showed that values from different low-calorie products for this parameter were higher than the ones for the standard sample (commercial). Those results were consistent, since standard sample had a soluble solids content of 68 °Brix, whereas low-calorie samples had contents ranging from 45-54 oBrix.
With the purpose to evaluate the reaction kinetics of color parameters for strawberry jelly, the order of color parameters reaction was studied and the reaction velocity was determined. Q10 value (Equation 4) and activation energy (Equation 5) were also established for each parameter (Table 3).
Total difference of color (∆E) was calculated as per Equation 3, where: ∆ is the difference between each color parameter of initial sample (time zero) and sample stored:
∆E = [(∆L)2 + (∆a) 2 + (∆b) 2]1/2
(3)
Analyses were performed every 30 days (triplicate) for both temperatures (10 °C and 25 °C) for 180 days, and the results were assessed for order of degradation reaction, reaction velocities (k), Q10, Ea, (activation energy), and VP (shelf-life)
(TEIXEIRA NETO; VITALI; MOURA, 2004).
In order to determine reaction order and its constant of velocity, color parameters versus time were plotted in linear graphs (order zero), logarithmic graphs (first order), and graphs of parameter inverse by time (second order), then a linear regression of such values was performed. Reaction follows the order of best regression adjustment (higher r2). The inclination achieved from linear regression of best adjustment for each temperature corresponds to the k values (velocities of reaction).
Q10, Ea, (activation energy) and VP (shelf-life) values were determined using Equations 4 and 5.
2 10 1
10
1 2
T
T T
T
T T
k VP
Q Q
k VP
∆
∆ = = = (4)
Where T2 = 25oC and T1 = 10oC
2 10 0, 46 log
Ea= ×T × Q (5)
Where T = 298 K
3 Results and discussion
3.1 Physical-chemical characterization of samples
Analyses of pH, soluble solids, Aw, and syneresis were conducted; they are shown in Table 1.
In general, different types of starch did not influence pH of low-calorie jelly; however, they evidenced pH values approximately 10% above conventional jelly, probably due to the process (NACHTIGALL et al., 2004).
The results of soluble solids of the samples elaborated in pilot scale were slightly higher than the expected values (40 °Brix). This was due to the difficulty in controlling the process in steam jacketed tanks to the atmospheric pressure.
Color changes with respect to L*, a*, and b* in strawberry jellies followed a 1st order reaction, and total color change (ΔE) followed a zero order.
First order reactions are, by far, the most common and most well-studied ones in food. Pigment destruction reactions during processing and storage are among those which follow this order
of reaction (TEIXEIRA NETO; VITALI; MOURA, 2004).
Anthocyanins degradation due to time followed a first order reaction, which complies with previously conducted
researches (CEMEROGLU; VELIOGLU; ISIK, 1994; GIUSTI;
WROLSTAD, 1996; MOURA et al., 2001; PROVENZI et al.,
2006; OZELA; STRINGHETA; CHAUCA, 2007).
The activation energy values achieved are within 10 to 30 kcal.mol-1 range, as mentioned by Lund (1979), for food color.
Table 2. Parameters L*, a*, and b* due to storage period for strawberry jelly samples. Parameter L*
Time (days) Temperature (10 °C) Temperature (25 °C) D.M.S.
0 19.46 ± 0.61A 19.46 ± 0.61A
-30 18.46 ± 0.41aBC 18.18 ± 0.39aBC 0.909
60 17.97 ± 0.08aC 17.99 ± 0.33aBC 0.539
90 19.36 ± 0.17aA 18.42 ± 0.35bABC 0.621
120 18.90 ± 0.03aAB 18.86 ± 0.04aAB 0.075
150 18.10 ± 0.15aBC 17.47 ± 0.51aC 0.857
180 18.23 ± 0.09aBC 17.44 ± 0.06bC 0.173
D.M.S. 0.822 1.063
Parameter a*
0 22.02 ± 0.48A 22.02 ± 0.48A
-30 19.97 ± 0.99aB 18.14 ± 0.74aB 1.977
60 17.42 ± 0.43aD 16.26 ± 0.47bC 1.017
90 19.48 ± 0.06aBC 15.56 ± 0.48bC 0.779
120 18.23 ± 0.21aCD 15.25 ± 0.35bCD 0.653
150 17.82 ± 0.12aD 13.97 ± 0.67bDE 1.098
180 17.59 ± 0.04aD 13.29 ± 0.22bE 0.356
D.M.S. 1.269 1.435
Parameter b*
0 12.58 ± 0.33A 12.58 ± 0.33A
-30 11.37 ± 0.52aB 11.24 ± 0.54aB 1.200
60 9.77 ± 0.23bC 10.88 ± 0.34aB 0.661
90 11.62 ± 0.21aB 11.07 ± 0.48aB 0.840
120 11.13 ± 0.11bB 11.72 ± 0.21aAB 0.385
150 10.99 ± 0.12aB 10.80 ± 0.40aB 0.663
180 10.93 ± 0.03aB 10.73 ± 0.03bB 0.061
D.M.S. 0.746 1.029
Results expressed as mean ± standard deviation of 3 determinations. D.M.S. Less significant difference at p < 0.05 as Tukey’s test. In each line, means followed by equal small letters are not significantly different at p < 0.05. In each column, means followed by equal capital letters are not significantly different at p < 0.05.
Table 3. Kinetics parameters for color change of strawberry jelly.
Kinetic parameter Temperature (°C) Temperature (°C)
L* 10 25
Order First First
k (day-1) -0.0002 -0.0004
a*
Order First First
k (day-1) -0.001 -0.0025
b*
Order First First
k (day-1) -0.0004 -0.0006
∆E
Order Zero Zero
k (day-1) 0.0097 0.0298
Q10 2.11
Ea (cal/gmol) 13.266.22
Table 1. Means and respective deviations of soluble solids, Aw, and syneresis parameters of low-calorie strawberry and guava jelly samples.
Jelly ºBrix pH Aw Syneresis (cm)
Strawberry 43.2 ± 0.2 3.56 ± 0.01 0.957 ± 0.001 0.0
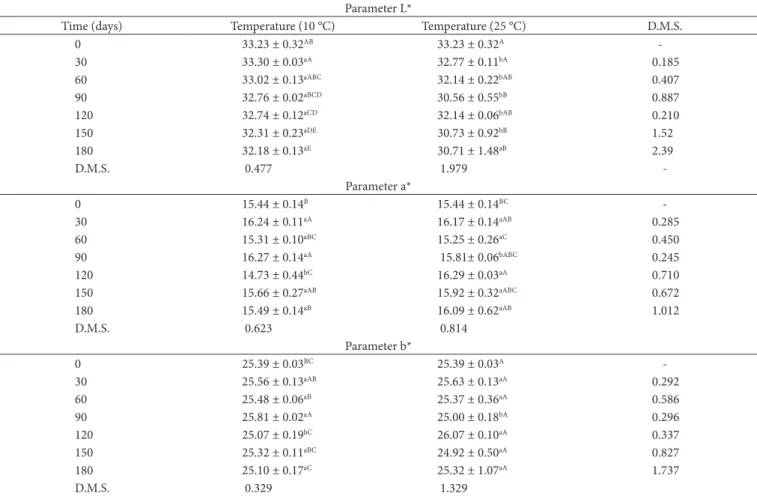
good correlation with the parameters L*, a*, b* and Chroma for guava cv. Paluma and good correlation with all parameters evaluated for the pulp of guava. For guava marmalade, only the hue parameter and the a*/b* and (a*/b*)2 reasons showed good correlation with the level of total carotenoids, due to the fact that in the process to obtain guava marmalade occurs the formation of sugar caramel with dark compounds that will also contribute to the final color of guava marmalade.
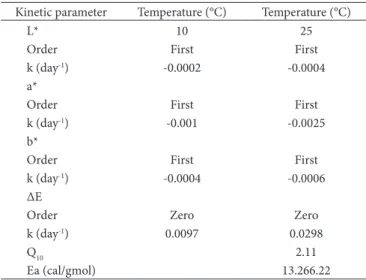
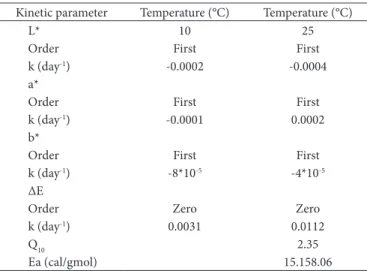
With the purpose to evaluate the reaction kinetics of color parameters for guava jelly, the order of color parameters reaction was studied and the reaction velocity was determined. Q10 value (Equation 4) and activation energy (Equation 5) were also established for each parameter (Table 5).
Color changes with respect to L*, a*, and b* in guava jellies followed 1st order reaction, and total color change (ΔE) followed a zero order.
Carotenoids degradation due to time followed a first order reaction, which is consistent with previously conducted researches (FERREIRA, 2001; ROSSO, 2006).
The Q10 mean value obtained was approximately 2.3. In Q10 = VP (T-10)/VP(T), each increase of 10 °C in storage temperature of guava sample divides shelf-life time by 2.3.
Table 4. Parameters L*, a*, and b* due to storage period for guava jelly samples. Parameter L*
Time (days) Temperature (10 °C) Temperature (25 °C) D.M.S.
0 33.23 ± 0.32AB 33.23 ± 0.32A
-30 33.30 ± 0.03aA 32.77 ± 0.11bA 0.185
60 33.02 ± 0.13aABC 32.14 ± 0.22bAB 0.407
90 32.76 ± 0.02aBCD 30.56 ± 0.55bB 0.887
120 32.74 ± 0.12aCD 32.14 ± 0.06bAB 0.210
150 32.31 ± 0.23aDE 30.73 ± 0.92bB 1.52
180 32.18 ± 0.13aE 30.71 ± 1.48aB 2.39
D.M.S. 0.477 1.979
-Parameter a*
0 15.44 ± 0.14B 15.44 ± 0.14BC
-30 16.24 ± 0.11aA 16.17 ± 0.14aAB 0.285
60 15.31 ± 0.10aBC 15.25 ± 0.26aC 0.450
90 16.27 ± 0.14aA 15.81± 0.06bABC 0.245
120 14.73 ± 0.44bC 16.29 ± 0.03aA 0.710
150 15.66 ± 0.27aAB 15.92 ± 0.32aABC 0.672
180 15.49 ± 0.14aB 16.09 ± 0.62aAB 1.012
D.M.S. 0.623 0.814
Parameter b*
0 25.39 ± 0.03BC 25.39 ± 0.03A
-30 25.56 ± 0.13aAB 25.63 ± 0.13aA 0.292
60 25.48 ± 0.06aB 25.37 ± 0.36aA 0.586
90 25.81 ± 0.02aA 25.00 ± 0.18bA 0.296
120 25.07 ± 0.19bC 26.07 ± 0.10aA 0.337
150 25.32 ± 0.11aBC 24.92 ± 0.50aA 0.827
180 25.10 ± 0.17aC 25.32 ± 1.07aA 1.737
D.M.S. 0.329 1.329
Results expressed as mean ± standard deviation of 3 determinations. D.M.S. Less significant difference at p < 0.05 as Tukey’s test. In each line, means followed by equal small letters are not significantly different at p < 0.05. In each column, means followed by equal capital letters are not significantly different at p < 0.05.
The Q10 value achieved due to reaction velocity of ΔE was approximately 2.0, meaning that reactions are accelerated by temperature, that is, each 10 °C temperature increase at this range doubles the speed of reactions.
In Q10 = VP (T-10)/VP(T), each increase of 10 °C in storage temperature of strawberry jelly divides shelf-life time by 2.0.
Guava Jelly
Table 4 shows the results of parameters L*, a*, and b* for guava jelly samples due to storage period.
Both at 10 °C and 25 °C, guava jelly sample showed a tendency of a low-calorie darkening (L* diminishing) during storage period.
Compared to sample stored at both studied temperatures, it was verified that as from the 30th day, the product stored at 25 °C was significantly (p < 0.05) darker than the product stored at 10 °C in practically every evaluation time. In general, there was no significant difference in red and yellow colors between samples at 10 °C and 25 °C.
Tasca (2007) developed a study to measure guava cv. Paluma
Dissertação (Mestrado em Tecnologia de Alimentos)-Universidade Estadual de Campinas, Campinas, 2001.
FREITAS, S. M. L. Alimentos com alegação diet light: definições, legislação e orientações para consumo. São Paulo: Atheneu, 2005. 138 p.
GIUSTI, M. M.; WROLSTAD, R. E. Radish anthocyanin extract
as a natural red colorant for Maraschino cherries. Journal of Food Science, v. 61, n. 4, p. 688-694, 1996. http://dx.doi. org/10.1111/j.1365-2621.1996.tb12182.x
INSTITUTO ADOLFO LUTZ. Normas analíticas do Instituto Adolfo Lutz. 3. ed. São Paulo: IAL, 1985. vol 1: Métodos químicos e físicos para análises de alimentos.
JAYARAMAN, K. S. Development of intermediate moisture tropical fruit and vegetable products-technological problems and prospects.
In: SEOW, C. C.; TEMG, T. T.; QUAH, C. H. Food preservation by moisture control. Londres: Elsevier Applied Science, 1998. p. 175-198.
JARDIM, D. C. P. Reações de Transformação em Alimentos - influência
da água. In: MOURA, S. C. S. R.; GERMER, S. P. M. Reações de Transformação e Vida-de-Prateleira de Alimentos Processados. 3. ed. Campinas: ITAL, 2004. cap. 2, p. 16-24.
LUND, D. B. Effect of commercial processing on nutrients. Food Technology, v. 33, n. 2, p. 28-35, 1979.
MIGUEL, A. C. A.; ALBERTINI, S.; SPOTP, M. H. F. Cinética da
degradação de geleiada de morango. Ciência e Tecnologia de Alimentos, v. 29, n. 1, p. 142-147, 2009.
MOURA, S. C. S. R. et al. Cinética de degradação de polpas de morango.
Brazilian Journal of Food Technology, v. 4, p. 115-121, 2001. MOURA, S. C. S. R. et al. Propriedades reológicas de soluções modelo
de geléias e doces em massa. In: CONGRESSO BRASILEIRO DE CIÊNCIA E TECNOLOGIA DE ALIMENTOS, 20., 2006,
Campinas. Anais… Campinas, 2006. p. 1141. 1 CD-ROM. MOURA, S. C. S. R. et al. Determinação da vida-de-prateleira de
maçã-passa por testes acelerados. Ciência e Tecnologia de Alimentos, v. 27, n. 1, p. 141-148, 2007.
NACHTIGALL, A. M. et al. Geléias light de amora-preta . Boletim do CEPPA, v. 22, n. 2, p. 337-354, 2004.
NEGRETE, V. Desenvolvimentode processo a vácuo para geléia de acerola (Malpighia emarginata, Malpighia glabra). 2001. 92 f. Dissertação (Mestrado em Tecnologia de Alimentos)-Universidade Estadual de Campinas, Campinas, 2001.
OZELA, E. F.; STRINGHETA, P. C.; CHAUCA, M. C. Stability of
anthocyanin in spinach vine (Basella rubra) fruits.Ciencia e Investigación Agrária, v. 34, n. 2, p. 115-120, 2007.
PROVENZI G. et al. Estabilidade de Antocianinas de Uvas Cabernet
Sauvignon com β- e γ-Ciclodextrinas, Brazilian Journal of Food Technology, v. 9, n. 3, p. 165-170, 2006.
ROSSO, V. V. Composição de carotenóides e antocianinas em acerola: estabilidade e atividade antioxidante em sistemas-modelo de extratos antociânicos de acerola e de açaí. 2006. 136 f. Tese (Doutorado em Ciências de Alimentos)-Universidade Estadual de Campinas, Campinas, 2006.
SALGADO, J. M. Adoçantes dietéticos: doçura que não vem da cana.
Diário Popular, Saúde, p. 2-3, 4, 2001.
STATISTICAL ANALISYS SYSTEM INSTITUTE - SAS. SAS User´s Guide: Statistics. Cary: SAS Inst., 1993.
SKREDE, G. et al. Color stability of strawberry and blackcurrant syrups.
Journal of Food Science, v. 57, n. 1, p. 172-177, 1992. http://dx.doi. org/10.1111/j.1365-2621.1992.tb05449.x
4 Conclusions
In study conditions, it was observed that color changes depend on the temperature and treatment period.
Low-calorie strawberry and guava jellies stored at temperature of 25 °C have suffered bigger color changes than those stored at 10 °C.
Strawberry and guava jellies have become darker (L* diminishing) during the storage period of 180 days.
Based on the Q10 found, regarding color changes, every 10 °C temperature increase reduces light jellies shelf-life by half.
Acknowledgements
The authors are grateful to CNPq for the granting of the scientific initiation studentship, to ‘Supergelados Jundiaí’ for providing the fruit pulps, and to ‘CpKelco’ and ‘Corn Products’ for the input supplying.
References
BAIDÓN, S. et al. Sineresis de los geles de agar y kappa-carragenato. Influencia de la adición de gomas de garrafin y guar. Revista de Agroquímica y Tecnología de Alimentos,v. 27, n. 4, p. 545-555, 1987
CAMPOS, A. M.; CÂNDIDO, L. M. B. Formulação e avaliação físico-química e reológica de geléias de baixo teor de sólidos solúveis com diferentes adoçantes e edulcorantes. Ciência e Tecnologia de Alimentos, v. 15, n. 3, p. 268-278, 1995.
CEMEROGLU, B.; VELIOGLU, S.; ISIK, S. Degradation kinetics
of anthocyanins in sour cherry juice and concentrate. Journal of Food Science, v. 59, p. 1216-1218, 1994. http://dx.doi. org/10.1111/j.1365-2621.1994.tb14680.x
FEFIM, D. A. et al. Estudo do emprego de hidrocolóides em soluções modelo de geléias e doces cremosos light. In: SEMINÁRIO DE INICIAÇÃO CIENTÍFICA PIBIC CNPq-ITAL, 13., 2006, Campinas. Anais… Campinas: CNPq-ITAL, 2006. 1 CD-ROM. FERREIRA, J. E. M. Cinética e fatores que influenciam na degradação
de carotenóides em sistemas modelos e alimentos.2001. 85 f.
Table 5. Kinetics parameters for color change of guava jelly.
Kinetic parameter Temperature (°C) Temperature (°C)
L* 10 25
Order First First
k (day-1) -0.0002 -0.0004
a*
Order First First
k (day-1) -0.0001 0.0002
b*
Order First First
k (day-1) -8*10-5 -4*10-5
∆E
Order Zero Zero
k (day-1) 0.0031 0.0112
Q10 2.35
TEIXEIRA NETO, R. O.; VITALI, A. A.; MOURA, S. C. S. R.
Introdução à Cinética de Reação em Alimentos. In: MOURA,
S. C. S. R.; GERMER, S. P. M. Reações de Transformação e Vida-de-Prateleira de Alimentos Processados. 3. ed. Campinas: ITAL, 2004. cap. 3, p. 25-47.
TORREZAN, R. et al. Efeito da adição de ingredientes na cor de polpa de goiaba. Boletim do CEPPA, v. 18, n. 2, p. 209-220, 2000. SOLER, M. P. et al. Aplicação de hidrocolóides na formulação de
goiabada com baixo teor de açúcar. Boletim SBCTA, v. 32, n. 1, p. 30-34, 1998.