Effects of calcium to non-phytate phosphorus ratio and different sources of
vitamin D on growth performance and bone mineralization in broiler chickens
Jincheng Han
1, Jianguo Wang
1,2, Guanhua Chen
1,2, Hongxia Qu
1, Jinliang Zhang
1,
Chuanxin Shi
1, Yongfeng Yan
1, Yeonghsiang Cheng
3 1 Shangqiu Normal University, College of Life Science, Department of Animal Science, Shangqiu, Henan, China. 2 Henan Agricultural University, College of Animal Husbandry and Veterinary Science, Zhengzhou, Henan, China. 3 National Ilan University, Department of Biotechnology and Animal Science, I-Lan, Taiwan.ABSTRACT - A 7 × 2 factorial experiment was designed to test the effects of calcium (Ca) to non-phytate phosphorus (NPP) ratio (1.14, 1.43, 1.71, 2.00, 2.29, 2.57, and 2.86) and different sources of vitamin D (1α-hydroxycholecalciferol (1α-OH-D3) and 25-hydroxycholecalciferol (25-OH-D3)) on growth performance and bone mineralization in 1- to 42-d-old broiler chickens. On the day of hatch, 700 female Ross 308 broilers were weighed and randomly assigned to 14 treatments with five stainless steel cages of 10 birds each. Dietary Ca levels were 4.0, 5.0, 6.0, 7.0, 8.0, 9.0, and 10.0 g kg−1 and the NPP content
was 3.5 g kg−1. The dose of 1α-OH-D
3 or 25-OH-D3 was 5 µg kg−1. Diets were not supplemented with cholecalciferol (vitamin
D3). Results showed that the Ca to NPP ratio, vitamin D source, and their interaction affected body weight gain (BWG), feed intake (FI), feed efficiency (FE), and carcass and breast yields, as well as tibia weight and length and ash weight in broiler chickens from 1 to 42 d of age. Broilers fed 1α-OH-D3 had higher BWG and FI as well as tibia breaking strength, weight, length, diameter, and ash weight than birds fed 25-OH-D3 at 42 d of age. The Ca to NPP ratio had a quadratic effect on BWG, FI, mortality, as well as tibia breaking strength, weight, length, ash weight, and ash and P contents in 42-d-old broilers. Broiler chickens at 42 d of age obtain optimal growth performance and bone mineralization at the Ca to NPP ratio of 2.32 when 1α-OH-D3 or 25-OH-D3 are used as the vitamin D source.
Key Words: broiler chicken, 1α-hydroxycholecalciferol, 25-hydroxycholecalciferol
ISSN 1806-9290
www.sbz.org.br R. Bras. Zootec., 45(1):1-7, 2016
Received March 30, 2015 and accepted October 10, 2015. Corresponding author: [email protected] or [email protected] http://dx.doi.org/10.1590/S1806-92902016000100001
Copyright © 2016 Sociedade Brasileira de Zootecnia. This is an Open Access article distributed under the terms of the Creative Commons Attribution License (http://creativecommons.org/licenses/by/4.0/), which permits unrestricted use, distribution, and reproduction in any medium, provided the original work is properly cited.
Introduction
The imbalance between dietary calcium (Ca) and
phosphorus (P) damages growth performance and bone
development in poultry (Li et al., 2012). Usually, the Ca to P
ratio is used to evaluate the balance between dietary Ca and
P. The Ca to non-phytate phosphorus (NPP) system has been
used for evaluating the requirement of Ca and P of poultry
(NRC, 1994). The NRC (1994) recommended the Ca and
NPP requirements of 10.0 and 4.5 g kg
–1(Ca/NPP = 2.22) in
1- to 21-d-old birds, and 9.0 and 3.5 g kg
–1(Ca/NPP = 2.57)
in 22- to 42-d-old broilers. Further research showed that
the highest performance and tibia mineralization of broilers
were observed at a Ca to NPP ratio of 2.0 (Bar et al., 2003;
Rao et al., 2007). These data suggest that the Ca to NPP ratio
ranges from 2.0 to 2.6 in broiler diets. However, another
study reported that optimal Ca to NPP ratios were 1.1, 1.4,
and 1.6 for body weight gain (BWG), feed efficiency (FE),
and tibia ash percentage in broilers from 1 to 16 d of age
(Driver et al., 2005). These data revealed the uncertainty in
the Ca to NPP ratio of broiler diets.
Cholecalciferol (vitamin D
3) was used as a
vitamin D source in the abovementioned research
(Bar et al., 2003; Driver et al., 2005; Rao et al.,
2007). 1α-hydroxycholecalciferol (1α-OH-D
3) and
25-hydroxycholecalciferol (25-OH-D
3) are derivatives of
vitamin D. Their bioavailability is higher than that of
vitamin D
3. 25-OH-D
3is nearly twice as active as vitamin
D
3(Soares et al., 1995) and 1α-OH-D
3is 5 to 8 times as
effective as vitamin D
3in broilers (Edwards et al., 2002;
Han et al., 2013). 25-OH-D
3has been approved for use in
feed for broiler chickens, laying hens, and turkeys in Europe,
USA, and China. In contrast, 1α-OH-D
3is not widely used
as a feed additive. The effect of Ca to NPP ratio on growth of
broiler chickens has not been examined when 1α-OH-D
3or
25-OH-D
3was used as a vitamin D source.
Therefore, the objective of the present study was to
assess the influence of dietary Ca to NPP ratio and different
sources of vitamin D (1α-OH-D
3or 25-OH-D
3) on growth
Material and Methods
All procedures used in the present study were approved
by the Animal Care Committee of Shangqiu Normal
University.
On the day of hatch, 700 female Ross 308 broilers were
weighed and randomly assigned to 14 treatments with five
stainless steel starter cages (70 × 70 × 30 cm) of 10 birds
each. On d 13, the broilers were transferred to stainless
steel finisher cages (190 × 50 × 35 cm). The experiment
lasted until the birds reached 42 d of age. A 7 × 2 factorial
experiment was designed to test the Ca to NPP ratios of
1.14, 1.43, 1.71, 2.00, 2.29, 2.57, and 2.86 in combination
with two sources of vitamin D (1α-OH-D
3and 25-OH-D
3).
Dietary Ca levels were 4.0, 5.0, 6.0, 7.0, 8.0, 9.0, and
10.0 g kg
–1, and the NPP content was 3.5 g kg
–1(Table 1).
The dose of 1α-OH-D
3or 25-OH-D
3was 5 µg kg
–1. Diets
were not supplemented with vitamin D
3. Birds were given
access to mash feed and water
ad libitum
. The lighting
program consisted of 23 h of light from d 1 to 3, 20 h of
light from d 4 to 21, and 18 h of light from d 22 to 42.
Room temperature was controlled at 33 °C from d 0 to 3,
and then gradually decreased by 3 °C per week to a final
temperature of 21 °C on d 42.
The crystalline 1α-OH-D
3and 25-OH-D
3were supplied
by Taizhou Healtech Chemical Co., Ltd. (Taizhou, China)
and Changzhou Book Chemical Co., Ltd. (Changzhou,
China), respectively. The crystalline 1α-OH-D
3and 25-OH-D
3were weighed and dissolved in ethanol. Then, they were
diluted to a final concentration of 10 mg L
–1of 1α-OH-D
3
or
25-OH-D
3in a solution of 5% ethanol and 95% propylene
glycol (Han et al., 2013). After preparation, the 1α-OH-D
3or 25-OH-D
3solution was supplemented to the diets.
Birds were weighed on d 21 and d 42. Ten chickens
per treatment were selected randomly for the collection
of blood and tibiae. Plasma samples (5 mL) were collected
through cardiac puncture on d 21 and through the wing
vein on d 42. These samples were centrifuged for 10 min at
3,000
g
at 20 °C. Birds were killed after collecting the blood
samples. Carcass and breast (with bones) were weighed.
Carcass and breast yield was calculated as percentage of
the live body weight of the birds. The left and right tibiae
of individual birds were excised and frozen at –20 °C for
further analysis (breaking strength, weight, length, diameter,
ash weight, and percentage contents of ash, Ca, and P).
Plasma Ca and inorganic phosphorus were determined
using a Shimadzu CL-8000 analyzer (Shimadzu
Corp., Kyoto, Japan), following the instructions of the
manufacturer.
Following the method of Hall et al. (2003), the left
tibiae were boiled for 5 min to loosen muscle tissues.
Meat, connective tissue, and fibula bone were completely
removed using scissors and forceps. Tibiae were placed in
a container of ethanol for 48 h (removing water and polar
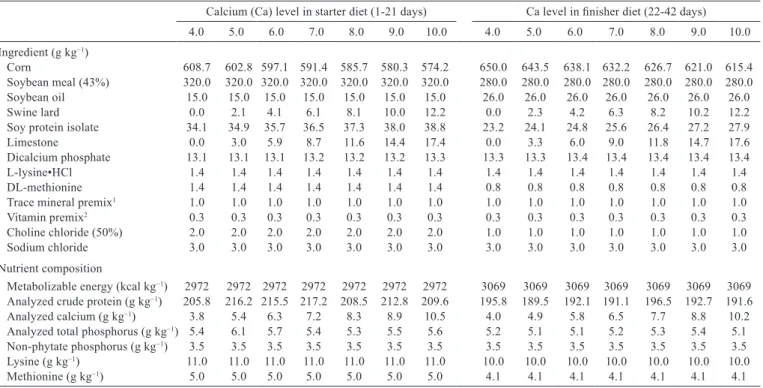
Table 1 - Composition of the experimental diets
Calcium (Ca) level in starter diet (1-21 days) Ca level in finisher diet (22-42 days)
4.0 5.0 6.0 7.0 8.0 9.0 10.0 4.0 5.0 6.0 7.0 8.0 9.0 10.0
Ingredient (g kg−1)
Corn 608.7 602.8 597.1 591.4 585.7 580.3 574.2 650.0 643.5 638.1 632.2 626.7 621.0 615.4 Soybean meal (43%) 320.0 320.0 320.0 320.0 320.0 320.0 320.0 280.0 280.0 280.0 280.0 280.0 280.0 280.0
Soybean oil 15.0 15.0 15.0 15.0 15.0 15.0 15.0 26.0 26.0 26.0 26.0 26.0 26.0 26.0
Swine lard 0.0 2.1 4.1 6.1 8.1 10.0 12.2 0.0 2.3 4.2 6.3 8.2 10.2 12.2
Soy protein isolate 34.1 34.9 35.7 36.5 37.3 38.0 38.8 23.2 24.1 24.8 25.6 26.4 27.2 27.9
Limestone 0.0 3.0 5.9 8.7 11.6 14.4 17.4 0.0 3.3 6.0 9.0 11.8 14.7 17.6
Dicalcium phosphate 13.1 13.1 13.1 13.2 13.2 13.2 13.3 13.3 13.3 13.4 13.4 13.4 13.4 13.4
L-lysine•HCl 1.4 1.4 1.4 1.4 1.4 1.4 1.4 1.4 1.4 1.4 1.4 1.4 1.4 1.4
DL-methionine 1.4 1.4 1.4 1.4 1.4 1.4 1.4 0.8 0.8 0.8 0.8 0.8 0.8 0.8
Trace mineral premix1 1.0 1.0 1.0 1.0 1.0 1.0 1.0 1.0 1.0 1.0 1.0 1.0 1.0 1.0
Vitamin premix2 0.3 0.3 0.3 0.3 0.3 0.3 0.3 0.3 0.3 0.3 0.3 0.3 0.3 0.3
Choline chloride (50%) 2.0 2.0 2.0 2.0 2.0 2.0 2.0 1.0 1.0 1.0 1.0 1.0 1.0 1.0
Sodium chloride 3.0 3.0 3.0 3.0 3.0 3.0 3.0 3.0 3.0 3.0 3.0 3.0 3.0 3.0
Nutrient composition
Metabolizable energy (kcal kg−1) 2972 2972 2972 2972 2972 2972 2972 3069 3069 3069 3069 3069 3069 3069 Analyzed crude protein (g kg−1) 205.8 216.2 215.5 217.2 208.5 212.8 209.6 195.8 189.5 192.1 191.1 196.5 192.7 191.6
Analyzed calcium (g kg−1) 3.8 5.4 6.3 7.2 8.3 8.9 10.5 4.0 4.9 5.8 6.5 7.7 8.8 10.2
lipids) after cleaning. Afterward, the bones were extracted
in anhydrous ether for 48 h (removing non-polar lipids).
Tibiae were dried at 105 °C for 24 h before weighing.
Tibia diameter was determined at the medial point. Tibia
ash content was determined by ashing the bone in a muffle
furnace for 48 h at 600 °C.
The right tibia was used to analyze the breaking
strength, which was determined using an all-digital
electronic universal testing machine (Shenzhen Hengen
Instrument Co. Ltd., Shenzhen, China). Tibiae were cradled
on two support points measuring 4 cm apart. A force was
applied to the midpoint of the same face of each tibia using
a 50 kg load cell with a crosshead speed of 10 mm min
–1(Jendral et al., 2008).
The Ca and total P content in diets and tibiae were
determined by the method of Han et al. (2013). The crude
protein content in diets was determined using a PN-1430
Kjeldahl apparatus (Barcelona, Spain).
Replicate means are the experimental units in statistical
analysis. All data were analyzed with the two-way ANOVA
procedure of SAS software (Statistical Analysis System,
version 9.0). Means were compared by Tukey’s test when
probability values were significant (P
<
0.05). Polynomial
contrasts were used to test the linear and quadratic effects
of dietary Ca to NPP ratio on growth performance and
bone mineralization. Nonlinear regression analysis was
conducted using the PROC NLIN procedure of the SAS
software to estimate the optimal Ca to NPP ratio based on
growth performance and tibia mineralization. The model
was
y
=
ax
2+
bx
+
c
, in which
y
is the response and
x
is
the Ca to NPP ratio.
Results
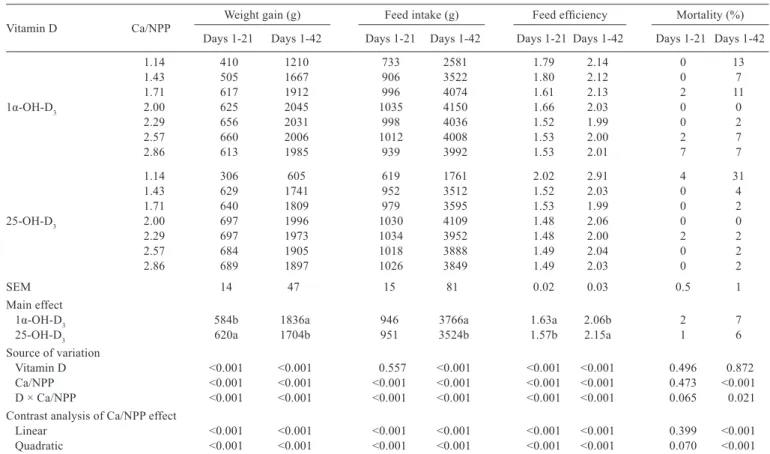
The Ca to NPP ratio, vitamin D source, and their
interaction affected body weight gain (BWG), feed intake
(FI), and feed efficiency (FE) of broiler chickens from 1 to
42 d of age (P
<
0.05, Table 2). Broilers fed 1α-OH-D
3had
higher BWG and FI and lower FE than birds fed 25-OH-D
3at 42 d of age (P
<
0.05). No differences in mortality were
observed between broilers fed 1α-OH-D
3and 25-OH-D
3(P
>
0.05). The Ca to NPP ratio influenced BWG, FI, FE, and
mortality quadratically in 42-d-old broilers (P
<
0.05). Birds
obtained the greatest BWG and FI at 42 d of age when the
dietary Ca to NPP ratio ranged from 2.00 to 2.29.
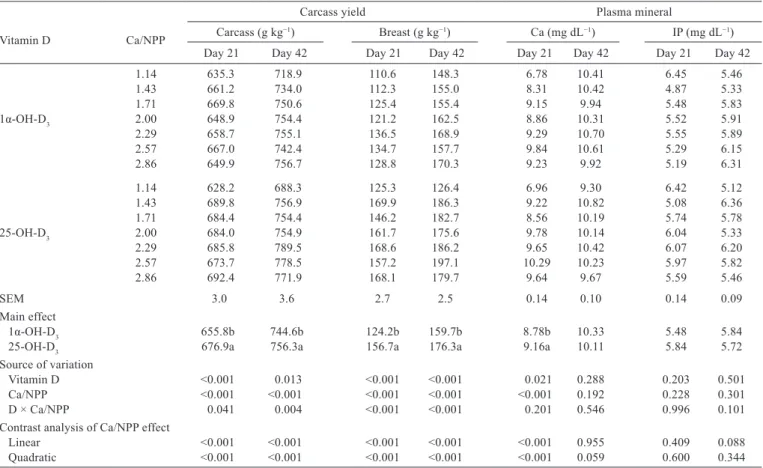
The Ca to NPP ratio, vitamin D source, and their
interaction affected the carcass and breast yield (P
<
0.05,
Table 3). Broilers fed 1α-OH-D
3had lower carcass and
breast yield than birds fed 25-OH-D
3(P
<
0.05). The Ca to
NPP ratio affected the meat yield quadratically (P
<
0.05).
Vitamin D Ca/NPP Weight gain (g) Feed intake (g) Feed efficiency Mortality (%)
Days 1-21 Days 1-42 Days 1-21 Days 1-42 Days 1-21 Days 1-42 Days 1-21 Days 1-42
1.14 410 1210 733 2581 1.79 2.14 0 13
1.43 505 1667 906 3522 1.80 2.12 0 7
1.71 617 1912 996 4074 1.61 2.13 2 11
1α-OH-D3 2.00 625 2045 1035 4150 1.66 2.03 0 0
2.29 656 2031 998 4036 1.52 1.99 0 2
2.57 660 2006 1012 4008 1.53 2.00 2 7
2.86 613 1985 939 3992 1.53 2.01 7 7
1.14 306 605 619 1761 2.02 2.91 4 31
1.43 629 1741 952 3512 1.52 2.03 0 4
1.71 640 1809 979 3595 1.53 1.99 0 2
25-OH-D3 2.00 697 1996 1030 4109 1.48 2.06 0 0
2.29 697 1973 1034 3952 1.48 2.00 2 2
2.57 684 1905 1018 3888 1.49 2.04 0 2
2.86 689 1897 1026 3849 1.49 2.03 0 2
SEM 14 47 15 81 0.02 0.03 0.5 1
Main effect
1α-OH-D3 584b 1836a 946 3766a 1.63a 2.06b 2 7
25-OH-D3 620a 1704b 951 3524b 1.57b 2.15a 1 6
Source of variation
Vitamin D <0.001 <0.001 0.557 <0.001 <0.001 <0.001 0.496 0.872
Ca/NPP <0.001 <0.001 <0.001 <0.001 <0.001 <0.001 0.473 <0.001
D × Ca/NPP <0.001 <0.001 <0.001 <0.001 <0.001 <0.001 0.065 0.021
Contrast analysis of Ca/NPP effect
Linear <0.001 <0.001 <0.001 <0.001 <0.001 <0.001 0.399 <0.001
Quadratic <0.001 <0.001 <0.001 <0.001 <0.001 <0.001 0.070 <0.001
Table 2 - Effects of Ca to NPP ratio and different sources of vitamin D on growth performance of broiler chickens
were observed on tibia weight, length, ash weight, and ash
percentage (P
<
0.05). The lowest Ca to NPP ratio resulted
in the lowest values of the above parameters.
Quadratic relationships between the Ca to NPP ratio and
growth performance or tibia mineralization were observed.
Non-linear regression analysis showed that the highest
values of BWG, FI, tibia weight, length, ash weight, and
ash percentage were observed at the Ca to NPP ratios of
2.33, 2.28, 2.45, 2.21, 2.46, and 2.44 in broiler chickens fed
1α-OH-D
3as the vitamin D source, respectively (Table 6).
The above values of Ca to NPP ratio were 2.27, 2.29, 2.25,
2.29, 2.26, and 2.31 in birds fed 25-OH-D
3, respectively.
In general, the Ca to NPP ratio ranged from 2.21 to 2.46
and the average Ca to NPP ratio was 2.32 in 1- to 42-d-old
broilers fed 1α-OH-D
3or 25-OH-D
3as the vitamin D source.
Discussion
Our unpublished data indicated that the relative
bioavailability of 1α-OH-D
3was higher than that of
25-OH-D
3in broiler chicken diets. Thus, 42-d-old broilers
fed 1α-OH-D
3had higher BWG and FI than birds fed
25-OH-D
3in the present study.
The lowest Ca to NPP ratio resulted in the lowest yield of
carcass and breast.
The Ca to NPP ratio and vitamin D source affected
plasma Ca concentration in 21-d-old birds (P
<
0.05). Plasma
Ca in birds fed 1α-OH-D
3was lower than that of birds fed
25-OH-D
3(P
<
0.05). The Ca to NPP ratio influenced plasma
Ca quadratically (P
<
0.05). The greatest plasma Ca was at
the Ca to NPP ratio of 2.57. No interactions in plasma Ca
or inorganic phosphorus concentration in 21- or 42-d-old
broilers were observed between the Ca to NPP ratio and
vitamin D source (P
>
0.05).
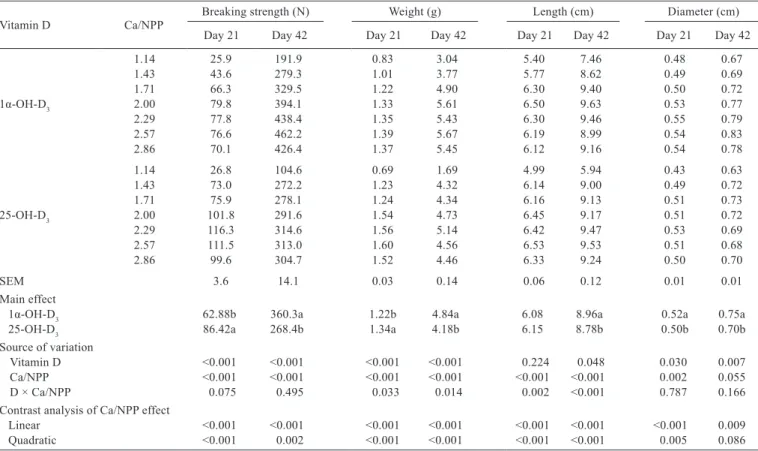
Vitamin D source affected tibia breaking strength,
weight, length, diameter, and ash weight in broilers
at 21 and 42 d of age (P
<
0.05, Tables 4 and 5). Birds
fed 1α-OH-D
3had greater tibia breaking strength, weight,
length, diameter, and ash weight than those fed 25-OH-D
3at 42 d of age (P
<
0.05). The percentages of tibia ash, Ca,
and P in 42-d-old broilers were not affected by the vitamin D
source (P
>
0.05).
The Ca to NPP ratio influenced tibia breaking strength,
weight, length, ash weight, and ash and P contents
quadratically in 42-d-old broilers (P
<
0.05). Interaction
effects between vitamin D source and the Ca to NPP ratio
Vitamin D Ca/NPP
Carcass yield Plasma mineral
Carcass (g kg−1) Breast (g kg−1) Ca (mg dL−1) IP (mg dL−1)
Day 21 Day 42 Day 21 Day 42 Day 21 Day 42 Day 21 Day 42
1.14 635.3 718.9 110.6 148.3 6.78 10.41 6.45 5.46
1.43 661.2 734.0 112.3 155.0 8.31 10.42 4.87 5.33
1.71 669.8 750.6 125.4 155.4 9.15 9.94 5.48 5.83
1α-OH-D3 2.00 648.9 754.4 121.2 162.5 8.86 10.31 5.52 5.91
2.29 658.7 755.1 136.5 168.9 9.29 10.70 5.55 5.89
2.57 667.0 742.4 134.7 157.7 9.84 10.61 5.29 6.15
2.86 649.9 756.7 128.8 170.3 9.23 9.92 5.19 6.31
1.14 628.2 688.3 125.3 126.4 6.96 9.30 6.42 5.12
1.43 689.8 756.9 169.9 186.3 9.22 10.82 5.08 6.36
1.71 684.4 754.4 146.2 182.7 8.56 10.19 5.74 5.78
25-OH-D3 2.00 684.0 754.9 161.7 175.6 9.78 10.14 6.04 5.33
2.29 685.8 789.5 168.6 186.2 9.65 10.42 6.07 6.20
2.57 673.7 778.5 157.2 197.1 10.29 10.23 5.97 5.82
2.86 692.4 771.9 168.1 179.7 9.64 9.67 5.59 5.46
SEM 3.0 3.6 2.7 2.5 0.14 0.10 0.14 0.09
Main effect
1α-OH-D3 655.8b 744.6b 124.2b 159.7b 8.78b 10.33 5.48 5.84
25-OH-D3 676.9a 756.3a 156.7a 176.3a 9.16a 10.11 5.84 5.72
Source of variation
Vitamin D <0.001 0.013 <0.001 <0.001 0.021 0.288 0.203 0.501
Ca/NPP <0.001 <0.001 <0.001 <0.001 <0.001 0.192 0.228 0.301
D × Ca/NPP 0.041 0.004 <0.001 <0.001 0.201 0.546 0.996 0.101
Contrast analysis of Ca/NPP effect
Linear <0.001 <0.001 <0.001 <0.001 <0.001 0.955 0.409 0.088
Vitamin D Ca/NPP Breaking strength (N) Weight (g) Length (cm) Diameter (cm)
Day 21 Day 42 Day 21 Day 42 Day 21 Day 42 Day 21 Day 42
1.14 25.9 191.9 0.83 3.04 5.40 7.46 0.48 0.67
1.43 43.6 279.3 1.01 3.77 5.77 8.62 0.49 0.69
1.71 66.3 329.5 1.22 4.90 6.30 9.40 0.50 0.72
1α-OH-D3 2.00 79.8 394.1 1.33 5.61 6.50 9.63 0.53 0.77
2.29 77.8 438.4 1.35 5.43 6.30 9.46 0.55 0.79
2.57 76.6 462.2 1.39 5.67 6.19 8.99 0.54 0.83
2.86 70.1 426.4 1.37 5.45 6.12 9.16 0.54 0.78
1.14 26.8 104.6 0.69 1.69 4.99 5.94 0.43 0.63
1.43 73.0 272.2 1.23 4.32 6.14 9.00 0.49 0.72
1.71 75.9 278.1 1.24 4.34 6.16 9.13 0.51 0.73
25-OH-D3 2.00 101.8 291.6 1.54 4.73 6.45 9.17 0.51 0.72
2.29 116.3 314.6 1.56 5.14 6.42 9.47 0.53 0.69
2.57 111.5 313.0 1.60 4.56 6.53 9.53 0.51 0.68
2.86 99.6 304.7 1.52 4.46 6.33 9.24 0.50 0.70
SEM 3.6 14.1 0.03 0.14 0.06 0.12 0.01 0.01
Main effect
1α-OH-D3 62.88b 360.3a 1.22b 4.84a 6.08 8.96a 0.52a 0.75a
25-OH-D3 86.42a 268.4b 1.34a 4.18b 6.15 8.78b 0.50b 0.70b
Source of variation
Vitamin D <0.001 <0.001 <0.001 <0.001 0.224 0.048 0.030 0.007
Ca/NPP <0.001 <0.001 <0.001 <0.001 <0.001 <0.001 0.002 0.055
D × Ca/NPP 0.075 0.495 0.033 0.014 0.002 <0.001 0.787 0.166
Contrast analysis of Ca/NPP effect
Linear <0.001 <0.001 <0.001 <0.001 <0.001 <0.001 <0.001 0.009
Quadratic <0.001 0.002 <0.001 <0.001 <0.001 <0.001 0.005 0.086
Table 4 - Effects of Ca to NPP ratio and different sources of vitamin D on tibia growth of broiler chickens
a-b - means in the same column without a common letter differ significantly (P<0.05). NPP - non-phytate phosphorus; SEM - standard error of the mean.
Vitamin D Ca/NPP Ash (g) Ash (g 100 g
−1) Ca (g 100 g−1) P (g 100 g−1)
Day 21 Day 42 Day 21 Day 42 Day 21 Day 42 Day 21 Day 42
1.14 0.28 1.30 34.47 42.81 10.04 15.76 6.59 8.05
1.43 0.40 1.67 39.36 44.24 13.80 16.70 7.54 8.45
1.71 0.56 2.18 45.57 44.72 16.45 16.78 8.44 8.45
1α-OH-D3 2.00 0.61 2.56 45.62 45.68 16.80 17.17 8.68 8.65
2.29 0.62 2.62 45.78 48.30 16.35 17.33 8.69 8.93
2.57 0.63 2.75 45.45 48.65 17.81 17.90 8.73 8.27
2.86 0.57 2.48 41.47 45.52 16.53 17.11 8.09 8.15
1.14 0.24 0.67 34.96 40.02 12.83 15.16 7.09 7.53
1.43 0.56 1.93 45.68 44.94 17.07 16.10 9.05 8.68
1.71 0.57 2.03 45.92 46.49 17.00 16.96 8.65 8.84
25-OH-D3 2.00 0.78 2.19 50.43 46.16 18.77 17.06 9.56 8.89
2.29 0.83 2.35 52.73 45.71 19.92 16.81 9.93 8.36
2.57 0.83 2.12 51.52 46.48 19.13 17.42 9.63 8.67
2.86 0.78 2.07 51.03 46.35 19.45 17.29 9.70 8.53
SEM 0.02 0.07 0.69 0.32 0.33 0.11 0.13 0.07
Main effect
1α-OH-D3 0.52b 2.22a 42.53b 45.70 15.40b 16.96 8.11b 8.42
25-OH-D3 0.65a 1.91b 47.47a 45.17 17.74a 16.69 9.09a 8.50
Source of variation
Vitamin D <0.001 <0.001 <0.001 0.243 <0.001 0.120 <0.001 0.517
Ca/NPP <0.001 <0.001 <0.001 <0.001 <0.001 <0.001 <0.001 0.001
D × Ca/NPP <0.001 0.008 <0.001 0.031 <0.001 0.741 0.009 0.101
Contrast analysis of Ca/NPP effect
Linear <0.001 <0.001 <0.001 <0.001 <0.001 <0.001 <0.001 0.127
Quadratic <0.001 <0.001 <0.001 <0.001 <0.001 0.004 <0.001 <0.001
Table 5 - Effects of Ca to NPP ratio and different sources of vitamin D on tibia mineralization of broiler chickens
The Ca to NPP ratio influenced BWG, FI, FE, and
mortality quadratically in 42-d-old broilers. The lowest
Ca to NPP ratio of 1.14 damaged growth performance of
broilers. Birds obtained the greatest BWG and FI at 42 d of
age when the Ca to NPP ratio ranged from 2.27 to 2.33 in
diets with 1α-OH-D
3or 25-OH-D
3as vitamin D. Previous
research showed that the high Ca to NPP ratio of 4.0
depressed the BWG and FI of broilers
(Li et al., 2012) and
the optimal Ca to NPP ratio was 2.0 in broiler diets with
vitamin D
3as the vitamin D source (Bar et al., 2003; Rao
et al., 2007).
A high dietary Ca to NPP ratio negatively affected P
utilization because of the formation of Ca-P complexes
in the gastrointestinal tract, which is not available for the
birds. Growth improvement by lowering the Ca to NPP ratio
results from the increase in phytase activity, P digestibility,
and P retention in broiler chickens (Qian et al., 1997),
turkeys (Qian et al., 1996), and pigs (Liu et al., 1998; Stein
et al., 2011). Lowering the dietary Ca to NPP ratio also
increases the absorbed and retained P (Al-Masri, 1995).
Decreasing the available phosphorus of 21- to 42-d-old
broilers from 4.0 to 2.5 g kg
–1decreased the BWG and
carcass yield (Chen and Moran, 1995). Birds fed 4.0 g kg
–1Ca (Ca/NPP = 1.14) had the lowest carcass and breast yields
in the present study. These data indicated that deficiency of
Ca or P decreased the muscle growth and meat production
of broiler chickens.
We have found that 1α-OH-D
3is about two times as
tibia breaking strength, weight, length, diameter, and ash
weight than those fed 25-OH-D
3at 42 d of age.
Interaction effects between vitamin D source and the
Ca to NPP ratio were observed on tibia weight, length, ash
weight, and ash percentage. The Ca to NPP ratio influenced
tibia mineralization quadratically. The highest values of
tibia weight, length, ash weight, and ash percentage were
observed when the dietary Ca to NPP ratio ranged from
2.21 to 2.46 in 42-d-old broilers.
The dietary Ca to P ratio regulates bone mineralization
and turnover by affecting the intestinal Ca and P transports
in mice (Masuyama et al., 2003). The imbalance between
Ca and P also impaired bone mineralization of pigs
(Létourneau-Montminy et al., 2010). Similar results were
observed in poultry studies.
Dietary Ca or P restriction
increased duodenal calbindin and decreased bone ash
weight in both 22- and 43-d-old broiler chickens, but
the effect on bone ash was less noticeable in the
43-d-old birds than in the younger birds (Bar et al., 2003).
A Ca- and P-deficient diet resulted in low tibia minerals
and breaking strength of broilers; all tibia parameters were
further decreased when the Ca to P ratio was relatively
higher (Li et al., 2012). In the present study, deficiency of
Ca resulted in poor tibia mineralization, in particular, low
levels of breaking strength, length, weight, ash weight, and
ash and Ca contents.
The optimal Ca to NPP ratio in broiler chickens fed
vitamin D
3has been studied by several researchers. Growth
Vitamin D Criterion Formula P-value R2 Ca/NPP
Growth performance
Weight gain y = −585.3x2 + 2730.5x − 1091.1 <0.001 0.91 2.33 Feed intake y = −1170.1x2 + 5324.3x − 1818.1 <0.001 0.84 2.28
1α-OH-D3 Tibia mineralization
Weight y = −1.5927x2 + 7.8089x − 3.8857 <0.001 0.77 2.45 Length y = −1.7380x2 + 7.6864x + 1.1094 <0.001 0.72 2.21 Ash weight y = −0.8296x2 + 4.0830x − 2.3512 <0.001 0.84 2.46 Ash content y = −2.9344x2 + 14.2999x + 29.8018 <0.001 0.43 2.44
Growth performance
Weight gain y = −991.6x2 + 4511.6x − 3027.3 <0.001 0.82 2.27
Feed intake y = −1603.6x2 + 7334.3x − 4204.2 <0.001 0.83 2.29
25-OH-D3 Tibia mineralization
Weight y = −2.4203x2 + 10.8815x − 7.1101 <0.001 0.67 2.25
Length y = −2.4182x2 + 11.0860x − 2.9227 <0.001 0.76 2.29
Ash weight y = −1.1872x2 + 5.3578x − 3.6679 <0.001 0.69 2.26
Ash content y = −4.2775x2 + 19.7638x + 24.1524 <0.001 0.50 2.31
Mean 2.32 Table 6 - Regression analysis of the relationship between Ca to NPP ratio (x) and performance or tibia mineralization (y) in 1- to 42-d-old
broiler chickens
(Qian et al., 1997). Phosphorus requirements for growth
and bone ash are similar and are as high in older chickens
as in younger ones, and the Ca requirement for growth and
bone ash is 10.0 g kg
–1in broilers (Bar et al., 2003). Further
research showed that the highest performance and tibia
quality were observed when the dietary Ca to NPP ratio
was 2.0 (Rao et al., 2007). These data indicated that the Ca
to NPP ratio in 22- to 42-d-old broilers was lower than that
(Ca/NPP = 2.57) recommended by the NRC (1994).
Previous research has shown that addition of 25-OH-D
3helps to relieve leg problems when broiler chickens were fed
diets with suboptimal Ca to NPP ratios (Coto et al., 2008).
1α-OH-D
3exerts the highest activities at lower concentrations
of dietary Ca (Han et al., 2012). In the present study, 42-d-old
broilers fed 1α-OH-D
3or 25-OH-D
3as the vitamin D source
obtained the highest BWG and FI when the Ca to NPP ratio
was from 2.27 to 2.33. In contrast, the Ca to NPP ratio of 2.21
to 2.46 was associated with optimal bone mineralization.
The average Ca to NPP ratio is about 2.32 for growth and
bone quality in broiler chickens from 1 to 42 d of age.
Conclusions
Broiler chickens at 42 days of age obtain optimal growth
performance and bone mineralization at the dietary calcium
to non-phytate phosphorus ratio of 2.32 when 1α-OH-D
3or
25-OH-D
3are used as the vitamin D source.
Acknowledgments
This study was supported by the National Natural
Science Foundation of China (31101732) and the Innovation
Scientists and Technicians Troop Construction Projects of
Henan Province.
References
Al-Masri, M. R. 1995. Absorption and endogenous excretion of phosphorus in growing broiler chicks, as influenced by calcium and phosphorus ratios in feed. British Journal of Nutrition 74:407-415.
Bar, A.; Shinder, D.; Yosefi, S.; Vax, E. and Plavnik, I. 2003. Metabolism and requirements for calcium and phosphorus in the fast-growing chicken as affected by age. British Journal of Nutrition 89:51-61.
Chen, X. and Moran, E. T. Jr. 1995. The withdrawal feed of broilers-Carcass responses to dietary phosphorus. Journal of Applied Poultry Research 4:69-82.
Coto, C.; Yan, F.; Cerrate, S.; Wang, Z.; Sacakli, P.; Halley, J. T.; Wiernusz, C. J.; Martinez, A. and Waldroup, P. W. 2008. Effects of dietary levels of calcium and nonphytate phosphorus in broiler starter diets on live performance, bone development and growth plate conditions in male chicks fed a corn-based diet. International Journal of Poultry Science 7:638-645.
Driver, J. P.; Pesti, G. M.; Bakalli, R. I. and Edwards, H. M. Jr. 2005. Calcium requirements of the modern broiler chicken as influenced by dietary protein and age. Poultry Science 84:1629-1639. Edwards, H. M. Jr.; Shirley, R. B.; Escoe, W. B. and Pesti, G. M.
2002. Quantitative evaluation of 1α-hydroxycholecalciferol as a cholecalciferol substitute for broilers. Poultry Science 81:664-669. Hall, L. E.; Shirley, R. B.; Bakalli, R. I.; Aggrey, S. E.; Pesti, G.
M. and Edwards, H. M. Jr. 2003. Power of two methods for the estimation of bone ash of broilers. Poultry Science 82:414-418. Han, J. C.; Liu, Y.; Yao, J. H.; Wang, J. Q.; Qu, H. X.; Yan, Y. F.; Yue,
J.; Ding, J. L.; Shi, Z. T. and Dong, X. S. 2012. Dietary calcium levels reduce the efficacy of one alpha-hydroxycholecalciferol in phosphorus-deficient diets of broilers. Journal of Poultry Science 49:34-38.
Han, J. C.; Qu, H. X.; Wang, J. Q.; Yao, J. H.; Zhang, C. M.; Yang, G. L.; Cheng, Y. H. and Dong, X. S. 2013. The effects of dietary cholecalciferol and 1α-hydroxycholecalciferol levels in a calcium- and phosphorus-deficient diet on growth performance and tibia quality of growing broilers. Journal of Animal and Feed Sciences 22:158-164.
Jendral, M. J.; Korver, D. R.; Church, J. S. and Feddes, J. J. R. 2008. Bone mineral density and breaking strength of white leghorns housed in conventional, modified, and commercially available colony battery cages. Poultry Science 87:828-837.
Létourneau-Montminy, M. P.; Narcy, A.; Magnin, M.; Sauvant, D.; Bernier, J. F; Pomar, C. and Jondreville, C. 2010. Effect of reduced dietary calcium concentration and phytase supplementation on calcium and phosphorus utilization in weanling pigs with modified mineral status. Journal of Animal Science 88:1706-1717. Li, J.; Yuan, J.; Guo, Y.; Sun, Q. and Hu, X. 2012. Influence of
dietary calcium and phosphorus imbalance on intestinal NaPi-IIb and calbindin mRNA expression and tibia parameters of broilers. Asian-Australasian Journal of Animal Sciences 25:552-558. Liu, J.; Bollinger, D. W.; Ledoux, D. R. and Veum, T. L. 1998.
Lowering the dietary calcium to total phosphorus ratio increases phosphorus utilization in low-phosphorus corn-soybean meal diets supplemented with microbial phytase for growing-finishing pigs. Journal of Animal Science 76:808-813.
Masuyama, R.; Nakaya, Y.; Katsumata, S.; Kajita, Y.; Uehara, M.; Tanaka, S.; Sakai, A.; Kato, S.; Nakamura, T. and Suzuki, K. 2003. Dietary calcium and phosphorus ratio regulates bone mineralization and turnover in vitamin D receptor knockout mice by affecting intestinal calcium and phosphorus absorption. Journal of Bone and Mineral Research 18:1217-1226.
NRC - National Research Council. 1994. Nutrient requirements of poultry. 9th rev. ed. National Academy Press, Washington, DC, USA. Qian, H., Kornegay, E. T. and Denbow, D. M. 1996. Phosphorus
equivalence of microbial phytase in turkey diets as influenced by calcium to phosphorus ratios and phosphorus levels. Poultry Science 75:69-81.
Qian, H., Kornegay, E. T. and Denbow, D. M. 1997. Utilization of phytate phosphorus and calcium as influenced by microbial phytase, cholecalciferol, and the calcium: total phosphorus ratio in broiler diets. Poultry Science 76:37-46
Rao, S. V. R.; Raju, M. V. L. N. and Reddy, M. R. 2007. Performance of broiler chicks fed high levels of cholecalciferol in diets containing sub-optimal levels of calcium and non-phytate phosphorus. Animal Feed Science and Technology 134:77-88. Soares, J. H. Jr.; Kerr, J. M. and Gray, R. W. 1995.
25-hydroxycholecalciferol in poultry nutrition. Poultry Science 74:1919-1934.