http://dx.doi.org/10.1590/1516-635x1703371-380
on the Performance and Meat Quality of Broiler
Chickens
Author(s)
Ren LI,II
Zuo JI
Li GI
Zheng LI
Zhang ZI
Ye HI
Xia WI
Feng DI
I College of Animal Science and Technology,
South China Agriculture University, Guangzhou 510642,China
II College of Agriculture, Guangdong Ocean
University, Zhanjiang 524000, China
Project funded by Nature Science Foundation of China
Mail Address
Corresponding author e-mail address Prof. D. Y. Feng
College of Animal Science and Technology, South China Agricultural University, Room 1406, Building D, Xingfayuan, South Habin Road, Xiashan District, Zhanjiang city Guangzhou, 510642, China. Phone: (+86) 13531102669 E-mail: [email protected]
Keywords
Broiler, non-phytate phosphorus, performance, phytase, 25-hydroxycholecalciferol.
Submitted: December/2014 Approved: May/2015
ABSTRACT
This experiment was conducted to evaluate the combination effect of low dietary non-phytate phosphorus (NPP) concentrations, phytase (PHY) levels, and 25-hydroxycholecalciferol (25-OH-D3) levels on the growth performance and meat quality of broilers. Two levels of NPP, two levels of PHY, and two levels of 25-OH-D3 resulted in a 2×2×2 factorial arrangements, with eight treatments (TRT). The birds on TRT 1-4 were fed diet 1 (NRC NPP was reduced by 0.1) and the birds on TRT 5-8 were fed with diet 2 (NRC NPP was reduced by 0.2). Each diet was
mixed with different levels PHY and 25-OH-D3. Performance and meat
quality parameters were measured. Results showed that during entire experiment the most advantageous effects were obtained with TRT 3
(NRC NPP reduced by 0.1 + 600 U/kg phytase + 34.5µg/kg 25-OH-D3)
and TRT 4 (NRC NPP reduced by 0.1 + 600 U/kg phytase + 69µg/kg
25-OH-D3). The lowest body weight gain (BWG) and feed intake(FI) were
observed with TRT 5 (NRC NPP reduced by 0.2 + 300 U/kg phytase
+ 34.5µg/kg 25-OH-D3). Lowering NRC NPP by 0.1 to 0.2 significantly
reduced weight gain (WG) (p< 0.05) and FI (p< 0.05) during the starter
phase (ST), while during grower phase (GF) lowering NRC NPP by 0.1 to 0.2 did not affect WG (p>0.05) and produced small decrease in FI. BWG,
FI and feed conversion ratio were not influenced (p>0.05) by different
PHY or 25-OH-D3 levels. In addition, the meat color, pH, and shear force were not affected by the different NPP, PHY or 25-OH-D3 levels.
INTRODUCTION
Phosphorus (P) pollution from animal waste has become a major environmental concern in recent years. Reducing dietary phosphorus is an effective method to minimize phosphorus pollution (Angel et al.,
2006; Powell et al., 2008; Rama Rao et al., 2009; Pillai et al., 2009).
Recent studies showed that the National Research Council (NRC,1994) recommendations of non-phytate phosphorus (NPP) exceed the requirements of modern broiler chickens (Angel et al., 2000a,b; Yan et al., 2001 and Angel et al., 2005). It should be an important economic and environmental concern to formulate diets to precisely meet the phosphorus requirements of poultry (Summers,1997).
Another method to reduce phosphorus pollution is to use feed additives, such as microbial phytase (PHY), to increase the utilization of dietary phosphorus. Microbial phytases have been widely used in animal diets to increase phytate P (PP) availability and to reduce inorganic P supplementation (Lalpanmawia et al., 2014) and P excretion (Pillai et al., 2009;Naves et al., 2014). Furthermore, several studies indicated
that vitamin D3 metabolites, such as 1,25-dihydroxycholecalciferol
(1,25-(OH)2-D3), 25-hydroxycholecalciferol (25-OH-D3), and
utilization (Biehl et al., 1995; Janocha 2et al., 2009 and
Tatara et al., 2011). The 25-OH-D
3 has been successfully
developed into a new feed additives to the industry today. Previous reports (Angel et al., 2005; Driver et al., 2005; Coto et al., 2008; Liem et al., 2009) suggested
that cholecalciferol analog might work either alone or in combination with phytase to markedly improve utilization of dietary P. However, the combination effect of lower dietary NPP levels, PHY levels and 25-OH-D3 levels has not been evaluated.
Supplementation of vitamin D3 affects meat quality (Montgomery et al., 2004; Moron et al., 2008). Han et al. (2009) reported that 1α-OH-D
3 increase lightness
and yellowness of the breast and thigh meat whereas it decrease the shear force and water-holding capacity of the thigh meat.
Our objective was to evaluate the combination effect of lower dietary NPP levels, PHY levels and
25-OH-D3 levels on the growth performance and meat
quality of the broilers.
MATERIALS AND METHODS
Birds, Diets, Feeding, and Management
The procedures of this experiment were approved by the Animal Care and Use Committee of the South China Agriculture University.
The experiment was conducted in a broiler house for 42 d during the fall. Two thousand and four hundred one-day-old yellow-feathered male broilers were randomly assigned to eight treatments according to the randomized complete block design, with five replicates per treatment. Birds were weighed and allocated to treatment groups in order to obtain similar initial average body weights among the treatment groups. The pens were located in a well-ventilated open sided house with pine-shavings. Birds were submitted to 24 h of light and same management practices. Each pen (260×320cm) was considered a replicate. The
temperature inside the pen was maintained at 33ºC
on day 1 and reduced 3 ºC each week until 24 ºC was reached.
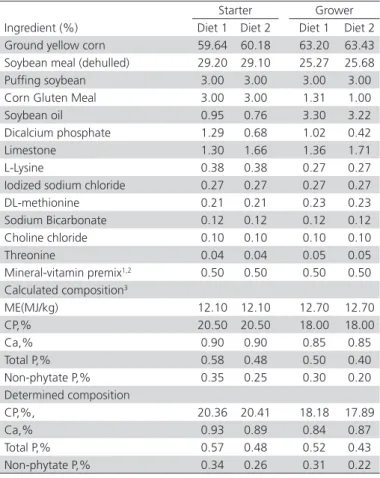
Birds were fed the experimental diets (in mash form) formulated to supply the NRC (1994) recommendations for all nutrients except for NPP. A two-phase feeding program was applied: starter diets from 1 to 21d and grower diets from 22 to 42d. The compositions of the starter and grower experimental diets are shown in Table 1. Basal diets, based on corn and soybean meal, were formulated and the treatment diets were obtained by supplementing the basal diets with monocalcium
phosphate, limestone, PHY (Natuphos, BASF), or
25-OH-D3 (DSM Nutritional Products). One unit (U) of
phytase activity is defined as the amount of enzyme that releases 1 mol of inorganic P from 1.5 mM Na phytate at pH 5.5 and 37 °C. The birds in treatments 1-4 were fed with phosphorus deficient diet 1 (NPP level below NRC by 0.1 in each period), while the birds in treatments 5-8 were fed with phosphorus deficient diet 2 (NPP level below NRC by 0.2 in each period). The starter diets was formulated to contain 0.35% or 0.25% NPP and the grower diets were formulated to contain 0.3% or 0.25% NPP. Each phosphorus-deficient diet contained no Vitamin D3 and was mixed with 300U/kg or 600U/kg phytase and 34.5µg /kg or 69µg /kg 25-OH-D3. Two levels of NPP concentrations (NRC NPP reduced by 0.1 or 0.2), two levels of PHY
(300U/kg or 600U/kg), and two levels of 25-OH-D3
(34.5µg /kg diet or 69µg /kg diet) resulted in a 2×2×2
Table 1 – Composition and nutritional levels of phosphorus-deficient basal diets
Starter Grower
Ingredient (%) Diet 1 Diet 2 Diet 1 Diet 2
Ground yellow corn 59.64 60.18 63.20 63.43
Soybean meal (dehulled) 29.20 29.10 25.27 25.68
Puffing soybean 3.00 3.00 3.00 3.00
Corn Gluten Meal 3.00 3.00 1.31 1.00
Soybean oil 0.95 0.76 3.30 3.22
Dicalcium phosphate 1.29 0.68 1.02 0.42
Limestone 1.30 1.66 1.36 1.71
L-Lysine 0.38 0.38 0.27 0.27
Iodized sodium chloride 0.27 0.27 0.27 0.27
DL-methionine 0.21 0.21 0.23 0.23
Sodium Bicarbonate 0.12 0.12 0.12 0.12
Choline chloride 0.10 0.10 0.10 0.10
Threonine 0.04 0.04 0.05 0.05
Mineral-vitamin premix1,2 0.50 0.50 0.50 0.50
Calculated composition3
ME(MJ/kg) 12.10 12.10 12.70 12.70
CP,% 20.50 20.50 18.00 18.00
Ca,% 0.90 0.90 0.85 0.85
Total P,% 0.58 0.48 0.50 0.40
Non-phytate P,% 0.35 0.25 0.30 0.20
Determined composition
CP,%, 20.36 20.41 18.18 17.89
Ca,% 0.93 0.89 0.84 0.87
Total P,% 0.57 0.48 0.52 0.43
Non-phytate P,% 0.34 0.26 0.31 0.22
1 Mineral-vitamin premix provided the following (per kilogram of diet):
thiamin-mononitrate, 2.4 mg; nicotinic acid, 44mg; riboflavin, 4.4 mg; D-Ca pantothenate,12 mg; vitamin B12 (cobalamin), 12.0µg; pyridoxine-HCl, 2.7 mg; D-biotin,0.11 mg;
folic acid,0.55 mg; vitamin A,10000IU; vitamin E,30IU; menadione sodium bisulfate complex, 3.34 mg; manganese, 120mg; iron,100 mg; zinc, 100 mg; copper, 8 mg; iodine,0.7 mg; selenium,0.3mg.
2Vitamin D
factorial design (NPP ×PHY × 25-OH-D3), with a total of 8 experimental treatments (TRT), with 5 replicates (pens) per treatment (60 birds /pen). Normal level and lower level of phytase and 25-OH-D3 was included in the diets in attempt to allow for any potential additive or synergistic effects. Samples of all feeds were assayed for crude protein, calcium, and total phosphorus. Prior to mixing the diets, corn-25-OH-D3 premixes consisting of corn and an appropriate level of 25-OH-D3-premix were prepared and used in the basal diets.
The broiler house had a curtain with an ultraviolet inhibition during the study to prevent birds from being exposure to ultraviolet radiation. Feed and water were provided ad libitum during the experiment.
Mortality and leg abnormality of the birds were checked daily. Leg abnormality, including the deformed legs, valgus/varus, and tibial dyschondroplasia, was assessed by observing the walking ability (walking gait and speed) of the birds when moving spontaneously in the rearing environment. On d 21 and 42, two birds per pen were killed by cervical dislocation and their tibiae were removed to determine the presence or absence of physical leg abnormalities. Feed and broilers were weighed on d 21 and 42 for the determination of body weight gain (BWG), feed intake (FI), and feed conversion ratio (FCR).
Meat Quality Measurement
At d 42, two birds per pen were killed by cervical dislocation and their right breast and thigh muscle were removed for pH, color, and shear force determination. According to the method of Lu et al. (2006), at 45min
postmortem, the pH of the breast and thigh muscles were tested with a pH meter (PHS-3C, Shanghai Precision and Scientific Instrument Co. Ltd., Shanghai, China). At 24 h postmortem, lightness (L*), redness (a*), and yellowness (b*) values of the muscles were measured using a WSC-S Chroma Meter (Shanghai Precision and Scientific Instrument Co. Ltd.). According to the procedure described by Honikel (1998), shear force of the breast and thigh raw meat was measured by using a C-LM3 Digital Meat Tenderness Meter (Northeast Agricultural University, Harbin, China).
Statistical Analysis
Replicate means served as the experimental unit for statistical analysis. Analysis of variance was performed on all data for the experiment using the GLM procedure of SAS (SAS Institute, 2001) appropriate for a randomized block design. Treatment means were compared using Duncan’s multiple range test (Duncan, 1955). P-values lower than 0.05 or 0.01 indicate statistical significance.
RESULTS
Body weight, survival rate, and leg abnor-mality rate
The survival rate of broilers in all treatments was high, of more than 99%, during the experimental periods, although NRC NPP was reduced by 0.2. No leg abnormality was observed during starter phase and grower phase of the experiment (Table 2). The 21 d BW of chicks on TRT 1-4 (fed with 0.35% NPP diet) was higher than that of chicks on TRT 5-8 (fed
Table 2 – Effect of the combination of NPP, phytase and 25-OH-D3 on BW, mortality rate and leg abnormality rate of broilers
1-21d 22-42d
TRT NPP1 Phytase2 25-OH-D
33 21d BW4 Survival
rate
Leg abnormality
rate
42d BW Survival rate
Leg abnormality
rate
(%) (U/kg) (μg/kg) (g/bird) (%) (%) (g/bird) (%) (%)
1 0.35 300 34.5 360.2±2.87b 99.33 0 979.6±12.6abc 100 0
2 0.35 300 69 358.6±4.67b 99.33 0 989.4±9.2abc 100 0
3 0.35 600 34.5 368.4±3.04a 99.00 0 1007.8±9.02a 100 0
4 0.35 600 69 371.8±2.63a 99.67 0 999.2±17.0ab 100 0
5 0.25 300 34.5 345.8±3.73c 99.67 0 952.2±14.2c 100 0
6 0.25 300 69 343.4±4.79c 99.33 0 959.2±15.3bc 99.64 0
7 0.25 600 34.5 338.4±2.06c 100 0 962.4±10.3bc 100 0
8 0.25 600 69 333.2±5.77c 99.33 0 968.0±11.5abc 100 0
a-c Means with no common superscripts in the same column significantly differ (p ≤ 0.05).
1. NPP =non-phytate P. From 1 to 21 d, NPP levels for broilers on treatment 1-4 and treatment 5-8 were 0.35% and 0.25%, respectively. From 22 to 42 d, NPP levels for broilers on treatment 1-4 and treatment 5-8 were 0.3% and 0.2% respectively.
2. Natuphos, BASF, 1 U of PHY is defined as the amount of enzyme required to liberate 1 mol of inorganic P from 1.5 mM Na phytate at pH 5.5 and 37°C 3. 25-OH-D3 =25-hydroxycholecalciferol, Hy-D, DSM Vitamins, Shanghai,Ltd, 69 μg/kg diet=2,760 IU/kg diet.
with 0.25% NPP diet). The broilers on TRT 4(fed with 0.35% NPP diet + 600U/kg phytase + 69µg/kg
25-OH-D3) grew better than those on any other TRT during
starter phase. The BW of chicks on TRT 4 was 11.2% higher (p< 0.05) than that of chicks on TRT 8 at d 21.
The broilers on TRT 3(fed with 0.30% NPP diet + 600
U/kg phytase + 34.5µg/kg 25-OH-D3) grew better (p<
0.05) than those on any other TRT at d 42. The BW of chicks on TRT 3 was 5.84% higher (p< 0.05) than that
of chicks on TRT 5 at d 42.
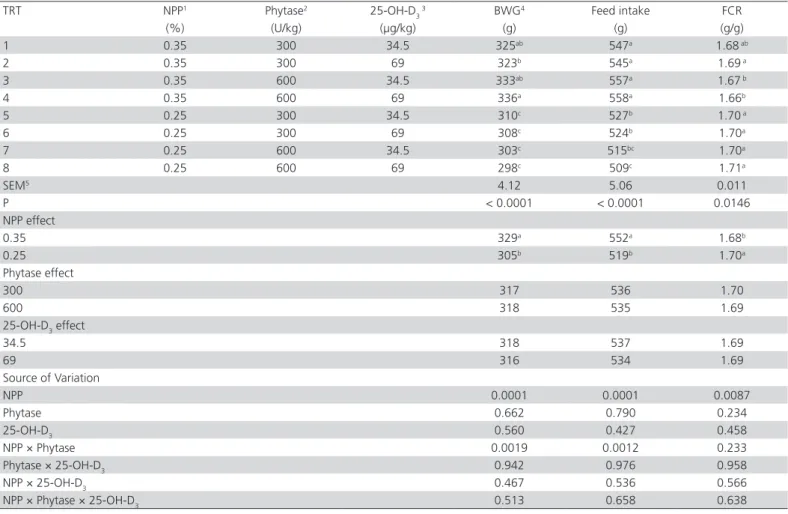
Starter Phase (Hatch to 21 d of Age) Per-formance
The greatest BWG was obtained by broilers on TRT 4 (fed with 0.35% NPP diet + 600U/kg phytase + 69µg/kg 25-OH-D3) in the starter phase (Table 3). FCR
of chicks on TRT 4(fed with 0.35% NPP diet + 600 U/
kg phytase + 69µg/kg 25-OH-D3) and TRT 3(fed with
0.35% NPP diet + 600 U/kg phytase + 34.5µg/kg 25-OH-D3) was significantly lower (p< 0.05) than that on
any other TRT. The BWG and feed intake of chicks on TRT 1-4 (fed with 0.35% NPP diet) was significantly higher (p< 0.05) by 7.87% and 6.36% than that of
chicks on TRT 5-8 (fed with 0.25% NPP diet). FCR of chicks on TRT 1-4 (fed with 0.35% NPP diet) was significantly lower (p< 0.05) than that of chicks on TRT
5-8 (fed with 0.25% NPP diet). The BWG, feed intake, and FCR were not influenced by different phytase or 25-OH-D3 levels.
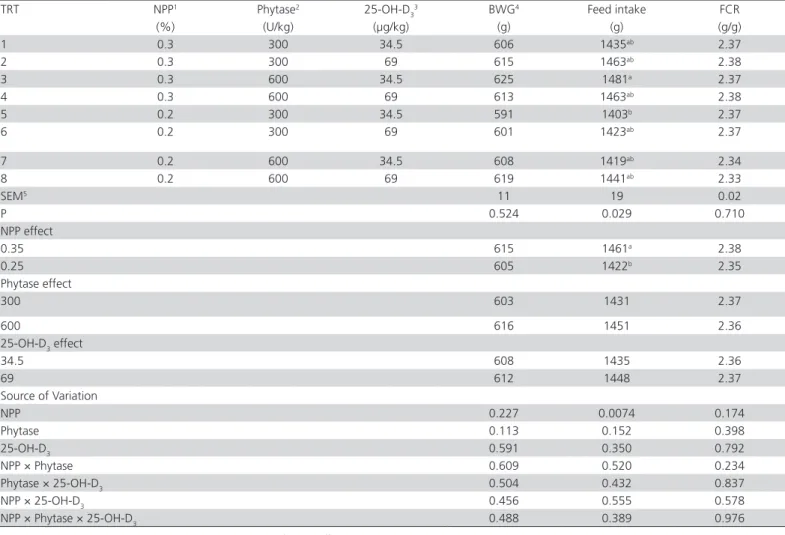
Grower Phase (22 to 42 d of age) Perfor-mance
In the grower phase, the BWG and FCR of chicks were not affected when NRC NPP was reduced by 0.1
Table 3 – Effect of the combination of NPP, phytase and 25-OH-D3 on the performance of starter broilers (1 to 21 days).
TRT NPP1 Phytase2 25-OH-D
3
3 BWG4 Feed intake FCR
(%) (U/kg) (μg/kg) (g) (g) (g/g)
1 0.35 300 34.5 325ab 547a 1.68 ab
2 0.35 300 69 323b 545a 1.69 a
3 0.35 600 34.5 333ab 557a 1.67 b
4 0.35 600 69 336a 558a 1.66b
5 0.25 300 34.5 310c 527b 1.70 a
6 0.25 300 69 308c 524b 1.70a
7 0.25 600 34.5 303c 515bc 1.70a
8 0.25 600 69 298c 509c 1.71a
SEM5 4.12 5.06 0.011
P < 0.0001 < 0.0001 0.0146
NPP effect
0.35 329a 552a 1.68b
0.25 305b 519b 1.70a
Phytase effect
300 317 536 1.70
600 318 535 1.69
25-OH-D3 effect
34.5 318 537 1.69
69 316 534 1.69
Source of Variation
NPP 0.0001 0.0001 0.0087
Phytase 0.662 0.790 0.234
25-OH-D3 0.560 0.427 0.458
NPP × Phytase 0.0019 0.0012 0.233
Phytase × 25-OH-D3 0.942 0.976 0.958
NPP × 25-OH-D3 0.467 0.536 0.566
NPP × Phytase × 25-OH-D3 0.513 0.658 0.638
a-c Means with no common superscripts in the same column significantly differ (p ≤ 0.05).
1. NPP = non-phytate P 2. Natuphos, BASF
3. 25-OH-D3 =25-hydroxycholecalciferol, Hy-D, DSM Vitamins, shanghai, Ltd, 69µg/kg diet=2,760 IU/kg diet.
to 0.2, but feed intake decreased by 2.67%(from 1461 g/bird/d to 1422 g/bird/d) when NRC NPP was lowered by 0.1 to 0.2 (Table 4). The BWG, feed intake, and FCR of chicks were not influenced by different phytase or 25-OH-D3 levels.
Cumulative (Hatch to 42 d of age) Perfor-mance
The broilers on TRT 3(NRC NPP reduced by 0.1 +
600U/kg phytase + 34.5µg/kg 25-OH-D3) and TRT 4
(NRC NPP reduced by 0.1 + 600 U/kg phytase + 69µg/ kg 25-OH-D3) grew better and ate more than those on any other TRT (Table 5). The BWG and feed intake of chicks on TRT 3 and TRT 4 were 973g and 2038g, and 964g and 2021g, respectively. The lowest BWG (917g)
and feed intake (1930g) were observed in TRT 5(NRC
NPP reduced by 0.2 + 300U/kg phytase + 34.5µg/kg
25-OH-D3). The BWG was 6.11% and 5.13% higher
(p< 0.05) in birds on TRT 3 and TRT 4, respectively,
compared with those on TRT 5.
The BWG and feed intake of chicks on TRT 1-4 (NRC
NPP reduced by 0.1 plus phytase and 25-OH-D3) was
significantly greater (p< 0.05) by 3.68% and 3.71%,
respectively, compared with TRT 5-8 (NRC NPP reduced by 0.2 plus phytase and 25-OH-D3) from 1 to 42 d. No significant differences (p>0.05) were found in FCR of
chicks from 1 to 42 d in any of TRT.
Meat Quality
There was no significant difference in the lightness (L* value; p=0.583), redness (a* value; p=0.273), yellowness (b* value; p=0.296), pH (p=0.878), or shear
Table 4 – Effect of the combination of NPP, phytase and 25-OH-D3 on the performance of grower broilers (22 to 42 days).
TRT NPP1 Phytase2 25-OH-D
3
3 BWG4 Feed intake FCR
(%) (U/kg) (μg/kg) (g) (g) (g/g)
1 0.3 300 34.5 606 1435ab 2.37
2 0.3 300 69 615 1463ab 2.38
3 0.3 600 34.5 625 1481a 2.37
4 0.3 600 69 613 1463ab 2.38
5 0.2 300 34.5 591 1403b 2.37
6 0.2 300 69 601 1423ab 2.37
7 0.2 600 34.5 608 1419ab 2.34
8 0.2 600 69 619 1441ab 2.33
SEM5 11 19 0.02
P 0.524 0.029 0.710
NPP effect
0.35 615 1461a 2.38
0.25 605 1422b 2.35
Phytase effect
300 603 1431 2.37
600 616 1451 2.36
25-OH-D3 effect
34.5 608 1435 2.36
69 612 1448 2.37
Source of Variation
NPP 0.227 0.0074 0.174
Phytase 0.113 0.152 0.398
25-OH-D3 0.591 0.350 0.792
NPP × Phytase 0.609 0.520 0.234
Phytase × 25-OH-D3 0.504 0.432 0.837
NPP × 25-OH-D3 0.456 0.555 0.578
NPP × Phytase × 25-OH-D3 0.488 0.389 0.976
a-c Means with no common superscripts in the same column significantly differ (p ≤ 0.05).
1. NPP =non-phytate P 2. Natuphos, BASF
force (p=0.142) of breast meat among TRT (Table 6). The lightness (L* value), redness (a* value), yellowness (b* value), pH, and shear force of breast meat were not affected by different NPP, phytase, or 25-OH-D3 levels.
Results (Table 7) showed that no significant difference was observed in the lightness (L* value; p=0.296), redness (a* value; p=0.421), yellowness (b* value; P =0.205), pH (p=0.527), or shear force (p=0.454) of thigh meat among treatments. The lightness (L* value), redness (a* value), yellowness (b* value), pH, and shear force of thigh meat were not affected by different NPP, phytase or 25-OH-D3 levels.
DISCUSSION
Growth Performance
The current NPP recommendation for broilers is 0.45% from 1 to 21 d of age and 0.35% from 22
to 42 d of age. In this study, the level of dietary NPP was 0.1 and 0.2 below the NRC (1994) when phytase
and 25-OH-D3 were added in each period to spare
NPP. Under this situation, no leg abnormality and deleterious effects on survival rate were observed. This is consistent with the findings of Coto et al. (2008),
who reported that there were no negative effects on performance of feeding a phosphorus-deficient diet with the addition of phytase and 25-OH-D3. Similarly, Biehl et al. (1995) reported that the correct combination
of phytase and 1α-OH-D3 could substantially reduce the required level of inorganic P supplementation, and consequently reduce the P level in excreta. Yan et al. (2003) suggested that the NPP requirement for optimal tibia ash content was 0.15 ± 0.049% at 49 d, when diets were supplemented with phytase.
During the entire experiment, lowering NRC NPP by 0.1 to 0.2 with the addition of phytase and
25-Table 5 – Effect of the combination of NPP, phytase and 25-OH-D3 on the performance of 1- to 42-d-old broilers
TRT NPP1 Phytase2 25-OH-D
33 BWG4 Feed intake FCR
(%) (U/kg) (μg/kg) (g) (g) (g/g)
1 0.35/0.3 300 34.5 945abc 1982abc 2.10
2 0.35/0.3 300 69 954abc 2008ab 2.10
3 0.35/0.3 600 34.5 973a 2038a 2.09
4 0.35/0.3 600 69 964ab 2021 a 2.10
5 0.25/0.2 300 34.5 917c 1930 c 2.10
6 0.25/0.2 300 69 924bc 1947bc 2.11
7 0.25/0.2 600 34.5 927bc 1934c 2.09
8 0.25/0.2 600 69 933bc 1950bc 2.09
SEM5 12 22 0.013
P 0.012 0.017 0.516
NPP effect
0.35 959a 2012a 2.10
0.25 925b 1940b 2.10
Phytase effect
300 935 1967 2.10
600 949 1986 2.09
25-OH-D3 effect
34.5 941 1971 2.10
69 944 1982 2.10
Source of Variation
NPP < 0.001 < 0.001 0.877
Phytase 0.110 0.217 0.212
25-OH-D3 0.763 0.509 0.625
NPP × Phytase 0.523 0.313 0.657
Phytase × 25-OH-D3 0.555 0.475 0.986
NPP × 25-OH-D3 0.655 0.697 0.799
NPP × Phytase × 25-OH-D3 0.673 0.501 0.762
a-c Means with no common superscripts in the same column significantly differ (p ≤ 0.05).
1. NPP =non-phytate P. From 1 to 21 d, NPP levels for broilers on treatment 1-4 and treatment 5-8 were 0.35% and 0.25% respectively. From 22 to 42 d, NPP levels for broilers on treatment 1-4 and treatment 5-8 were 0.3% and 0.2% respectively.
2. Natuphos, BASF
3. 25-OH-D3 =25-hydroxycholecalciferol, Hy-D, DSM Vitamins,shanghai,Ltd, 69 μg /kg diet=2,760 IU/kg diet.
OH-D3 reduced BWG and feed intake of chicks. This result is consistent with previous reports (Angel et al.,
2000 a,b; Karimi et al., 2013) indicating that lowering dietary NPP decreased the BWG and feed intake.
In this experiment, BWG and feed intake of starter chicks on TRT 1-4 (fed with 0.35% NPP diet) was higher by 7.87% and 6.36% than that of chicks on TRT 5-8 (fed with 0.25% NPP diet), while the BWG and FCR of grower chicks on TRT 1-4 were similar to that on TRT 5-8. This indicated that reducing NRC NPP by 0.1 to 0.2 has a stronger effect on broiler performance more during the starter phase than during the grower phase. This result is consistent with the findings of Yan
et al. (2005), who studied the ability of broiler chickens
to adapt to early moderate P deficiencies. Yan et al.
(2005) found that broiler chickens fed a low NPP diet weighed less (p< 0.05) than those fed a control diet at 18 d; however, by 23 d, these broilers had caught
up with the control birds, and no BW differences (p> 0.05) were observed on d 28 and 32. Hence, the author inferred that modern broilers have capacity to adapt when exposed to dietary P restrictions.
The information obtained in this study indicated that BWG, feed intake, and FCR were not influenced
by the different phytase or 25-OH-D3 levels. This
corroborates the findings of Ana et al. (2013), who
reported that the supplementation of the basal diet
with 25-OH-D3 had no effect on BW. Additionally,
Angel & Mitchell (2006) reported that feeding diets low in phosphorus together with phytase and 25-OH-D3 did not affect broiler performance. However, our results are contrary to those reported by Keshavarz (2003), Snow et al. (2004), and Emami et al. (2013),
indicating that phytase addition increased ADG and ADFI in diets deficient in NPP.
Table 6 – Effect of the combination of NPP, phytase and 25-OH-D3 on breast meat quality of 42-d-old broilers
TRT NPP1 Phytase2 25-OH-D
3
3 L* value4 a* value b* value pH Shear force
(%) (U/kg) (μg/kg) (lightness) (redness) (yellowness) (N)
1 0.3 300 34.5 52.60 15.40 9.52 6.04 13.18
2 0.3 300 69 51.72 16.60 9.44 6.05 13.17
3 0.3 600 34.5 51.88 16.95 9.72 6.04 13.20
4 0.3 600 69 53.06 15.65 8.74 6.02 13.23
5 0.2 300 34.5 52.13 16.53 9.59 6.02 13.21
6 0.2 300 69 51.39 16.76 8.61 6.03 13.19
7 0.2 600 34.5 51.69 16.36 9.54 6.04 13.15
8 0.2 600 69 52.04 16.11 9.23 6.04 13.18
SEM5 1.18 0.83 0.42 0.05 0.08
P 0.583 0.273 0.296 0.878 0.142
NPP effect
0.35 52.32 16.15 9.35 6.04 13.20
0.25 51.82 16.44 9.24 6.03 13.18
Phytase effect
300 51.96 16.33 9.29 6.04 13.19
600 52.17 16.27 9.31 6.04 13.19
25-OH-D3 effect
34.5 52.08 16.31 9.59 6.04 13.19
69 52.06 16.28 9.01 6.04 13.19
Source of Variation
NPP 0.210 0.402 0.518 0.553 0.571
Phytase 0.939 0.871 0.669 0.572 0.219
25-OH-D3 0.651 0.927 0.146 0.530 0.326
NPP × Phytase 0.806 0.299 0.359 0.774 0.716
Phytase × 25-OH-D3 0.084 0.134 0.718 0.340 0.079
NPP × 25-OH-D3 0.896 0.950 0.717 0.384 0.248
NPP × Phytase × 25-OH-D3 0.408 0.147 0.833 0.676 0.187
a-c Means with no common superscripts in the same column significantly differ (p ≤ 0.05).
1. NPP =non-phytate P 2. Natuphos, BASF
3. 25-OH-D3 =25-hydroxycholecalciferol, Hy-D, DSM Vitamins,shanghai,Ltd, 69µg/kg diet=2,760 IU/kg diet. 4. Means represent five pens of sixty birds each,n =5.
Meat Quality
There are no reports on the combined effects of NPP, PHY, and 25-OH-D3 on the meat quality of broilers. More studies previously reported that the supplementation with vitamin D3 before slaughter to cattle improved meat color (Wilborn et al., 2004;Lobo et al., 2012),
decreased shear force (Tipton et al., 2007; Moron et al.,
2008). Another study indicated that supplementation with vitamin D3 improved steak tenderness by affecting muscle Ca concentrations, μ-calpain activities, and muscle proteolysis (Montgomery et al., 2004).
Some paper reported the effect of 25-OH-D3 on
meat quality. Lawrence et al. (2006) and Carnagey et al. (2008) reported that the supply of an oral bolus
of 25-OH-D3 to cows before slaughter influenced
some muscle characteristics known to enhance beef tenderness, despite no effect on tenderness was not
observed. Cho et al. (2006) studied the effects of
25-hydroxy-vitamin D3 (25-OH-D3) on carcass traits and beef tenderness and observed that, although Ca concentrations of the lean muscle numerically
increased in response to 25-OH-D3 supplementation,
no statistical differences in Warner-Bratzler shear force or sensory traits were detected. In the present experiment, lightness (L* value), redness (a* value), yellowness (b* value), pH, and shear force of thigh meat were not affected by different NPP, phytase, or 25-OH-D3 levels. This result is consistent with those mentioned above.
The different effects of 25-OH-D3 and vitamin
D3 on meat quality are probably due differences in
supplementation route, supplemental dose, animal
type, etc. In most studies, vitamin D3 was orally
supplemented before slaughter and the experimental animals were cattle, whereas in the present study,
Table 7 – Effect of the combination of NPP, phytase and 25-OH-D3 on thigh meat quality of 42-d-old broilers
TRT NPP1 Phytase2 25-OH-D
3
3 L* value4 a* value b* value pH Shear force
(%) (U/kg) (μg/kg) (lightness) (redness) (yellowness) (N)
1 0.3 300 34.5 49.86 19.39 6.65 6.39 17.17
2 0.3 300 69 49.32 18.83 6.53 6.45 17.06
3 0.3 600 34.5 50.22 19.36 6.47 6.44 16.87
4 0.3 600 69 49.36 19.04 6.49 6.43 16.99
5 0.2 300 34.5 51.07 18.45 6.68 6.41 16.93
6 0.2 300 69 49.85 18.90 6.57 6.41 17.09
7 0.2 600 34.5 50.57 18.54 6.43 6.38 16.89
8 0.2 600 69 49.67 19.03 6.75 6.43 16.98
SEM5 0.94 0.53 0.30 0.06 0.25
P 0.296 0.421 0.205 0.527 0.454
NPP effect
0.3 49.69 19.16 6.53 6.43 17.02
0.2 50.29 18.73 6.61 6.41 16.97
Phytase effect
300 50.03 18. 90 6.61 6.42 17.06
600 49.95 18.99 6.53 6.42 16.93
25-OH-D3 effect
34.5 50.44 18.93 6.56 6.41 16.97
69 49.55 18.95 6.59 6.43 17.03
Source of Variation
NPP 0.208 0.278 0.105 0.282 0.609
Phytase 0.541 0.672 0.083 0.647 0.359
25-OH-D3 0.093 0.948 0.098 0.207 0.994
NPP × Phytase 0.972 0.966 0.122 0.609 0.506
Phytase × 25-OH-D3 0.629 0.764 0.066 0.813 0.783
NPP × 25-OH-D3 0.896 0.071 0.673 0.845 0.859
NPP × Phytase × 25-OH-D3 0.434 0.339 0.297 0.101 0.177
a-c Means with no common superscripts in the same column significantly differ (p ≤ 0.05).
1. NPP =non-phytate P 2. Natuphos, BASF
3. 25-OH-D3 =25-hydroxycholecalciferol, Hy-D, DSM Vitamins, shanghai, Ltd, 69µg/kg diet=2,760 IU/kg diet. 4. Means represent five pens of sixty birds each,n =5.
25-OH-D3 was supplemented in the diet from the beginning to the end of the experiment and the experimental animals were broilers. Hence, further investigations on these factors are needed.
CONCLUSION
1. During the entire experimental period, lowering
NRC NPP by 0.2 and adding phytase and 25-OH-D3
did not affect the survival rate of broilers or caused leg abnormalities.
2. In the starter phase, reducing NRC NPP by 0.1
to 0.2 with the addition of phytase and 25-OH-D3
reduced broiler BWG and feed intake. In the grower phase, reducing NRC NPP by 0.1 to 0.2 and adding phytase and 25-OH-D3 to the diet did not affect BWG or FCR, produced a small decrease in feed intake of broilers.
3. Different levels of NPP, phytase, or 25-OH-D3 did not have significant effects on meat color, pH, or shear force.
ACKNOWLEDGEMENTS
This research was supported by Nature Science Foundation of China (Beijing,China; No.30901033).
REFERENCES
Angel R, Applegate TJ, Christman M. Effect of dietary non-phytate phosphorus (NPP) on performance and bone measurements in broilers fed on a four-phase feeding system [abstract]. Poultry Science 2000a;79(Suppl1): 21-22.
Angel R, Applegate TJ, Christman M, Mitchell AD. Effect of dietary non-phytate phosphorus (NPP) level on broiler performance and bone measurements in the starter and grower phase [abstract]. Poultry Science 2000b;79(Suppl 1):22.
Angel R, Saylor WW, Dhandu AS, Powers W, Applegate TJ. Effects of dietary phosphorus, phytase, and 25-hydroxycholecalciferol on performance of broiler chickens grown in floor pens. Poultry Science 2005; 84:1031-1044.
Angel R, Saylor WW, Mitchell AD, Powers W, Applegate TJ. Effect of dietary phosphorus, phytase, and 25-hydroxycholecalciferol on broiler chicken bone mineralization, litter phosphorus, and processing yields. Poultry Science 2006;85:1200-1211.
AOAC - Association of Official Analytical Chemists. Official methods of analysis of the association of official analytical chemists. Arlington; 1990.
Biehl RR, Baker DH, Deluca HF. 1-Hydroxylated cholecalciferol compounds act additively with microbial phytase to improve phosphorus, zinc, and manganese utilization in chicks fed soy-based diets. Journal of Nutri-tion 1995;125:2407-2416.
Carnagey KM, Huff-Lonergan EJ, Lonergan SM, Trenkle A, Horst RL, Beitz DC. Use of 25-hydroxyvitamin D3 and dietary calcium to improve
tenderness of beef from the round of beef cows. Journal of Animal Science 2008;86:1637- 1648.
Cho YM, Choi H, Hwang IH, Kim YK, Myung KH. Effects of 25-hydroxy- vitamin D3 and manipulated dietary cation-anion difference on the tenderness of beef from cull native Korean cows. Journal of Animal Science,2006;84:1481-1488.
Coto C, Yan F, Cerrate S, Wang Z, Sacakli P. Effects of dietary levels of calcium and non-phytate phosphorus in broiler starter diets on live performance, bone development and growth plate conditions in male chicks fed a wheat based diet. International Journal of Poultry Science 2008;2:101-109.
Driver JP, Pesti GM, Bakalli RI, Edwards HM Jr. Phytase and 1α- Hydroxycholecalciferol supplementation of broiler chickens during the starting and growing/finishing phases. Poultry Science 2005;84:1616-1628.
Duncan DB. Multiple range and multiple-F tests. Biometrics 1955;11:1-42.
Emami NK, Naeini SZ, Ruiz-Feria CA. Growth performance, digestibility, immune response and intestinal morphology of male broilers fed phosphorus-deficient diets supplemented with microbial phytase and organic acids. Livestock Science 2013;157:506-513.
Garcia FQM, Murakami AE, Duarte CAD, Rojas ICO, Picoli KP, Pugotti MM. Use of vitamin D3 and its metabolites in broiler chicken feed on performance, bone parameters and meat quality. Asian- Australasian Journal of Animal Science 2013;26:408-415. (Corrigir no texto de Ana et al. 2013 na p. 11 para Garcia et al. 2013)
Han JC, Yang XD, Zhang T, Li H, Li WL, Zhang ZY, Yao JH. Effects of 1alpha-hydroxycholecalciferol on growth performance, parameters of tibia and plasma, meat quality, and type IIb sodium phosphate cotransporter gene expression of one to twenty-one-day-old broilers. Poultry Science 2009;88:323-329.
Honikel KO. Reference methods for the assessment of physical characteristics of meat. Meat Science 1998;49: 447-457.
Janocha A, Osek M, Klocek B. Effect of adding 25-hydroxycholecalciferol in plant diets with and without fish meal on rearing results and bones of broiler chickens. Annals of Animal Science 2009;9:415-423.
Karimi A, Coto C, Mussini F, Goodgame S, Lu C, Yuan J, Bedford MR, Waldroup PW. Interactions between phytase and xylanase enzymes in male broiler chicks fed phosphorus-deficient diets from 1 to 18 days of age. Poultry Science 2013;92:1818-1823.
Keshavarz K. A Comparison between Cholecalciferol and 25-OH-cholecalciferol on performance and eggshell quality of hens fed different levels of calcium and phosphorus. Poultry Science 2003;82:1415-1422.
Lalpanmawia H, Elangovan AV, Sridhar M, Shet D, Ajith S, Pal DT. Efficacy of phytase on growth performance, nutrient utilization and bone mineralization in broiler chicken. Animal Feed Science and Technology 2014;6(192):81-89.
Lawrence RW, Doyle J , Elliott R, Loxton I, McMeniman JP, Norton BW, Reid DJ, Tume RW. The efficacy of a vitamin D3 metabolite for improving the myofibrillar tenderness of meat from Bos indicus cattle. Meat Science 2006;72:69-78.
Liem A,Pesti GM, Atencio A, Edwards HM. Experimental approach to optimize phytate phosphorus utilization by broiler chickens by addition of supplements. Poultry Science 2009;88:1655-1665.
Lu L, Ji C, Luo XG, Liu B, Yu SX. The effect of supplemental manganese in broiler diets on abdominal fat deposition and meat quality. Animal Feed Science and Technology 2006;129: 49-59.
Montgomery JL, King MB, Gentry JG, Barham AR, Barham BL, Hilton GG, Blanton Jr JR, Horst RL, Galyean ML, Morrow Jr KJ, Wester DB, Miller MF. Supplemental vitamin D3 concentration and biological type of steers. II. Tenderness, quality, and residues of beef. Journal of Animal Science 2004;82:2092-2104.
Moron FO, Araujo FO, Pietrosemoli S , Gutierrez J ,Machado L, Martinez J. Effect of Vitamin D3 Supplementation on Meat Quality in Grazing Bovine Crossbred. Revista Cientifica-Facultad de Ciencias Veterinarias 2008;18:692-698.
National Research Council. Nutrient requirements of Poultry. 9th rev.ed. Washington: National Academy Press; 1994.
Naves LD, Rodrigues PB, Bertechini AG, Correa AD, Oliveira DH, Oliveira EC, Duarte WF, Cunha MRR. Comparison of methodologies to quantify phytate phosphorus in diets containing phytase and excreta from broilers. Asian-Australasian Journal of Animal Sciences 2014,27:1003-1012.
Pillai UP, Manoharan V, Lisle A, Li X, Bryden W. Phytase supplemented poultry diets affect soluble phosphorus and nitrogen in manure and manure-amended soil. Journal of Environmental Quality 2009;38:1700-1708.
Powell S, Johnston S, Gaston L, Southern LL. The effect of dietary phosphorus level and phytase supplementation on growth performance, bone-breaking strength, and litter phosphorus concentration in broilers. Poultry Science 2008;87:949-957.
Rama Rao SV, Raju MVLN, Panda AK, Shyam Sunder G, Sharma RP. Performance and bone mineralisation in broiler chicks fed on diets with different concentrations of cholecalciferol at a constant ratio of calcium to non-phytate phosphorus. British Poultry Science 2009;50:528-535.
SAS Institute. SAS user`s guide. Version 8 ed. Cary; 2001.
Snow JL, Baker DH, Parsons CM. Phytase, citric acid, and 1alpha-hydroxycholecalciferol improve phytate phosphorus utilization in chicks fed a corn-soybean meal diet. Poultry Science 2004;83:1187-1192.
Summers JD. Precision phosphorus nutrition. Journal of Applied Poultry Science 1997;6:495–500.
Tatara MR, Krupski W, Jankowski M, Zduńczykd Z, Jankowskic J, Studzińskie T. Effects of dietary calcium content and vitamin D source on skeletal properties in growing turkeys. British Poultry Science 2011;52:718-729.
Tipton NC, King DA, Paschal JC, Hale DS, Savell JW. Effects of oral vitamin D3 supplementation and supplement withdrawal on the accumulation of magnesium, calcium, and vitamin D in the serum, liver, and muscle tissue and subsequent carcass and meat quality of Bos indicus influenced cattle. Meat Science 2007;75:150-158.
Wilborn BS, Kerth CR, Owsley WF, Jones WR, Frobish LT. Improving pork quality by feeding supranutritional concentrations of vitamin D3. Journal of Animal Science, 2004;82: 218-224.
Yan F, Kersey JH, Waldroup PW. Phosphorus requirements of broiler chicks three to six weeks of age as influenced by phytase supplementation. Poultry Science 2001;80: 455-459.
Yan F, Kersey JH, Fritts CA, Waldroup PW. Phosphorus requirements of broiler chicks six to nine weeks of age as influenced by phytase supplementation. Poultry Science 2003;82: 294-300.