P
P
P
P
Perf
erf
erformance e
erf
erf
ormance e
ormance ev
ormance e
ormance e
v
v
v
valuation
aluation
aluation
aluation
aluation
o
o
o
o
of injection metering s
f injection metering s
f injection metering s
f injection metering sy
f injection metering s
y
y
y
ystems
stems
stems
stems
stems
Revista Brasileira de Engenharia Agrícola e Ambiental, v.6, n.1, p.159-165, 2002Campina Grande, PB, DEAg/UFPB - http://www.agriambi.com.br
Ulisses R. Antuniassi1, Paul Miller2 & Mark Paice3
1 FCA/UNESP, CP 237, CEP 18603-970, Botucatu, SP. Telefax: (14) 6802-7118. E-mail: [email protected] (Foto) 2 Chemical Application, Silsoe Research Institute, Wrest Park, Silsoe, Bedford. MK45 4HS, UK
3 Silsoe Research Institute, Wrest Park, Silsoe, Bedford. MK45 4HS, UK
Abstract Abstract Abstract Abstract
Abstract: A method for measuring the performance of agricultural injection metering systems was developed and used to assess the characteristics of three commercial system designs. Steady-state characteristics were measured using both colored dyes and salt as tracers. Dynamic response characteristics were determined by measuring salt concentration downstream of the injection point by monitoring electrical conductivity of the spray solution. Salt added to a viscous test liquid changed viscosity slightly only at low shear rates and it is concluded that this liquid is appropriate for use in evaluation tests with injection systems. Results from tests with 2 systems specifically designed for operation with agricultural sprayers gave a linear response with both water and the viscous test liquids and no evidence of dose pulsation in the delivered spray liquid. A system using a single-acting water driven piston had a performance that was dependent upon viscosity and that gave substantial dose pulsation. When injecting on the pressure side of the pump, response times for both increasing and decreasing dose levels were in the order of 3.2 s. When injecting on the input side of the pump, response times were greater and very dependant upon the total flow rate of the delivery system.
K K K K
Keeeey wey wy wory wy worororords: ds: ds: ds: ds: precision agriculture, sprayers, pesticides
A
A
A
A
Av
v
v
valiação do desempenho de sistemas
v
aliação do desempenho de sistemas
aliação do desempenho de sistemas
aliação do desempenho de sistemas
aliação do desempenho de sistemas
de injeção de defensiv
de injeção de defensiv
de injeção de defensiv
de injeção de defensiv
de injeção de defensivos
os
os
os
os
Resumo Resumo Resumo Resumo
Resumo: Um método para se medir o desempenho de sistemas de injeção de defensivos foi desenvolvido e usado para se avaliar as características de três sistemas disponíveis no mercado. A manutenção de doses constantes foi avaliada utilizando-se corantes e sais como traçantes. A resposta dinâmica a mudanças de dose foi determinada através da medição da concentração de sal na calda após o ponto de injeção, através do monitoramento da condutividade elétrica da solução. A adição de sal em uma solução viscosa-padrão teve pouca influência em sua viscosidade, concluindo-se que o líquido é apropriado para testes com sistemas de injeção de defensivos. Resultados de testes com dois sistemas projetados especificamente para uso em pulverizadores agrícolas, mostraram resposta linear para soluções em água e no líquido viscoso, sem apresentar pulsação da dose aplicada. Um sistema baseado em bomba de simples ação acionada por fluxo de água teve seu desempenho dependente da viscosidade, além de apresentar grande pulsação da dose. Quando a injeção foi realizada na linha de pressão da bomba do pulverizador, o tempo de resposta para acréscimo ou decréscimo de dose foi da ordem de 3,2 s e, quando foi realizada na linha de sucção da bomba, o tempo de resposta foi maior e muito dependente do fluxo total de calda do pulverizador.
P P P P
Palaalaalaalaalavrvrvrvrvras-chaas-chavas-chaas-chaas-chavvvve:e:e:e: agricultura de precisão, pulverizadores, defensivose:
Protocolo 088 - 19/6/2001
INTRODUCTION
The use of injection metering systems can contribute to the improvement of safety and accuracy of agricultural pesticide application. A number of injection metering systems have been proposed and tested (Harrell et al., 1973, Reichard & Ladd, 1983, Frost, 1990, Miller & Smith, 1992 and Walter et al., 2001) and several papers presenting some characteristics of these
systems have been published. However, it is difficult to compare the performance of these systems, mainly because of differences in experimental conditions and methodology.
and flow meters, electronic control systems should provide easy corrections or calibrations for chemicals with different liquids properties. Chi et al. (1989) reported that the equation for an injection system flow rate calibration can be either a single linear or a quadratic relationship, depending on the liquid viscosity. Zhu et al. (1998) found that changes in the viscosity of the metered liquid had little effect on the response time characteristics of a system using piston metering pumps. Gebhardt et al. (1984) presented results showing that the response of a flow meter can be directly linked to the chemical used and that, for some flow meters and chemicals, accuracy can only be achieved by controlling the temperature of the liquid. Cochran et al.(1987) also found fluctuations up to 50% in viscosity over ambient temperature ranges when testing some chemical formulations.
In terms of the steady-state dose response characteristics, an injection metering system should provide an accurate and stable chemical flow rate over a wide range of rates regardless of the characteristics of the metering pumps or the chemical formulation. Reichard & Ladd (1983) discussed problems related to the stability of delivered dose when using piston metering pumps and sampling the spray liquid at the nozzle. Frost (1990) calculated the range of dose rates accounting for realistic extremes of boom width and forward speed and concluded that an ideal injection metering system should be able to provide injection flow rates from 0.02 to 2.4 L min-1 (a range of 120:1).
The time response characteristic of an injection metering system is also a key performance parameter. Recent developments in precision agriculture have provided treatment maps with high resolution, and application systems must be capable of a defined and rapid response so as to achieve best results (Paice et al., 1996, Miller et al., 1997). Landers (1992) reported a time response of 20 s for a dose step change from 5.0 to 3.75 L ha-1, while Rockwell & Ayers (1996) obtained 3.8 s for
a change from 2.2 to 5.8 L ha-1. Paice et al. (1997) presented an
average time response of 0.2 s for a speed step change from 1.1 to 3.3 m s-1. For all these cases, it is difficult to compare the
performance of the systems, mainly because of differences in experimental conditions and methodology. Characteristics such as the stability of delivered dose and the time response for a step change in dose are fundamental in defining the performance of injection metering systems.
The aim of this study was to develop a methodology to evaluate dynamic and steady state dose response characteristics for injection metering systems used with agricultural crop sprayers and to make measurements to determine typical performance characteristics of commercially available systems.
MATERIAL AND METHODS
Experimental system
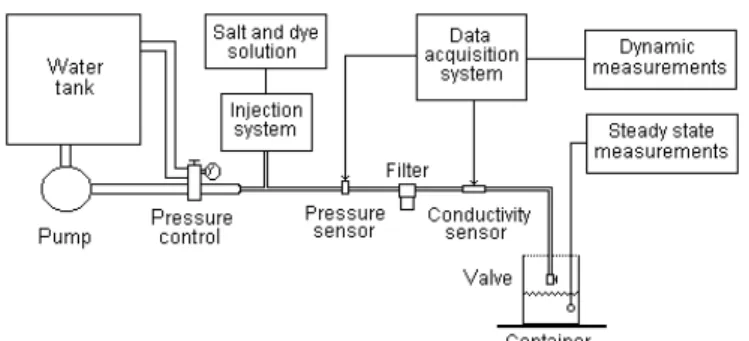
An experimental arrangement was designed to simulate the use of injection systems to meter pesticide liquids. The experimental rig was based on a 480 L tank, an electrically driven centrifugal pump and a pressure control system (Figure 1). This basic rig was changed in some of the tests according to the needs of each injection metering system used. In order to evaluate the influence of viscosity on the system behavior, both water and a viscous solution were used. Tests were
performed at total spray solution flow rates up to 26 L min-1 and
at pressures up to 500 kPa.
Figure 1. Experimental arrangement for testing the injection metering systems
The dye and salt concentrations in the spray solution were monitored using spectrophotometry and electrical conductivity measurements respectively in the experiments to determine the steady state accuracy of delivery dose. The dynamic behavior of the injection systems was determined by monitoring the electrical conductivity of the spray solution on-line using a conductivity sensor and a data acquisition system.
Spray solutions
British Standard BS 6356 (Anonymous, 1996) describes a viscous solution used as a test liquid for spray equipment. Salt (NaCl) was mixed with this solution in order to allow the electrical conductivity method to be used. Since the addition of salt could change the physical characteristics of the solution, an experiment was designed to evaluate the influence of the added salt on the physical properties such as viscosity and density of the test solution.
Dye stability in salt solutions: Salt solutions with 23.4% of NaCl in tap water were mixed with 0.1, 0.05, 0.025 and 0.01% of a tracer dye (Green S - Warner Jenkinson Europe). A 0.1% dye solution without salt was used as a reference. The solutions were stored in 100 mL measuring cylinders for 12 h. After this period, samples were collected from both the top and the bottom of the cylinders using a pipette. The samples were diluted (0.6% in tap water), and the dye concentration was determined by spectrophotometry. A difference in dye concentration in the samples taken from the upper and lower part of the measuring cylinders would give evidence of dye settling out of solution.
The influence of salt in the viscous solution: The viscous solution specified in BS 6356 is obtained by mixing polysaccharide (Xanthan), methyl cellulose and dye in tap water, following a specific mixing protocol: the polysaccharide is mixed with water, then methyl cellulose and dye are added, followed by a final mixing period. In this work, four different solutions were used, according to the step in which the salt was added in the mixing process (Table 1). All the solutions used 0.0075% of dye and 5.85% of NaCl, where appropriate.
each replication was measured using a rotating plate viscometer (Brookfield Model LV with spindle no. 3). In order to evaluate viscosity changes as a function of the shear rate, measurements were made at 6, 12 and 30 rev min-1. The density and pH of the
solutions were also measured.
Injection flow rate measurement
All injection systems were tested using water and viscous solution with 0.0075% of dye and 5.85% of NaCl. The viscous solution was prepared following the mixing procedure where the salt was added in the middle of the process (Table 1).
The injection flow rate of each system was evaluated by monitoring the electrical conductivity of the spray solution. Salt concentration changes induced proportional electrical conductivity changes, which were measured by the conductivity sensor and recorded by the data acquisition system. The relationship between the salt concentration in the spray solution and the voltage across the conductivity sensor was:
y = a + b x + c x2 + d x3
where:
x - salt concentration in the spray solution (%) y - voltage (v)
a, b, c, d - constants r2
≥ 0.9964 for all solutions used
The total spray solution flow rate was estimated from:
F = 0.644524 + 11.05903 P
where:
F - total flow rate (L min-1)
P - pressure (bar), provided that 3.3 = P = 5.0 bar r2 = 0.9983
This equation was obtained by measuring the spray output in the container when operating at pressures in the range from
3.3 to 5.0 bar. Using the data generated by the pressure sensor and the data acquisition system, it was possible to evaluate the total flow rate on-line for all experiments. The injection flow rate was calculated using the measured salt concentration in the spray solution and the estimated total flow rate.
The steady-state accuracy of delivered dose was evalua-ted using spectrophotometry and electrical conductivity mea-surements to estimate dye and salt concentration in the spray solution collected in the container (Figure 1). Several dose levels at the extremes of the range for each system were used applying water and viscous solutions, sampling the spray output for at least 20 s at each dose.
While samples for the steady-state accuracy were being collected, the data acquisition system was used to monitor the conductivity variation in the spray solution, showing the variation in dose with time for each dose level.
Time response for a step change in dose was evaluated by using the injection systems to increase injection flow rate by a factor of 3 and back to the original level. This variation was performed by changing system inputs (e.g. the required dose level), while keeping the total spray solution flow rate constant. Dose rate rise and fall times were calculated taking the time needed to change from 10% of the mean initial dose level to within 10% of the mean desired dose level, after each step change.
The injection metering systems
Measurements were made with three different commercially available injection metering systems.
System A: this system is composed of a two piston pump with variable stroke, electric motor, valves, sensors, chemical container and an electronic management system (Figure 2A). There are adjustments for parameters including dose rate and the number of active boom sections. The system is designed to inject chemicals in the carrier line to the booms after the main pump and the pressure control system and the chemical flow rate is automatically controlled. There are nine different settings related to the stroke of the pistons, allowing chemical flow rates from 0.1 to 6.0 L min-1 (producing a 60:1 range). Lower
flow rates, however, can be achieved with the same system by changing the pump. The longest stroke setting was used for the test, which allowed flow rates from 0.6 to 6.0 L min-1 to be
used.
System B: this system is composed of a peristaltic pump, electric motor, valves, sensors, chemical container and an electronic control (Figure 2B). There are adjustments for chemical dose rate, number of active boom sections and the chemical flow rate is automatically controlled. The system is designed to provide chemical flow rates from 0.03 to 3.0 L min-1 (a 100:1
range), injecting into the carrier line from the water tank, before the main pump. A 3-way valve is used for pressure and flow control. The valve inlet receives the main pump output, one of the outlets is a bypass line that returns part of the flow to the pump inlet and the other outlet carries the flow to the spray booms.
Table 1. Viscous solutions used for the tests
Solution Mixing Process
NS Standard solution without salt
SB The salt was added in the beginning of the
process, before the polysaccharide
SM The salt was added in the middle of the process,
after the dye and before the final mixing
SE The salt was added one minute before the end of
the mixing process
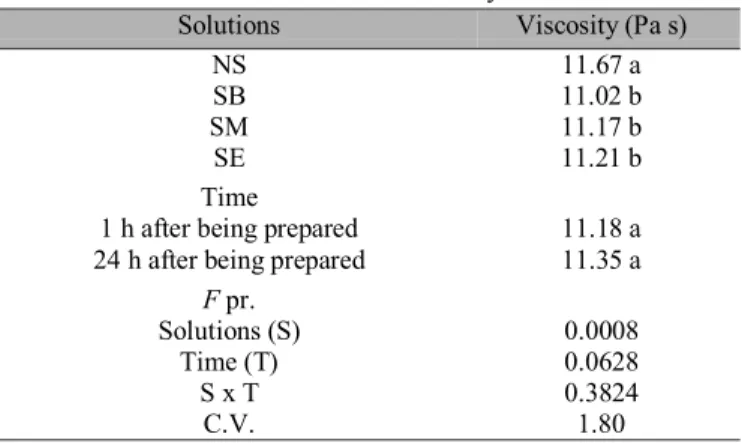
Table 2. Viscosity tests
Tests Description
I
The shearing effect of pumping the solutions through a piston pump was evaluated, measuring the viscosity of samples pumped and not pumped, immediately after being pumped and 4 h after being pumped.
II The storage effect was evaluated, measuring the
viscosity 1 and 24 h after being prepared.
III
Solutions Viscosity (Pa s)
NS 11.67 a
SB 11.02 b
SM 11.17 b
SE 11.21 b
Time
1 h after being prepared 11.18 a
24 h after being prepared 11.35 a
F pr.
Solutions (S) 0.0008
Time (T) 0.0628
S x T 0.3824
C.V. 1.80
System C: this system uses a low cost single acting water driven pump. Water passing through the pump drives a piston and valve arrangement, which sucks the chemical from the container and meters it into the water flow (Figure 2C). The system is able to work with a carrier flow range from 8 to 133 L min-1 and, by changing the effective cylinder length, it is
possible to adjust the concentration of chemical in the carrier from 0.2 to 2.0% (a 10:1 range). However, this adjustment is manual and there is no electronic control. Therefore, only tests relating to steady dose accuracy and the stability of delivered dose over the full range were performed for this system.
The results when using the viscous solution showed that the addition of salt can change some characteristics of the standard solution. Table 4 shows a very small increase in density, as well as a decrease in the pH of the viscous solution when the salt was added during the mixing process. The difference between the higher and the lower value of density was less than 2.5%, but this difference could influence results for steady-state accuracy tests. The change in pH could influence the storage process, among other features, causing modifications to the solutions with time. Viscosity tests performed 24 hours after the end of the mixing process did not show any interaction between the salt addition and the storage time (Table 5). However, if longer storage periods were being considered, further study of the influence of pH would be necessary. A. Injection metering system A
B. Injection metering system B
C. Injection metering system C
Figure 2. Different injection metering systems used in this study (A, B and C)
RESULTS AND DISCUSSION
Development of test methods
The results for dye stability in the salt solutions (Table 3) showed that high concentrations of dye were not stable in high salt concentrations, with dye deposition occurring after 12 h storage. For the constant level of salt concentration used, acceptable stability was achieved only when the dye was reduced to 0.01% (a tenth of the standard concentration).
Table 3. Spectrophotometry readings for samples corresponding to 0.6% of each original solution in tap water for two sampling position in the measuring cylinder, after 12 h storage
Spectrophotometry Absorbance, Arbitrary Units Original Solutions
Top Bottom
0.1% dye without salt 0.610 0.610
0.1% dye + 23,4% salt 0.422 0.796
0.05% dye + 23,4% salt 0.230 0.408
0.025% dye + 23,4% salt 0.154 0.217
0.01% dye + 23,4% salt 0.070 0.074
Table 4. Density and pH of the viscous solution at 19 ºC, 5 h after being prepared
Solutions Density (kg L-1) pH
NS 0.9803 7.61 SB 0.9967 7.14 SM 1.0047 7.16 SE 1.0036 7.17
The viscosity tests showed that the addition of salt significantly reduced the viscosity of the standard solution (Table 5). The differences caused by the salt addition were not high with the differences between means for the different solutions being less than 6.0%.
Table 5. The effect of time on the viscosity at 19 ºC
those containing salt, had similar viscosity behavior at different rates of shear (Figure 3), equivalent to those presented in BS 6356.
0 2 4 6 8 10 12
0 4 8 12 16 20 24 28 32
rev min-1
Viscosity (Pa s)
NS
SB
SM
SE
Figure 3. Viscosity changes as a function of the rate of shear, obtained by increasing the speed of measurement in the viscometer
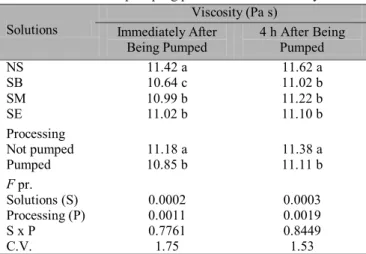
The use of non-Newtonian fluids for testing injection systems might reveal differences in performance for different metering pumps. As an example, the pumping process through a piston pump could change the viscosity of the solution, and that change would influence results for performance tests. The sensitivity of the solutions to the shearing caused by the pumping process through a piston pump is shown in Table 6. On average, all the solutions were sensitive to the pumping process, and the drop in viscosity persisted for at least 4 h after the pumping process. Despite the significant difference among the solutions, there was no interaction between the salt addition and the shearing caused by the pumping process.
Table 6. The effect of pumping process on the viscosity at 19 ºC Viscosity (Pa s)
Solutions Immediately After
Being Pumped
4 h After Being Pumped
NS 11.42 a 11.62 a
SB 10.64 c 11.02 b
SM 10.99 b 11.22 b
SE 11.02 b 11.10 b
Processing
Not pumped 11.18 a 11.38 a
Pumped 10.85 b 11.11 b
F pr.
Solutions (S) 0.0002 0.0003
Processing (P) 0.0011 0.0019
S x P 0.7761 0.8449
C.V. 1.75 1.53
Observation: the solution was pumped 1 h after being prepared. Viscosity at 6 rev min-1 on the viscometer.
Means with the same letter do not differ significantly (p = 0.05) Tukey’s HSD test
Another parameter that could influence the viscosity is temperature, and the results in Table 7 show that the viscosity was significantly higher at low temperatures, when comparing solutions at 11 and 19 ºC as expected. Again, despite differences in the viscosity among the solutions, there was no interaction between salt addition and changes in temperature.
Results with different injection systems
The steady state dose response for systems A and B is shown in Figure 4 and a linear correlation between those data and the theoretical behavior for each system is shown in Table 8.
Table 7. The effect of temperature on the viscosity, 5 h after the mixing process
Solutions Viscosity (Pa s)
NS 11.79 a
SB 11.19 c
SM 11.50 b
SE 11.36 bc
Temperature
19 ºC 11.38 b
11 ºC 11.54 a
F pr.
Solutions (S) 0.0004
Temperature (T) 0.0342
S x T 0.8539
C.V. 1.48
Observation: Viscosity at 6 rev min-1 on the viscometer. Means with the same letter do not differ
significantly (p = 0.05) Tukey’s HSD test
A.
Actual Flow (L min
-1)
B.
Actual Flow (L min
-1)
Desired Flow (L min-1)
Figure 4. Steady-state dose response for systems A and B when injecting both water and viscous solutions
Both systems had linear response characteristics when injecting both water and viscous solutions (0.9972 ≤ r2
During the tests, both systems presented some instability when injecting at the lower end of the chemical flow rate range, where the electric motors had difficulty in keeping a constant speed. Both systems achieved only 80% of the maximum flow rate defined by the manufacturers. System B did not achieved the minimum flow rate defined and stopped working below 0.06 L min-1. The flow rate range of 48:1 for system A and 40:1
for system B were therefore far below to the ideal 120:1 described by Frost (1990).
Except for the instability at very low flow rates, dose pulsation was not detected in the spray solution for systems A or B. The piston pump output in system A was uniform and a filter after the injection point alone provided an adequate mixing of both the water and viscous solution. The peristaltic pump in the system B provided some pulsation in the output, but the circulation of the spray solution through the main pump after the injection point was sufficient to avoid dose pulsation.
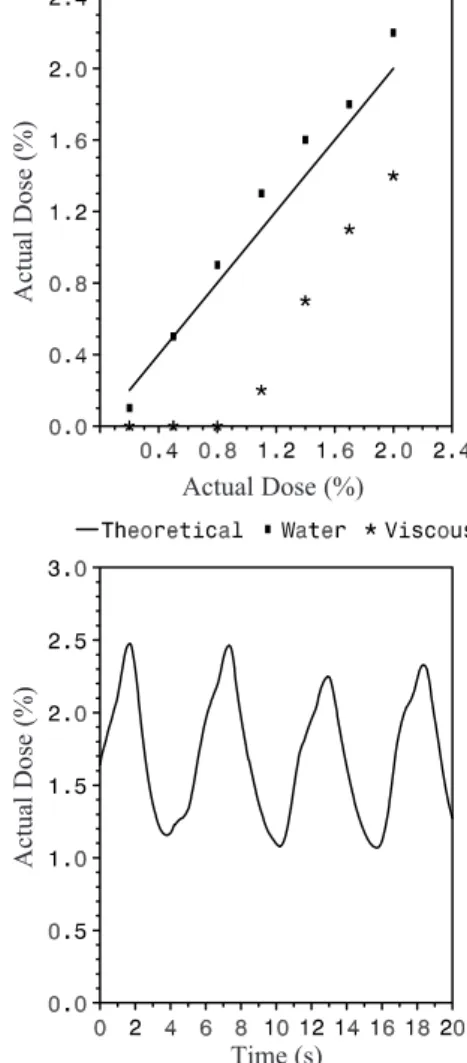
Figure 5 shows the steady-state dose response and dose pulsation measured for system C. As a water driven pump, it delivers chemicals as a percentage of the total water flow rate. The system was therefore tested applying 11, 16 and 24 L min-1.
When injecting the water-based solution, regardless of the total carrier flow rate, there was a tendency for underdosing at very low dose rates and overdosing at higher dose rates and this can be seen from the “a” and “b” constants in Table 8. This problem could be solved by changing the scale in the dose adjustment device. However, the chemical dose range from 0.2 to 2.0% is probably insufficient for agricultural crop spraying applications. The system was unable to inject the viscous solution at low rates, and at higher rates there was constant underdosing, as shown in Figure 7 and Table 8.
System C is a single acting water driven pump and for this reason some dose pulsation was expected. Since it is designed to inject into the boom supply line, after the main pump, it is necessary to provide an appropriate mixing chamber to minimize this problem. As a general observation, uniformity, amplitude and frequency of pulsation were influenced by both dose rate and total water flow rate.
Tables 9 and 10 present the time response for chemical flow rate step changes when operating systems A and B. The results show that there is no clear influence of the viscosity on the time response. Despite the quick response of system A (near to 3 seconds in average), it is significantly slower than some experimental systems. Paice et al. (1997) reported average time response of 0.2 s for a similar test and Miller et al. (1997) indicate that injection metering systems should provide a response time Table 8. Linear correlation (y = a + b x) between the data from the steady-state dose accuracy tests and the theoretical behavior for systems A, B and C when injecting water and viscous solutions
Systems Equation Water Solution Viscous Solution
a 0.0478279 0.0024278 b 1.0580943 1.0034109 A
r2 0.9992 0.9972
a -0.01683 -0.019738 b 0.9505166 0.9735609 B
r2 0.9995 0.9998
a -0.057143 -0.444048 b 1.1428571 0.8452381 C
r2 0.9957 0.8788
Actual Dose (%)
Actual Dose (%)
Actual Dose (%)
Time (s)
Figure 7. System C: steady state dose response and dose pulsa-tion when injecting 1.7% of water solupulsa-tion in a 16 L min-1 water
flow rate
Table 9. System A time response for chemical flow rate step changes in a 1:3:1 ratio, applying a total flow rate of 24 L min-1
at 4.5 bar
Step Change Time Response (s)
(L min-1) Water Solution Viscous Solution
1.50 to 4.50 2.88 3.34
4.50 to 1.50 3.06 3.37
Table 10. System B time response for chemical flow rate step changes in a 1:3:1 ratio, applying a total flow rate of 24 L min-1
at 4.5 bar
Step Change Time Response (s)
(L min-1) Water Solution Viscous Solution
0.30 to 0.90 12.16 11.56
0.90 to 0.30 14.32 15.92
of less than 1.0 s. It should be noted that for a complete sprayer fitted with an injection metering system, overall response characteristics will be a function of:
- the response time of the pump and control system; - the position of the injection input with respect to the main pump;
In this work we have not addressed factors relating to the sprayer plumbing arrangement.
Zhu et al. (1998) in a similar test using system A found no clear difference between rise and fall times in a typical plumbing arrangement and sampling at the nozzle. This agrees with our results for system A. However, system B had a slower response in the fall time because the recirculation of the spray solution in the main pump.
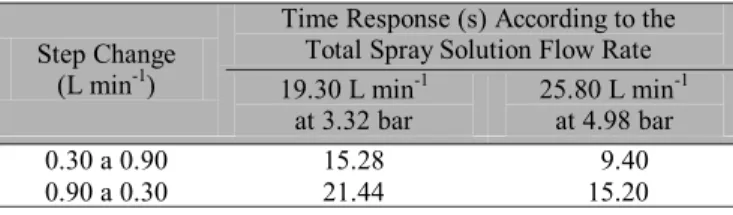
System A had a more rapid response than B in all the tests and this characteristic is related to the way that each system is fitted to the sprayer. System B is slower than A because the injection point is placed before the carrier pump. This arrangement provides recirculation of the spray solution between the bypass line and the carrier pump, as well as longer pipes between the injection point and the nozzles. The time response for this kind of arrangement can be significantly influenced by changes in the carrier flow rate (Table 11). As an example, a 25% reduction in the carrier flow rate (from 25.8 to 19.3 L min-1) was responsible for an increase of 60% in the time
response for a 1:3 flow rate step change (from 9.44 to 15.28 s for the rise time).
ACKNOWLEDGEMENTS
The first author has worked as a visiting scientist at Silsoe Research Institute with financial support from FAPESP -Fundação de Amparo à Pesquisa do Estado de São Paulo - Brasil. Thanks are due to the commercial organisations that provided equipment used in this work. The work on injection metering sys-tems at Silsoe Research Institute is part of a programme of work funded by the Ministry of Agriculture, Fisheries and Food (UK).
LITERATURE CITED
Anonymous. British Standard BS 6356. Spraying equipment for crop protection. Part 9. Specification for systems for closed transfer of liquid formulations. British Standards Institution. 1996. 7p.
Chi L.; Kushwaha R.L.; Bigsby, F.W. Chemical flow rate control for an injection type sprayer. Applied Engineering in Agriculture, St. Joseph, v.5, p.339-343. 1989.
Cochran, D.L.; Threadgill, E.D.; Law, S.E. Physical properties of three oils and oil-insecticide formulations used in agriculture. Transaction of the ASAE, St. Joseph, v.30, p.1338-1342. 1987. Frost, A.R. A pesticide injection metering system for use on agricultural spraying machines. Journal Agricultural Engineer-ing Research, London, v.46, p.55-70. 1990.
Gebhardt, M.R.; Kliethermes, A.R.; Goering, C.E. Metering concentrate pesticides. Transaction of the ASAE, St. Joseph, v.27, p.18-23. 1984.
Harrell, E.A.; Hare, W.R.; Young, J.R. Mixing pesticide with water concurrently with spraying. Journal Economic Entomology, Lanham, v.66, p.1211-1213. 1973.
Landers, A.J. An evaluation of the dose 2000 direct injection crop sprayer. In International Congress on Agricultural Engineering, 1992, Uppsala, Sweden. Paper no. 9205 119, 13p. Miller, M.S.; Smith, D.B. A direct nozzle injection controlled rate spray boom. Transaction of the ASAE, St. Joseph, v.35, p.781-785. 1992.
Miller, P.C.H.; Paice, M.E.R.; Ganderton, A.D. Methods of controlling sprayer output for spatially variable herbicide application. Proceedings of the Brighton Crop Protection Conference, Brighton, 1997, p.641-644.
Paice, M.E.R.; Miller, P.C.H.; Day, W. Control requirements for spatially selective herbicide sprayers. Computers and electronics in agriculture, Amsterdam, v.14, p.163-177. 1996 Paice, M.E.R.; Miller, P.C.H.; Lane. A.G. The response characteristics of a patch spraying system based on injection metering. Aspects of Applied Biology, Long Ashton, v.48, p.41-48. 1997
Reichard, D.L.; Ladd, T.L. Pesticide injection and transfer system for field sprayers. Transaction of the ASAE, St. Joseph,v.26, p.683-686. 1983.
Rockwell, A.D.; Ayers, P.D. A variable rate, direct nozzle injection field sprayer. Applied Engineering in Agriculture, St. Joseph,v.12, p.531-538. 1996.
Walter, A.M.; Heisel, T.; Christensen, S. Precision application of herbicides using injection sprayer systems. In: European Conference on Precision Agriculture, 3, 2001, Montpellier, Proceedings... Montpellier: Ecole Nationale Supérieure Agronomique, 2001. p.611-616.
Zhu, H; Fox, R.D.; Ozkan, H.E.; Brazee, R.D.; Derksen, R.C. Time delay for injection sprayers. Transaction of the ASAE, St. Joseph, v.41, p.525-530. 1998.
Table 11. System B time response for chemical flow rate step changes in a 1:3:1 ratio, according to the total spray solution flow rate
Time Response (s) According to the Total Spray Solution Flow Rate Step Change
(L min-1) 19.30 L min-1
at 3.32 bar
25.80 L min-1 at 4.98 bar
0.30 a 0.90 15.28 9.40
0.90 a 0.30 21.44 15.20
CONCLUSIONS
It was possible to determine the steady-state characteristics of an injection metering system by monitoring either dye concentration using spectrophotometry or salt concentration by electrical conductivity. Dynamic response characteristics could also be determined by monitoring electrical conductivity of the spray liquid. The interaction between salt and dye tracers was minimized by using low dye concentrations. The addition of salt to a viscous test liquid slightly reduced its viscosity only at low shear rates. The use of a standard viscous test liquid with salt added was effective for evaluating injection meter performance.
Injection systems A and B gave a linear dose response characteristics when injecting both water and the viscous test liquid. Except for some instability at very low flow rates, dose pulsation was not detected for these systems. The delivered accuracy from systems A and B can therefore meet the requirements for agricultural applications but the range of injection metering flow rates can not be achieved with a single pump. When injecting water, system C showed a tendency to underdose at very low dose rates and overdose at higher dose rates. It was also unable to inject the viscous solution at low rates and, at higher rates constant underdosing was detected. Dose pulsation was present for all the dose range.