Article
Evaluation of a Fe
2O
3-Based Graphite-Epoxy Tubular Electrode as
pH Sensor in Flow Injection Potentiometry
Marcos F. de S. Teixeira, Luiz A. Ramos, Neila M. Cassiano, Orlando Fatibello-Filho e Nerilso Bocchi*
Departamento de Química, Centro de Ciências Exatas e de Tecnologia, Universidade Federal de São Carlos, CP 676, 13.560-970, São Carlos - SP, Brazil
Uma avaliação sistemática de um eletrodo tubular de Fe2O3 em grafite epóxi foi realizada
através de medições de pH em um sistema de injeção em fluxo de linha única. O eletrodo tubular foi obtido pela deposição de uma mistura de óxido de ferro(III), pó de grafite e resina epóxi no interior de um orifício feito previamente no canal de injeção (de resina poliuretana). O efeito da composição do eletrodo e dos parâmetros do sistema de injeção em fluxo (vazão e volume amostra) sobre a resposta do eletrodo foram avaliados em quintuplicata (limite de confiança de 95%). A melhor resposta potenciométrica (E/mV = 178,2 - 26,5 pH; r = 0,9995) foi obtida no intervalo de pH de 2 a 12 com um eletrodo de composição em massa 30% de Fe2O3, 20% de grafite e 50% de resina
epóxi, volume de injeção de amostra de 300 µL e vazão de 3,2 mL min-1. A frequência analítica foi
90 h-1 e um tempo de vida útil de pelo menos 6 meses (mais de 2000 determinações) foi obtido.
A systematic evaluation of a Fe2O3 graphite-epoxy tubular electrode was investigated through
pH measurements in a single-channel flow injection system. The tubular electrode was obtained by deposition of a mixture of iron(III) oxide, graphite powder and epoxy resin into a hole previously made in the injection channel (of a polyuretane resin block). The effect of electrode composition and flow injection parameters (flow rate and injection sample volume) on the Fe2O3
-tubular-electrode response was initially evaluated in quintuplicate (confidence level of 95%). The best potentiometric response (E/mV = 178.2 - 26.5 pH; r = 0.9995) was reached in the pH range 2 to 12 with an electrode composition in mass of 30% Fe2O3, 20% graphite and 50% epoxy resin, injection
sample volume of 300 µL and a flow rate of 3.2 mL min-1. The frequency rate was 90 h-1 and a
useful lifetime of at least six months (more than 2000 determinations) was obtained.
Keywords: Fe2O3 tubular electrode, graphite-epoxy, pH sensor, flow injection analysis.
Printed in Brazil 0103 - 5053 $6.00+0.00
Introduction
The pH control of aqueous solutions is an important re-quirement in routine laboratories, industrial processes, alco-holic fermentation, and in medical and agricultural sciences. For this control, the glass electrode is usually the potentio-metric sensor of choice in a wide pH range. Although the glass electrode presents selectivity and sensitivity, it has some limitations such as fragility and difficulties of miniaturization for application in flow injection analysis (FIA).
Several conductometric1, spectrophotometric2-5 and
amperometric6,7 flow injection procedures have been reported
for pH determinations. More recently, a bulk acoustic wave impedance sensor based on changes in the conductivity of
the solution was developed for rapid determination of volatile acids (mainly acetic acid) in a FIA system8. There has also
been significant interest in the use of indicator electrodes as potentiometric detectors in FIA due to their high selectivity, sensitivity, simplicity and low cost. However, there are only a few reports on pH determination using indicator electrodes in FIA. Tungsten9,10 and antimony11 oxides were studied as
potentiometric electrodes as pH sensor in flow injection potentiometry. On the other hand, PVC has been used as the matrix and support for immobilization of various neutral carri-ers and ionophores12-15 in the construction of electrodes for
pH and acidity determination in FIA. Although the combina-tion of ion selective electrodes and flow injeccombina-tion analysis allows the development of systems capable of eliminating interferences, these sensors exhibit small pH response ranges and short lifetimes. The application of Ta2O5, ZrO2, Al2O3
and Si3N4 films produced on SiO2-Si substrates (CHEMFETS) as pH-sensitive membranes in FIA has also been described in *E-mail: [email protected]
the literature . However, the disadvantages of such sen-sors are arduous preparation, interference of Na+ ions and
long response time.
A number of electrode designs have been incorporated into flow injection systems. The construction of tubular elec-trodes with conductive epoxy resin has been proposed by Alegret et al.18,19. These tubular electrodes have an ideal
geometric design for the hydrodynamic flow conditions, avoiding the decrease of the analytic signal by disper-sion20,21. In the present paper, the results of a systematic
evaluation of a Fe2O3-based graphite-epoxy tubular elec-trode as pH sensor in flow injection potentiometry are re-ported. The electrode is made of graphite as the conductor, iron(III) oxide as the active material and an epoxy resin as the binding agent. The effect of electrode composition and the response characteristics under different flow injection con-ditions (flow rate and injection sample volume) on the Fe2O3 -based graphite-epoxy tubular electrode were investigated.
Experimental
Apparatus
An eight-channel model 7618-40 Ismatec (Zurich, Swit-zerland) peristaltic pump equiped with Tygon pump tubing was used for the propulsion of the fluids. The manifold was constructed with polyethylene tubing (0.8 mm i. d.). Sample injections were performed manually into the carrier stream using a three-piece manual commutator made of Perspex, with two fixed side bars and a sliding central bar.
The potential difference between the Fe2O3-based
graphite-epoxy tubular electrode and an Analion (R684 model) Ag/AgCl double-junction reference electrode was measured with a model EA 940 Orion pH/ion meter (USA) with ± 0.1 mV precision and the signals were recorded with a Cole Parmer model CR 53125 recorder.
Reagents and solutions
All solutions were prepared using Millipore Milli-Q water. All chemicals were analytical reagent grade, used without fur-ther purification. The reference solutions were prepared from a universal buffer as described by Perrin and Dempsey22:
5.7 mmol L-1 sodium tetraborate,
20 mmol L-1 disodium hydrogen phosphate
13 mmol L-1 sodium citrate.
All buffers were adjusted in the pH range 2-12 by addi-tion of HCl or NaOH soluaddi-tion. The evaluaaddi-tion of uncertainty due to the standardization should be 2% because the lack of primary standard solution. The ionic strength of the refer-ence solutions was adjusted to 0.1 mol L-1 with KCl.
Fe2O3 preparation
The Fe2O3 preparation was done following a method
reported in the literature23. Initially, 5 g of FeCl3.6H2O were
treated with a 1.0 mol L-1 ammonium hydroxide solution.
The precipitate was filtered in a 10-15 mm (medium poros-ity) sintered-glass Gooch filter, washed with distilled water several times and dried at 130oC for 4 h. Soon after, the
mixture was heated in an oven at 600oC for 4 h, in air, for the
total elimination of NH3.
Construction of the Fe2O3-based graphite-epoxy tubular
electrode
The composite materials used in the electrodes were pre-pared by mixing Fe2O3, graphite (Ultra Carbon, 10-20 mm
par-ticle size) and epoxy resin (a mixture of resin P342 and catalyst from Reforplás, Brazil, in a 5/1 mass ratio) in the following mass proportions (%): a) 20:30:50; b) 25:25:50; c) 30:20:50; e d) 35:15:50. The different Fe2O3 graphite-epoxy composites thus
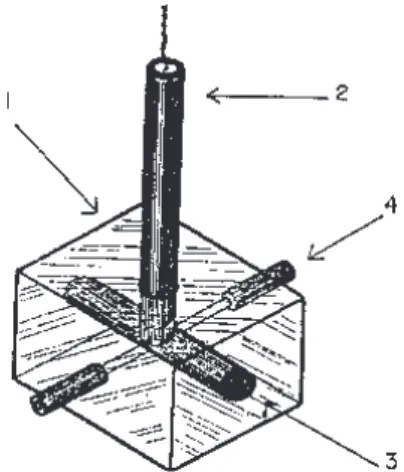
obtained were put inside a channel (diameter = 3 mm) of a polyuretane resin block (30 mm × 30 mm × 40 mm) and then dried for 24 h. One of the channel ends was connected to a coaxial cable. After, a channel (diameter = 1 mm) was drilled perpendicularly in the opposing side of the block, through the center of the composite material as shown in Figure 1.
Figure 1. Schematic diagram of the Fe2O3-based graphite-epoxy
tubular electrode used in the potentiometric measurement of pH in a flow injection system. 1 - polyuretane resin block; 2 - electric connection; 3 - hole (3 mm i. d.) where the composite electrode is deposited and 4 - hole (1 mm i. d.) through which the solution flows.
Flow injection system
Figure 2 shows the flow injection system used for the evaluation of the Fe2O3-based graphite-epoxy tubular
Results and Discussion
Effect of the electrode composition
The potentiometric response of the Fe2O3-based graph-ite-epoxy tubular electrode in aqueous solutions of different pH is determined by a charge transfer reaction at the Fe2O3/ aqueous solution interface. The mechanism by which the surface charge is established may be viewed qualitatively as a two-step process: surface hydration followed by dissocia-tion of the surface hydroxide24. This mechanism may be
represented schematically as shown in Figure 3. The surface reactions involved in the establishment of a surface charge may be represented formally by the following equations:
Fe(OH)2+(surface) + 2H2O(I) Fe(OH)3(surface)
+ H3O+(aq) (1)
Fe(OH)3(surface) FeO2-(surface) + H3O+(aq) (2)
where Fe(OH)3 (surface) represents the uncharged surface
site which by adsorbing a proton becomes positive [Fe(OH)2+] or by desorbing a proton becomes negative .
By adding equations (1) and (2) the equilibrium represented by the following equation is obtained:
Fe(OH)2+(surface) + 2H2O(l) FeO2-(surface)
+ 2H3O+(aq) (3)
The effect of the electrode composition on the poten-tiometric response of the Fe2O3-based graphite-epoxy
tu-bular electrode was evaluated in quintuplicate (confidence level of 95%) by measuring its operational potential in uni-versal buffer solutions of different pH (see Figure 4). As shown in this figure, the potential of the tubular electrode decreases linearly as the pH of the buffer solution is in-creased for all the electrode compositions studied. The negative slope (mV/pH) of the straight lines also increases as the electrode Fe2O3 content is increased up to 30%; at a
composition higher than 30% the slope decreases. The
dependence of these slopes with the electrode Fe2O3
con-tent is shown in Figure 5, where the error bars are the aver-age standard deviations of three slope values obtained from straight lines as those in Figure 4. The reproducibility of the measurements is not very good only for the two ex-treme electrode compositions; for the intermediate compo-sitions the average standard deviation is smaller than 1%. The best potentiometric response (-26.5 + 0.3 mV/pH) was reached for an electrode composition of 30% Fe2O3, 20%
graphite and 50% epoxy resin. This tubular electrode was stable for a wide range of flow hydrodynamic conditions. It is important to point out that a slope lower than 59 mV/pH (predicted by the Nernst equation) was also found for other metal oxide/aqueous electrolyte interfaces such as SiO2,
TiO2, Al2O3, ZnO and α-Fe2O3. Instead of the classical
Nernst equation, another equation was proposed to de-scribe the electrode potential with the electrolyte pH25.
Figure 2. Schematic diagram of the flow system used for the evaluation of the Fe2O3-based graphite-epoxy tubular electrode.
The central bar of the manual injector-commutator (I) shows the injection position after commutation. P peristaltic pump; S -reference solutions; L - sample loop; C - carrier solution (pH = 7); G - earthed stainless-stell tube; TE - tubular electrode; RE - Ag/AgCl reference electrode; R - recorder and W - waste.
Figure 3. Schematic illustration of the surface hydration and dissociation of the surface hydroxide in the ferric oxide.
Figure 4. pH dependence of the operational potentials (at 25oC) of
Fe2O3-based graphite-epoxy tubular electrodes with different compositions.
Flow injection parameters and tubular electrode characteristics
Preliminary studies were carried out to establish the best flow injection parameters and tubular electrode
acteristics. A carrier solution of low buffer capacity (pH = 7) was used to avoid zone acidity sample change15,26.
The effect of the sample volume was investigated from 20
µL to 400 µL (changing the length of the sample loop in the commutator) with injection of buffer solution at pH 3 (see Figure 6). As it can be noted in this figure, the potentiomet-ric response increases as the sample volume increased from 20 µL to 300 µL and remains constant for sample volumes greater than 300 µL. Thus, the sample volume of 300 µL was selected for further experiments.
Figure 5. Electrode composition dependence of the slopes of lines such as the ones shown in Figure 4. The error bars are the average standard deviations of three slope values.
Figure 6. Injection sample volume dependence on the operational potential (at 25oC) of the Fe2O3-based graphite-epoxy tubular electrode (30% Fe2O3).
The effect of the flow rate was evaluated for successive injections of buffer solution at pH 3. The highest sensitivity was obtained at a flow rate of 3.2 mL min-1; a significant
de-crease of the potentiometric response occurred at flow rates higher than 3.2 mL min-1 (Figure 7). However, at flow rates
lower than 3.2 ml min the tubular electrode presented slight memory effects and a long washing time, decreasing the ana-lytical frequency. The dynamic response of the tubular elec-trode was studied by injecting buffer solution at pH 3. A time response close to 30 s was observed for this electrode.
Figure 7. Flow rate dependence of the operational potential (at 25oC) of the Fe2O3-based graphite-epoxy tubular electrode (30% Fe2O3) for an injection volume of 300 mL of buffer solution at
pH 3.
The effect of several species such as Li+, Na+, Mg2+,
Ca2+, NH4+, SO42-, NO3-, CH3COO- and HCO3- at 1.0 x 10⁻³
mol L-1 in the solution samples (pH = 7) on the
potentio-metric response of the tubular electrode was evaluated in triplicate. The presence of all of the cations investigated did not cause any interference in this pH. On the other hand, the presence of acetate and hydrogen carbonate an-ions had a slight influence in the potentiometric response of the tubular electrode due to their influence in the buffer equilibrium. When the pH of the solution samples was higher than 9, the presence of NH4+ had a significant influence on
the electrode response, since the ammonium ion is con-verted to ammonia at such pH.
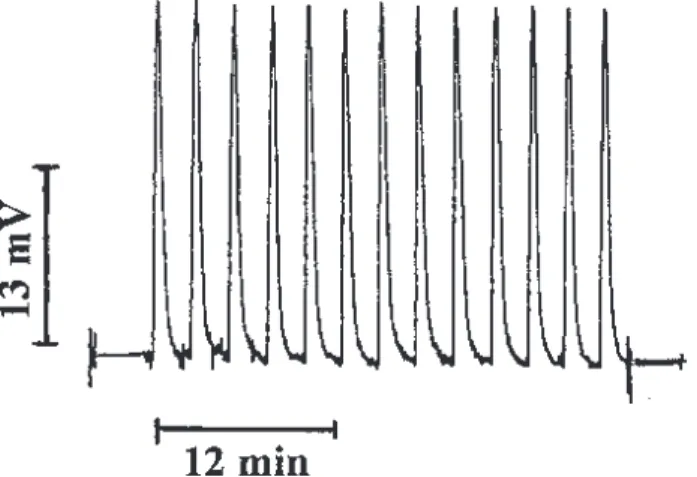
The flow injection system showed a linear response of
E vs. pH in the range 2 to 12 (E/mV = 178.2 - 26.5 pH; r = 0.9995) (Figure 4). The precision of the Fe2O3- based
graphite-epoxy tubular electrode was tested by 13 repeated runs in a buffer solution of pH 6 (see Figure 8), and a rela-tive standard deviation (r.s.d) of 2% was observed. An ana-lytical frequency of 90 h-1 was obtained and the useful
Conclusions
The proposed Fe2O3-based graphite-epoxy tubular
electrode responds to H+/OH- ion activity over a wide pH
range (2 - 12) with a slope of -26.5 mV/decade (at 25oC).
The best potentiometric response (E/mV = 178.2 - 26.5 pH; r = 0.9995) was obtained with an electrode composi-tion in mass of 30% Fe2O3, 20% graphite and 50% epoxy
resin, injection sample volume of 300 µL and flow rate of 3.2 mL min-1. Due to its low fabrication cost, high
analyti-cal frequency (90 h-1), long lifetime (greater than six months
or 2000 determinations) and good stability the proposed electrode is a suitable alternative as a pH sensor in flow injection potentiometry.
Acknowledgments
The financial support from PADCT/CNPq and FAPESP, and also the scholarships granted by CNPq to M. F. S. T. and N. M. C. are gratefully acknowledged.
References
1. Fatibello-Filho, O.; Borges, M. T. M. R. Anal. Chim. Acta 1998, 366, 81.
2. Holobar, A.; Benes, R.; Weigl, B. H.; Oleary, P.; Raspor, P.; Wolfbeis, O. S. Anal. Method. Instrum 1995, 2, 92. 3. Bellerby, R. G. J.; Turner, D. R.; Millward, G. E.;
Worsfold, P. J. Anal. Chim. Acta 1995, 309, 259.
4. Vives, S. S.; Hernadez, M. J. M.; Herrera, J. L. M.; Ramos, G. R. Anal. Chim. Acta 1992, 268, 29. 5. Sprenger, U.; Bachmann, K. Anal. Chim. Acta 1991,
243, 191.
6. Dakashev, A. D., Fresenius J. Anal. Chem. 1997,
357, 392.
7. Horvai, G.; Pungor, E. Anal. Chim. Acta 1991, 243, 55. 8. Su, X. L.; Nie, L. H.; Yao, S. Z., Fresenius, J. Anal.
Chem. 1998, 360, 272.
9. Dimitrakopoulos, L. T.; Dimitrakopoulos, T.; Alexander, P. W.; Logic, D.; Hibbert, D. B. Anal. Commun. 1998,
35, 395.
10. Chen, Z.; Alexander, P. W. Anal. Chim. Acta 1996,
332, 187.
11. Capelato, M. D.; dos Santos, A. M.; Fatibello-Filho, O.; Gama, R. Anal. Lett.1996, 29, 711.
12. Hauser, P. C.; Cardwell, T. J.; Cattrall, R. W.; Tan, S. S.; Hamilton, I. C. Anal. Chim. Acta 1989, 221, 139. 13. Egorov, V. V.; Sin'kevich, Y. V. Talanta 1999, 38, 23. 14. Cardwell, T. J.; Cattrall, R. W.; Oconnell, G. R.; Petty, J.
D.; Scollary, G. R. Electroanalysis 1992, 4, 805. 15. Martelli, P. B.; Reis, B. F.; Zagatto, E. A. G.; Lima, J. L.
F. C.; Lapa, R. A. Quím. Nova 1998, 21, 133. 16. Woias, P.; Koch, S.; Muller, E.; Barrow, D.; Cefai, J.;
Curtis, G.; Hughes, H. Sens. Actuators B 1993, 15, 68. 17. Chen, J. N.; Niu, N. M.; Ding, X. F. Sens. Mater.1997,
9, 163.
18. Alegret, S.; Alonso, J.; Bratroli, J.; Paulis, M.; Lima, J. L. F. C.; Machado, A. A. S. C. Anal. Chim. Acta 1984,
164, 147.
19. Alegret, S.; Florido, A.; Lima, J. L. F. C.; Machado, A. A. S. C. Talanta1989, 36, 825.
20. Ferreira, I. M. P. L. V.; Lima, J. L. F. C. J. Flow Injection Anal.1993, 10, 17.
21. Fatibello-Filho, O.; Teixeira, M. F. S.; Aniceto, C.; Pereira, A. V.; Costa Neto, C. O. Lab. Robot. Autom.
1999, 11, 163.
22. Perrin, D. D.; Dempsey, B. Buffers for pH and Metal Ion Control, Chapman and Hall, London, 1974. 23. Arata, K. Adv. Catalysis1990, 37, 177.
24. Parks, G. A.; de Bruyn, P. L. J. Phys. Chem.1962, 66, 967. 25. Yates, D. E.; Levine, S.; Healy, T. W. J. Chem. Soc.
Faraday Trans. 11974, 70, 1807.
26. Hongbo, H.; Hansen, E. H.; Ruzicka, J. Anal. Chim. Acta 1985, 169, 209.
Received: June 16, 1999
Figure 8. Recorder output of the pH sensitive Fe2O3-based graphite-epoxy tubular electrode corresponding to successive injections of buffer solution at pH 6.