www.ccarevista.ufc.br ISSN 1806-6690
Chlorophyll fluorescence in the evaluation of photosynthetic electron
transport chain inhibitors in the pea
1Fluorescência da clorofila na avaliação de inibidores da cadeia de transporte de
elétrons da fotossíntese em ervilha
Marcio Espinosa Farias2, Emanuela Garbin Martinazzo2 e Marcos Antonio Bacarin2*
ABSTRACT -The study aimed to evaluate the behavior of the chair of photosynthetic electron transport in the presence
of DCMU and atrazine in detached leaves of pea through simultaneous measurements of the kinetics of fluorescence transient, fluorescence delayed and modulated reflection at 820 nm. The petioles of the leaves were immersed for two hours in solution of inhibitors at concentrations of 0 (control), 25, 50, 100, 250 and 500 M. Measurements of the kinetics of fluorescence transient and fluorescence delayed and modulated reflection at 820 nm were recorded simultaneously by the M-PEA fluorometer. Simultaneous measurement of fluorescence transient, fluorescence delayed and modulated 820 nm reflection is important for assessments of the photosynthetic electron transport chain activity tool. The use of specific inhibitors of the electron transport chain allows you to collect and correlate a lot of information about the effect of different inhibitors at specific points in the photosynthetic electron transport chain. DCMU and atrazine are inhibitors of photosystem II and the concentration of 500 mM affects more strongly the flow of photosynthetic electrons.
Key words:Pisum sativumL.. Fluorescence transient. Delayed fluorescence. DCMU. Atrazine.
RESUMO -O trabalho teve como objetivo avaliar o comportamento da cadeia de transporte de elétrons fotossintética
na presença de DCMU e atrazina, em folhas destacadas de ervilha, através de medidas simultâneas das cinéticas da fluorescência transiente, decaída da fluorescência da clorofilaa e reflexão modulada a 820 nm. O pecíolo das folhas foi
imerso por duas horas em solução de inibidores nas concentrações de 0 (controle), 25, 50, 100, 250 e 500 µ M. Medidas da cinética da fluorescência transiente, da decaída da fluorescência e reflexão modulada a 820 nm foram gravadas, simultaneamente, pelo fluorômetro M-PEA. A medida simultânea da fluorescência transiente, decaída da fluorescência e reflexão modulada a 820 nm é ferramenta importante para avaliações da atividade da cadeia de transporte de elétrons fotossintética. O uso de inibidores específicos da cadeia de transporte de elétrons permite coletar e correlacionar uma série de informações sobre o efeito de diferentes inibidores em pontos específicos na cadeia de transporte de elétrons fotossintético. DCMU e atrazina são inibidores do fotossistema II e a concentração de 500 µM afeta de maneira mais acentuada o fluxo de elétrons fotossintético.
Palavras-chave:Pisum sativumL.. Fluorescência transiente. Decaída da fluorescência. DCMU. Atrazina.
DOI: 10.5935/1806-6690.20160021 * Autor para correspondência
1Recebido para publicação em 28/08/2014; aprovado em 29/10/2015
Parte da Dissertação de Mestrado do primeiro autor apresentada ao Programa de Pós-Graduação em Fisiologia Vegetal da Universidade Federal de Pelotas, pesquisa financiada pelo CNPq, CAPES e FAPERGS
2Departamento de Botânica, Instituto de Biologia, Universidade Federal de Pelotas, Campus Capão do Leão, Pelotas-RS, Brasil, 96.010-900,
INTRODUCTION
The electron transport chain (ETC) is made up of protein complexes embedded in the thylakoid membrane. The main components are photosystem II (PSII) and
photosystem I (PSI), connected in series via the cytb6f
complex and plastocyanin (PC). The interconnection between the complexes involved in electron flow is mediated by plastoquinones, mobile carrier molecules, which are located in the hydrophobic region of the thylakoid membrane (PRIBIL; LABS; LEISTER, 2014).
Chlorophyll (Chl) molecules of the antenna system of the photosystems, upon capturing luminous energy, pass from ground state to an excited state. This excitation energy can be utilised by means of a photochemical effect. However, not all the absorbed energy is directed to this end; part may be dissipated as heat or re-emitted as fluorescence. In this way, the analysis of Chl fluorescence can provide information about the amount of luminous energy used by the photochemistry and dissipated as heat (STIRBET; GOVINDJEE, 2012).
Analysis of Chla fluorescence emission, makes it
possible to evaluate this process in terms of energy flow (STRASSER; TSIMILLI-MICHAEL; SRIVASTAVA, 2004), in which the fluorescence transient (FT) is important for obtaining information about the pigment complexes, the organisation and transfer of excitation energy between them, and about various transfer reactions of specific PSII electrons (STIRBET; GOVINDJEE, 2012). However, just as the chlorophylls of the PSII emit light as FT, they also
emit another type of light, known asdelayedfluorescence
(DF), as a result of the reversal of charge separation
followed by the rapid transfer of P680* excitation energy to
the chlorophylls of the antenna system (GOLTSEVet al.,
2009; OUKARROUM; GOLTSEV; STRASSER, 2013;
STRASSERet al., 2010).
To distinguish the two types of light emission, FT is measured at the same time as illumination, while DF is measured after the actinic light is turned off, in
alternating cycles of light and dark (GOLTSEV et al.,
2009; OUKARROUM; GOLTSEV; STRASSER, 2013). According to Grabolle and Dau (2005), the similarity between the spectral emissions of FT and DF shows that the emitted photon is the result of the radioactive deactivation of the excited state of the PSII Chl.
It has been proposed that the kinetics of modulated
reflection at 820 nm (MR820) may reflect PSI activity
(STRASSER et al., 2010; YANet al., 2012), indicating
alterations in the redox state of the PC and of the PSI
(P700) reaction centre (RC) (OUKARROUM; GOLTSEV;
STRASSER, 2013; YAN et al., 2013). Strasser et al.
(2010) emphasize that simultaneous measurements of the
FT, DF and MR820 are essential for complete correlation
of the information on the different dominions of the ETC. By virtue of this correlation, research is being conducted to demonstrate the importance of such simultaneous analysis, mainly using artificial chemical compounds that can donate or accept electrons at specific locations in
the electron transport chain (YANet al., 2012). For this,
DCMU (3-(3’,4’-dichlorophenyl)-1,1-dimethylurea)) and atrazine (1-chloro-3-ethylamino-5-isopropylamino-2,4,6-triazine) are used, since they are considered to be PSII inhibitors; however, no data can be found in the literature
on the simultaneous analysis of FT, DF and MR820 where
these inhibitors are used.
The aim of this study was to evaluate changes in the
kinetics of Chla fluorescence transient emission,delayed
fluorescence and modulated reflection at 820 nm as tools in the study of electron flow in the electron transport chain of detached pea leaves.
MATERIALS AND METHODS
Seeds of the pea (Pisum sativum L.) were left to
germinate in two-litre polyethylene pots, containing soil as substrate; these were kept in a greenhouse and irrigated by micro sprinkler system. One week after emergence, the weekly application of Hoagland and Arnon nutrient solution (1950) was started in order to prevent possible mineral deficiencies.
When the plants presented young and fully expanded leaves, they were taken to the laboratory, where the leaves were detached with the aid of scissors, and the petiole immediately immersed in a 10 ml solution of each inhibitor [DCMU (3-(3’,4’-dichlorophenyl)-1,1-dimethylurea) and atrazine (2-chloro-4-ethylamino-6-isoproprilano s-triazine)].
The immersion time for the petioles, and the concentrations of the inhibitors were defined in preliminary trials, by observing the behaviour of the OJIP curve in readings carried out over 24 h to determine the soaking time which would give the greatest effect from the inhibitors; this immersion time was determined as two hours, at concentrations of 0 (control), 25, 50, 100, 250 and 500 µM. During soaking, the leaves were maintained under low-light conditions
(5 to 10 µmol photons m-2 s-1) to induce photosynthesis,
at a temperature of 22 ± 2 °C. After the leaves had been exposed to the treatments, the evaluations were carried out, using eight replications per treatment.
kinetics, delayed fluorescence and modulated reflection at 820 nm were recorded simultaneously using the Multifunctional Plant Efficiency Analyser - M-PEA fluorometer (Hansatech Instrument Ltd. Kings Lynn, Norfolk, PE30 40NE, UK).
In the M-PEA analyser, there are emitters with wavelengths in the 627 ± 10 nm band for actinic light, 820 ± 25nm band for modulated light and 735 ± 15nm band for far-red light, the latter using a filter (RG9) to remove some of the components of visible light. High quality optical filters were used to protect the FT and DF detectors (730 ± 15 nm) and the modulated reflection
detector (820 ± 20 nm) (STRASSERet al., 2010). The
saturating light pulse, with an intensity of 5,000 µmol
photons m-2 s-1, was emitted by the machine for 60 s.
Data acquisition for the three signals, FT and
MR820 in the light and DF in the dark, was carried out
every 0.01 ms for range 1 (0.01 to 0.30 ms), every 0.1 ms for range 2 (0.3-3.0 ms), and every 1 ms for range 3 (3.0 to 30 ms). Simultaneous measurement of FT and DF require a cycle with periods of light and dark, so that during each cycle, the FT is measured when the actinic light is turned on, and the DF recorded when the light is off.
The FT was analysed as per the JIP test (Strasser, Strasser, 1995), using original data: minimum fluorescence
(F0), recorded 20 s after actinic illumination; a
fluorescence intensity of 2 ms (F2ms: J-point) and 30 ms
(F30ms: I-point); and maximum fluorescence (FM). From
the modulated reflection signal at 820 nm (MR820), the
MR/MR0 ratio was calculated, where MR0 is the value
at the start of actinic illumination (at 0.7 ms). This ratio reflects changes in the redox state of the PSI reaction
centre (P700+) and of the plastocyanin (PC+). A reduction
in amplitude of the intensity of the modulated reflection at 820 nm therefore represents an accumulation of these cofactors in the oxidised state, whereas an increase in
this amplitude indicates a reduction in P700+ and PC+
(STRASSERet al., 2010). The DF induction curve shows
a rapid increase up to a peak, I1 (7 ms), a subsequent
decline to a peak, I2 (around 100 ms) and a long period
(between 0.5 and 10 s), where level I3 is located.
RESULTS AND DISCUSSION
Analysis of OJIP fluorescence transient kinetics and JIP test
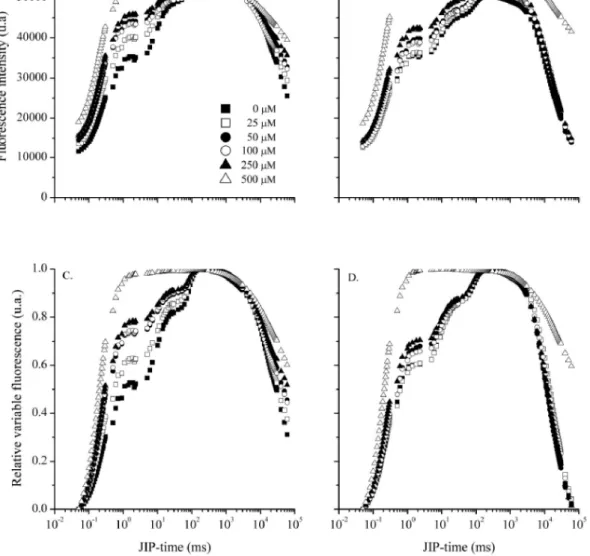
The FT of detached pea leaves treated with different concentrations of the inhibitors DCMU and atrazine
is shown in Figure 1. The Chla fluorescence transient,
represented on a logarithmic time scale starting at 50 µS, shows an increase in the level of J as the concentrations of DCMU increase (Figures 1A and 1C). Similar behaviour
was seen for values of F0, being more significant at a
concentration of 500 µM when compared to the other concentrations and the control; none of the treatments
however showed changes in the values of FM.
At a DCMU concentration of 500 µM, the induction curve lost its sigmoid characteristic between steps J and I, since the fluorescence intensity in phase J was similar to
FM (Figures 1A and 1C), suggesting an accumulation of
QA- by the complete inhibition of the transfer of electrons
from QA to QB (LAZAR, 2009). DCMU blocks the transfer
of electrons from QA to QB (VELTHUYS, 1981), as it
competes with the QB binding site on the D1 protein of
PSII (TREBST; DRABER, 1986). When the petioles of the leaves were immersed in 250 µM of DCMU for 14 hours in the dark (TÓTH; SCHANSKER; STRASSER, 2005), the behaviour was similar to that observed in the present study. The increase in fluorescence is related to
the redox state of QA, and blocking the reoxidation leads
to a simplification of the kinetics of Chl fluorescence induction (TÓTH; SCHANSKER; STRASSER, 2005) due to a complete inhibition of the transport of electrons on the
reductor side of PSII preventing the reduction of NADP+,
required for CO2 fixation (OETTMEIER, 1992). At the
remaining DCMU concentrations, the curves show the J-I and J-I-P phases as being defined, but with fluorescence intensities higher than the control.
When the leaves were treated with different concentrations of atrazine, the fluorescence induction curves showed the same behaviour as the curves of leaves treated with DCMU, starting with a concentration of 50 µM (Figures 1B and 1D). Atrazine blocks the transport
of electrons between QA and QB, since it prevents the
binding of QB in the D1 protein, and with this the flow
of electrons to the PSI stops (HESS, 2000), resulting in
a reduced accumulation of QA. The results indicate that
high concentrations of atrazine on the leaves directly interfere with the plant’s ability to convert the luminous energy absorbed into a biologically available form of energy. In studies of phytoplankton, Deblois, Dufresne and Juneau (2013) found the same loss in energy conversion caused by atrazine, with a significant effect on the cyanobacteria and algae.
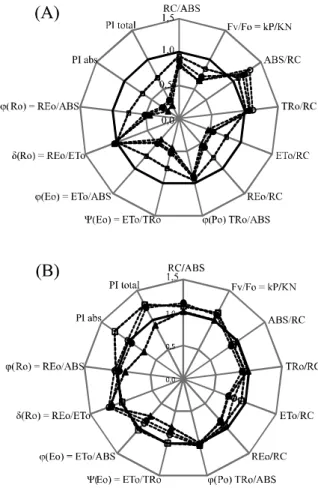
Parameters for the JIP-Test in treatments up to a concentration of 250 µM of each inhibitor, normalised to the respective controls, are shown in Figure 2. Treatment with DCMU (Figure 2A) caused a slight reduction in RC/ABS (active reaction centre), and in a more
pronounced manner, a reduction in the values for VF/F0,
Figure 1 - Fluorescence transient in detached pea leaves adapted to the dark for 30min, treated with different concentrations of DCMU (A and C) and atrazine (B and D). (A and B) fluorescence intensity and (C and D) relative variable fluorescence
related to the absorption flow of the RC, which also relates to the apparent size of the antenna system. Similarly, the same behaviour occurs with the energy flow captured by
the reaction centre (TR0/RC).
Flows at the reaction centre, which represent the
transport (ET0/RC) and the reduction flow of the terminal
acceptors on the electron acceptor side of PSI (RE0/RC),
showed similar behaviour, characterised by a reduction in value as the tested concentrations increased. The same occurs when the fluorescence values are treated as: (1) the probability of a captured exciton moving an electron in the
electron transport chain after QA- (
Eo); (2) the quantum
yield of electron transport from QA- to the intersystem of
electron acceptors ( Eo); and (3) the quantum yield related
to the reduction of the terminal electron acceptors of PSI
by absorbed photons ( Ro). This shows that there was
blocking of the electron transport from QA-.
The increase in the ABS/RC ratio indicates an apparent increase in the antenna complex of the photosystem to compensate for the high loss of energy
as heat (CHRISTEN et al., 2007). The consequence of
this loss of energy is a reduction in the rate of electron
transport (ET0/RC) and a reduction in the terminal
acceptors of PSI (RE0/RC), since the absorbed energy was
not used for photochemistry. In addition, the parameters
related to yields, efficiencies and probabilities ( Eo, Eo
and R0) were also reduced with high doses of DCMU;
Figure 2 - Quantitative parameters of the photosynthetic machinery, derived by JIP test from the OJIP polyphasic fluorescence in detached pea leaves treated with different concentrations of DCMU (A) and atrazine (B). All parameters were normalised for a concentration of 0µM. (-- 0 M; ---25 M; --- --- 50 M; --- --- 100 M and --- --- ---250 M)
demonstrate an efficient mechanism for inhibiting
electron transport between QA and QB. To reinforce
this action, the reduction in the quantum yield of the
photochemical and non-photochemical processes (FV/F0)
demonstrates that this parameter is related to the energy captured and the energy dissipated.
The indices of photosynthetic performance (PIabs
and PItotal) were affected negatively by the increases in
concentration, showing a reduction when compared to
the control. The performance index (PItotal) is the most
sensitive parameter to the JIP-test, as it incorporates several parameters which are evaluated from OJIP
fluorescence transients (YUSUF et al., 2010). Such
results indicate a negative effect on the photosynthetic machinery, since these parameters are related to energy flow throughout the ETC.
When in a solution of atrazine, pea leaves undergo minor changes to the parameters RC/ABS and
FV/F0, with a tendency for values to increase, and to the
parameters ABS/RC and TR0/RC, with a tendency to
decrease (Figure 2B). The values of ET0/RC decrease
as the concentration of the inhibitor increases. The same
can be seen for RE0/RC, however to a lesser extent.
For the parameters related to quantum yield, only
Eo decreases with increasing concentrations of atrazine
from 50 µM; a concentration of 250 µM hardly changed
Ro. The values of the parameter Eo were reduced at the
lowest concentration used, and an increase in the values of
Ro can be seen at the three highest concentrations.
PIabs showed an increase in relation to the control at
a concentration of 25 µM atrazine, and a drop at 250 µM
atrazine. PItotal showed an increase at concentrations of 25,
50 and 100 µM, the opposite being seen at a concentration of 250 µM. The reduction in these parameters indicates a loss in the capacity of the plant to carry out photochemical reactions, i.e. in the efficiency of using the energy absorbed by the antenna for converting energy into the form of ATP and NADPH. The performance indices demonstrate more sensitive behaviour than the parameter related to the
maximum photochemical quantum yield of PSII ( Po) in
plants under conditions of stress (OUKARROUMet al.,
2007). This can be confirmed by the results of this work,
since the parameter FV/FM suffered no variation in relation
to the control for any of the inhibitors being used.
Analysis of the kinetics of modulated reflection at 820 nm (MR/MR0)
Modulated reflection at 820 nm has recently been studied to evaluate the photosynthetic capacity
of PSI, by analysing the redox state of the P700 reaction
centre and the PC (YANet al., 2013). The signals of the
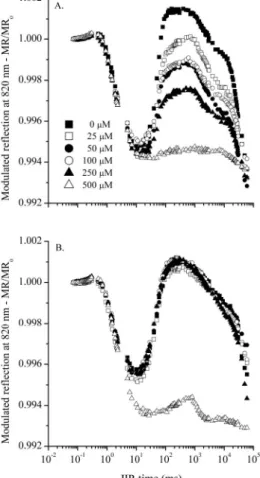
modulated reflection at 820 nm are shown in Figure 3. At
the beginning of actinic illumination (5,000 µmol m-2 s-1),
detached pea leaves, treated with inhibitors and adapted
to the dark for 30 min, showed completely reduced P700
and plastocyanins at all concentrations of both inhibitors. With the passage of illumination time, there is a drop in
amplitude of the MR/MR0 curve, indicating an increase in
the oxidised state of the P700 and plastocyanins to the point
at which re-reduction takes place, illustrated by a further increase in curve amplitude.
The accumulation of oxidised P700 and plastocyanin
increases the absorbance at 820 nm, resulting in a
reduction in MR/MR0 (rapid phase). There is a subsequent
re-reduction of PC and P700 by the intersystem electron
carriers, increasing the MR/MR0 ratio (slow phase)
(SCHANSKERet al., 2003). Generally, the length of time
the rates of oxidation and re-reduction are equal) is in the same range as the J-I phase of fluorescence transient, while the slow phase appears mainly in the I-P phase
(SCHANSKERet al.,2003; STRASSERet al., 2010).
Figure 3 - Kinetics of modulated reflection at 820 nm in detached pea leaves adapted to the dark for 30min, treated with different concentrations of DCMU (A) and atrazine (B). The signals of modulated reflection at 820 nm are represented by the MR/MR0 ratio, where MR0 is the value at which actinic illumination begins (at 0,7ms)
In the pea leaves treated with DCMU, a decrease can be seen in the amplitude of the curve, a phase which
corresponds to the re-reduction of P700 and plastocyanin as
inhibitor concentrations increase, where a concentration of 500 µM causes the extinction of this re-reduction (Figure 3A) due to the complete inhibition of the electron transport
chain beyond QA-. The same behaviour of the transient
MR/MR0 is reported by Tóth, Schansker and Strasser
(2005), showing that P700 and plastocyanin were oxidised
and remained oxidised during a sequence of red and
far-red light, since the blocking of electrons in the transport chain did not allow a reduction in the plastoquinone pool, which remained as oxidised PQ during the different light pulses (SCHANSKER; TÓTH; STRASSER, 2005).
When the inhibitor used is atrazine, the concentrations under study do not modify the behaviour of the curve when compared to the control, except for the
sharp fall in the re-reduction phase of P700 and plastocyanin
for a concentration of 500 µM (Figure 3B).
Analysis of the kinetics ofdelayedfluorescence (DF)
Just as the chlorophylls of the PSII antenna emit a fluorescence transient signal, they also emit an DF signal, this being a result of the reversal of charge separation followed by the transfer of energy from the rapid excitation
of the excited P680 to the antenna chlorophylls (GOLTSEV
et al., 2009). According to Goltsevet al. (2009), DF kinetics
comprises various components, each with a different duration and amplitude, being emitted due to the return of the electron transfer and to the charge recombination of
various redox states of PSII, such as P680+Pheo-, P
680+QA-,
Z+Q
A-, S3Z+QA-QB, S3Z+QA-QB2-. Two phases can be seen
on the FD induction curve, a phase that occurs for up to
around 300 ms, including the peaks at I1 (7 ms) and I2 (50
ms), and a slow phase that can last for several minutes
(GOLTSEV et al., 2009; OUKARROUN; GOLTSEV;
STRASSER,2013; STRASSERet al.,2010).
The FD induction curves (DF vs. JIP-time)
proposed by Strasser et al. (2010), were constructed
as DF kinetics in relation to JIP-time in the periods of
delayd at 0.02, 0.03, 0.05, 0.09, 0.15, 0.25, 1, 3, 30 and 230 ms (data not shown). The characteristic points of
the curves for DF vs. JIP-time, i.e. the I1 peak (at 3 ms),
the I2 shoulder (at 100 ms) and I3 (at 1000 ms, plateau)
were named as per terminology proposed by Goltsev
(GOLTSEVet al., 2009).
The amplitude of the curves at different OJIP times gradually reduced with the increase in DCMU
concentration, especially in relation to the I1 peak. At the
greatest concentration (500 µM), the DF induction curve disappears. The same was found in leaves treated with atrazine, albeit with a smaller intensity of reduction. At a concentration of 500 µM of atrazine, the induction curve
again loses its characteristics. According to Goltsev et
al. (2009), the I1 peak is a result of an increase in the
transmembrane electrical gradient, formed by the PSI
when P700 is oxidised, in addition to the accumulation
of reaction centres with semi-reduced QB (Z+P
680QAQB-).
The I2 shoulder is related to an increase in the Z+P
680QA
-QB- state during reduction of the PQ pool. These states
display a relatively high yield in the emission of DF.
probably associated with the prolonged reopening of
P680 through the transfer of electrons accelerated by the
quinone QB, while PQH2 is being reoxidised by the PSI
before the complete reduction of the plastoquinone pool
(GOLTSEVet al.,2009; STRASSERet al., 2010).
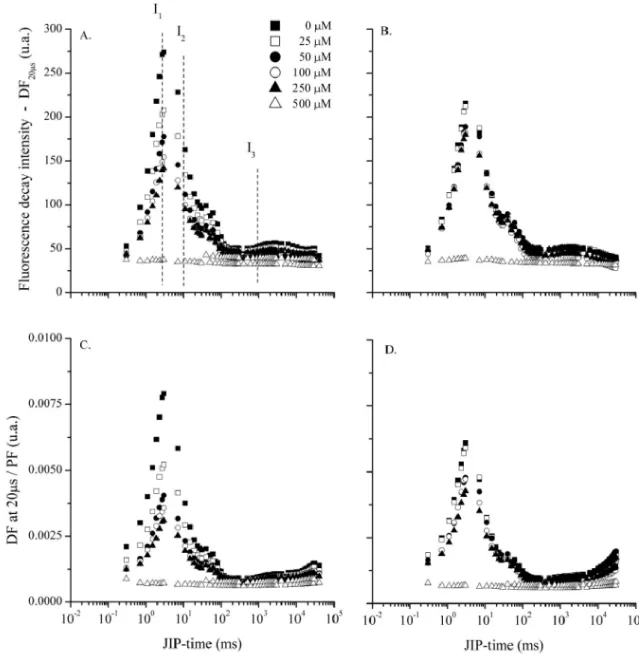
For the sake of simplicity, it was decided only to present the DF intensity measured at 20 µs after
interruption of the actinic light (DF20 s). Accordingly,
a rapid increase can be seen in the I1 peak (at 3 ms
JIP-time), with a subsequent polyphasic decline represented
Figure 4 - Delayed fluorescence intensity measured at 20 s after interruption of the actinic light (DF20 s) (A and B) and the ratio between the delayed and the intensity of fluorescence transient, measured at the same JIP-time (B and D), in detached pea leaves treated with DCMU (A and C) and atrazine (B and D)
by the I2 shoulder (at 100 ms JIP-time), followed by a
long plateau (between 0.5 and 10 s JIP-time), where
I3 is located at 1s (Figure 4). For the treatments with
DCMU, the intensity of DF20 s decreases with the
increase in concentration of the inhibitor, there is a
consequent reduction of the I1 peak, with the DF20 s
kinetics disappearing at a concentration of 500 µM, compared to the control (Figure 4A). Treatment of the leaves with atrazine showed a similar behaviour on the
DF20 s induction curve at a concentration of 500 µM
DCMU and atrazine display as an action mechanism the blocking of the transfer of electrons
from QA to QB, i.e. at a concentration of 500 µM for each
inhibitor, the loss of DF20 s kinetics was noted, when the
two peaks, I1 and I2, also disappeared, since there was no
formation of the Z+P
680QAQB- (I1) and Z+P680QA-QB- (I2)
states, which are the charge recombinations responsible for DF induction.
When the relationship between delayed fluorescence at 20 s and the intensity of Chl
fluorescence (DF20 s/PF) is shown (Figure 4C and 4D),
it is possible to express the repopulation rate of the Chl
excited by absorption (STRASSER et al., 2010). For
leaves treated with DCMU, evaluations of DF20 s/PF
showed a reduction in the intensity of this relationship as the concentration of the inhibitor increased. At the greatest concentration (500 µM), the curve lost its characteristics (Figure 4C). The same was found in the treatments with atrazine (Figure 4D).
The DF20 s/PF ratio is determined by a
concentration of the light-emitting states (the result of charge recombination) at the time the actinic light is turned off, which in turn is dependent on the rate of
closed reaction centres (reduced QA), i.e. a decrease
in DF20 s/PF is expected as the open reaction centres
decrease (STRASSER et al., 2010). As in the DF20 s
curve for the leaves treated with DCMU and atrazine,
the DF20 s/PF induction curve also decreased with
the increase in concentration, disappearing at a dose of 500 µM and indicating a low repopulation rate of excited chlorophylls; consequently, a decrease in charge recombination for those states that emit DF also occurs.
CONCLUSIONS
1. The simultaneous measurement of chlorophyll fluorescence transient, delayed fluorescence and the modulated reflection at 820 nm is an important method for evaluating the activity of the photosynthetic electron transport chain in pea leaves;
2. The use of the specific inhibitors of the electron transport chain, DCMU and atrazine, makes it possible to collect and correlate a variety of information on the effect of different inhibitors for specific points of the entire photosynthetic transport chain of electrons; 3. For pea leaves, DCMU and atrazine are inhibitors of
photosystem II, affecting the flow of electrons in the photosynthetic electron transport chain; a concentration of 500 µM more markedly affects the flow of photosynthetic electrons.
ACKNOWLEDGEMENTS
The authors wish to thank the Coordenação de Aperfeiçoamento de Pessoal de Nível Superior (CAPES), the Conselho Nacional de Desenvolvimento Científico e Tecnológico (CNPq) and the Fundação de Amparo à Pesquisa do Estado do Rio Grande do Sul (FAPERGS) for the financial aid and scholarships.
REFERENCES
CHRISTEN, D. et al. Characterization and early detection of
grapevine (Vitis vinifera) stress responses to esca disease by
in situ chlorophyll fluorescence and comparison with drought stress.Environmental and Experimental Botany, v. 60, n. 3, p. 504-514, 2007.
DEBLOIS, C. H.; DUFRESNE, K.; JUNEAU; P. Response to variable light intensity in photoacclimated algae and cyanobacteria exposed to atrazine.Aquatic Toxicology, v. 126,
p. 77-84, 2013.
GOLTSEV, V. et al. Delayed fluorescence in photosynthesis. Photosynthesis Research, v. 101, p. 217-232, 2009.
GRABOLLE, M.; DAU, H. Energetics of primary and secondary electron transfer in photosystem II membrane particles of spinach revisited on basis of recombination-fluorescence measurements. Biochimica et Biophysica Acta, v. 1708, n. 2, p. 209-218, 2005.
HESS, F. Light-dependent herbicides: an overview. Weed Science, v. 48, n. 2, p. 160-170, 2000.
HOAGLAND, D.; ARNON, D. I.The water culture method for growing plants without soil. Berkeley: California
Agricultural Experiment Station, 1950. 32 p. (Circular, 347).
LAZAR, D. Modelling of light-induced chlorophyll a uorescence rise (O–J–I–P transient) and changes in 820 nm-transmittance signal of photosynthesis.Photosynthetica, v. 47,
n. 4, p. 483-498, 2009.
OETTMEIER, W. Herbicides and photosystem II. In:
BARBER, J. (Ed.). Topics in photosynthesis. Amsterdam,
Netherlands: Elsevier Publishers, 1992. v. 11, p. 349-408. OUKARROUM, A. et al. Probing the responses of barley
cultivars (Hordeum vulgare L.) by chlorophyll a fluorescence
OLKJIP under drought stress and re-watering.Environmental and Experimental Botany, v. 60, p. 438-446, 2007.
OUKARROUM, A.; GOLTSEV, V.; STRASSER, R.J. Temperature effects on pea plants probed by simultaneous measurements of the kinetics of prompt fluorescence, delayed fluorescence and modulated 820 nm reflection.
Plos One, v. 8, n. 3, 2013.
SCHANSKER, G. et al. Characterization of the 820-nm transmission signal paralleling the chlorophyll a fluorescence rise (OJIP) in pea leaves.Functional Plant Biology, v. 30, n. 7, p. 785-796, 2003.
SCHANSKER, G.; TÓTH, S. Z; STRASSER, R. J. Methylviologen and dibromothymoquinone treatments of pea leaves reveal the role of photosystem I in the Chl a fluorescence rise OJIP.Biochimica et Biophysica Acta, v.
1706, n. 3, p. 250-261, 2005.
STIRBET, A.; GOVINDJEE. Chlorophyll a fluorescence
induction: a personal perspective of the thermal phase, the J-I-P rise.Photosynthesis Research, v. 113, p. 15-61, 2012.
STRASSER, B. J.; STRASSER, R. J. Measuring fast fluorescence transient to address environmental questions: the JIP-test. In:
MATHIS, P. (Ed.). Photosynthesis: from light to biosphere. Dordrecht, The Netherlands: Kluwer Academic Publisher, 1995. p. 977-980.
STRASSER, R. J. et al. Simultaneous in vivo recording of
prompt and delayed fluorescence and 820-nm reflection changes during drying and after rehydration of the resurrection plant
Haberlea rhodopensis.Biochimica Biophysica Acta, v. 1797,
p. 1313-1326, 2010.
STRASSER, R. J.; TSIMILLI-MICHAEL, M.; SRIVASTAVA, A. Analysis of fluorescence transient. In: PAPAFEOGIOU,
G.; GOVINDJEE (Ed.). Chlorophyll Fluorescence: a
signature of photosynthesis., Dordrecht: Springer, 2004. v. 19, p. 321-362.
TÓTH, S. Z.; SCHANSKER, G.; STRASSER, R. J. In intact leaves, the maximum fluorescence level (FM) is independent of the redox state of the plastoquinone pool: a DCMU-inhibition study. Biochimica et Biophysica Acta, v. 1708, p. 275-282, 2005.
TREBST, A.; DRABER, W. Inhibitors of photosystem II and thetopology of the herbicide and QB-binding polypeptide in the thylakoid membrane.Photosynthesis Research, v. 10, p.
381-392, 1986.
VELTHUYS, B. R. Electron-dependent competition between plastoquinone and inhibitors for binding to photosystem II.
FEBS Letters, v. 126, n. 2. p. 277-281, 1981.
YAN, K.et al. Dissection of photosynthetic electron transport
process in sweet sorghum under heat stress.Plos One, v. 8, n. 5, 2013.
YAN, K.et al. Photosynthetic characterization ofJerusalem artichoke during leaf expansion. Acta Physiologiae Plantarum, v. 34, n. 1, p. 353-360, 2012.
YUSUF, M. A.et al. Overexpression of -tocopherol methyl
transferase gene in transgenic Brassica juncea plants