Engineering ISSN: 1809-4430 (on-line)
_________________________
2 Universidade Federal do Rio Grande do Sul/ Porto Alegre - RS, Brasil.
DYNAMIC OF PRESSURE-DEFORMATION CURVE IN UNIAXIAL COMPRESSION TEST IN DIFFERENT LOAD TIMES
Doi:http://dx.doi.org/10.1590/1809-4430-Eng.Agric.v37n5p973-986/2017
MICHAEL MAZURANA1*, RENATO LEVIEN2, LUCAS ZULPO2,
GABRIELLE M. PASSOS2, HYRAN S. KERPEN2
1*Corresponding author. Universidade Federal do Rio Grande do Sul/ Porto Alegre - RS, Brasil,
E-mail: [email protected]
ABSTRACT: The loading application time by machinery tires and agricultural tires is one of the factors of soil compaction. We evaluated the effect of loading reduction time in uniaxial compression test, in laboratory, in some physical and mechanical parameters, approaching the loading field condition time by machinery with laboratory tests. Soil samples of two Oxisol and one Paleudult under different years of implementation of no tillage system (NT) and of different layers were collected and subjected to uniaxial compression tests, two times of loading application, 300 seconds per load, according to actual methodology and 30 seconds per load in the laboratory. We analyzed the soil deformation to each load, bulk density, pre-compression stress, recompress and compress indexes. Our results show that the reduction in the time of loading application can be introduced satisfactorily without changes at interested parameters. Furthermore, the soil deformation dynamic in the sample follow the elasto-plastic model used to determine the pre-compression stress, do not changing for the sigmoidal shape.
KEYWORDS: loading bearing support, compaction, recompression index.
INTRODUCTION
The intensification of the soil use, associated with the accomplishment of agricultural operations in conditions of soil humidity above friability, can induce compaction, being one of the factors responsible for its physical degradation (Tang et al., 2009; Keller et al., 2014).The effect changes the soil structure responsible for the air, water and temperature flows involved in crop production and environmental regulation (Chan et al., 2006).
The understanding of the compaction process and, consequently, its control, has two main factors: i) the causative agent, that is, the characteristics of the sets such as the load on the axle, the type of tires and the incident load, the area of tire-ground contact, the speed of operation, the skidding of traction wheels, the distance between axles (Chamen et al., 2003, Keller & Lamandé, 2010) and ii) the environment where the machine travels, that is, intrinsic attributes of the soil, related to its rheological dynamics (Keller et al., 2013), such as water content, the organic matter content, the amount and proportionality between mineral solid fraction components, the mineralogy and soil aggregation.
has been justified by the fact that this model considers constant the virgin compression line, which, for high pressures, presented a nonlinearity dynamics, being best described by an "S" type model.
In the field, when a load is applied to the soil by the machine tires in operation, it generates a transient and short duration force, unlike in the laboratory, whose applied load is a static force, confined and of longer duration. In addition, there may be distortions in the data modeling to obtain the mechanical parameters (pconsolidation pressure, compressibility index and re-compressibility) and physical parameters (maximum soil density, considering an airspace equal to or greater than 10%, total porosity and soil density in the pre-consolidation pressure), as well as other differences, both in the form and time of loading application, and in the methodology for determining the mechanical parameters, when comparing the values obtained in the field with those obtained in laboratories.
Studies carried out by Lebert et al. (1989) and Fazekas & Horn (2005) showed differences in the values of the pre-consolidation pressure as well as the compressibility index. According to these authors, there was a reduction of the first and an increase in the values of the second indicator with the increase of the loading time, in static tests using consolidometers. Similarly, Or & Ghezzehei (2002) observed reduction in soil deformation and increase in plastic deformations, by reducing and increasing the time of loading application, respectively.
Loading time is an important variable, especially when comparing values obtained in the field with values obtained in the laboratory, although it is little questioned in trials of this nature. Thus, the hypothesis that guided the study was that, under the action of the same load, the loading time affects the obtained mechanical parameters, independently of the soil class and the time of NT adoption. In order to test this hypothesis, the dynamics of the pressure-deformation curve and the mechanical parameters of pre-consolidation pressure, compressibility index and recompression index were evaluated for different soil classes and management historicals.
MATERIAL AND METHODS
Soil samples with preserved structure were collected in a typical Paleaudalf (PVd), in a typical Red Oxisol (LVd) and in a Oxisol (LBa) in different layers (0-5, 5-10, 10-15, 15-20, 20-30 and 30-40 cm) and times of NT adoption (7, 12 and 22 years in PVd, 6 and 30 years in LBa and 5, 10 and 15 years in LVd) (Table 1). For example, for LVd, 144 samples were collected in total (three times of NT adoption, four field replicates, two samples per replicate and six depths). Thus, at each time of NT adoption, 48 samples were collected, which were divided into two groups: one for loading in the consolidometer for 30 seconds (group 1) and another for loading in 300 seconds (group 2).The time of 30 seconds had as objective to approximate the time of loading application in laboratory with the time of loading application of the machines in the field. The time of 300 seconds corresponds to the maximum loading time required for 95% of the deformation in the sample, as defined by Machado (2001). The same procedure was used for the other soil classes. Although the time of the machine wheels permanence in the ground, when in operation, is infinitely smaller than the 30 seconds tested here, this time was the smallest time allowed to be adjusted in the consolidometer.
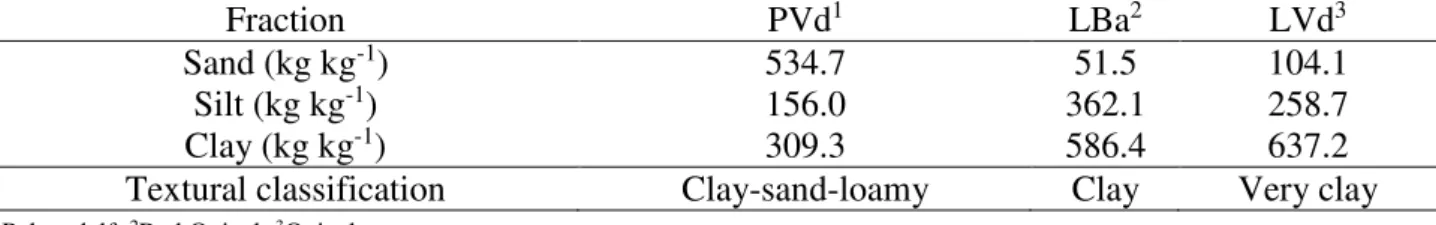
TABLE 1. Particle size distribution and classification of tree Brazilian soil classes.
Fraction PVd1 LBa2 LVd3
Sand (kg kg-1) 534.7 51.5 104.1
Silt (kg kg-1) 156.0 362.1 258.7
Clay (kg kg-1) 309.3 586.4 637.2
Textural classification Clay-sand-loamy Clay Very clay
1Paleaudalf; 2Red Oxisol; 3Oxisol.
Richards’ chamber, so that the water content of the samples were within the friability range for each soil. After the drainage of the water (100 kPa), each sample group was subjected to the sequential loads of 25, 50, 100, 200, 400, and 800 kPa (in the predetermined time) applied through an
automatic consolidometer CNTA-IHM /BR-001/07 model, manufactured by Masquetto Automation
and Equipment. The implementation methodology is described in the NBR 12007/90 standard
(ABNT, 1990), modified for agricultural conditions by Carpenedo (1994).
The deformation data for each time of load application were worked on Excel® software,
developed by Microsoft Corporation, carried out by Severiano et al. (2011). Subsequently, the obtained numerical data were analyzed in the SigmaPlot software (version 10.0), developed by Systat Software Inc.
The pressure-deformation curves for each soil class were plotted individually for each time of NT adoption and depth of sample collection. Subsequently, the data were normalized in order to allow a comparative analysis of the dynamics of each curve. In this way, it is possible to infer about soil class reflexes and/or NT adoption time in the dynamics of each curve, comparing the loading times.
Pre-consolidation pressure data, compressibility index and recompression index obtained on the basis of the dynamics of the curves within each loading time were compared by the T test (p <0.05), using the SAS Statistical Analysis System (SAS Institute Inc., Cary, NC, USA).
RESULTS AND DISCUSSION
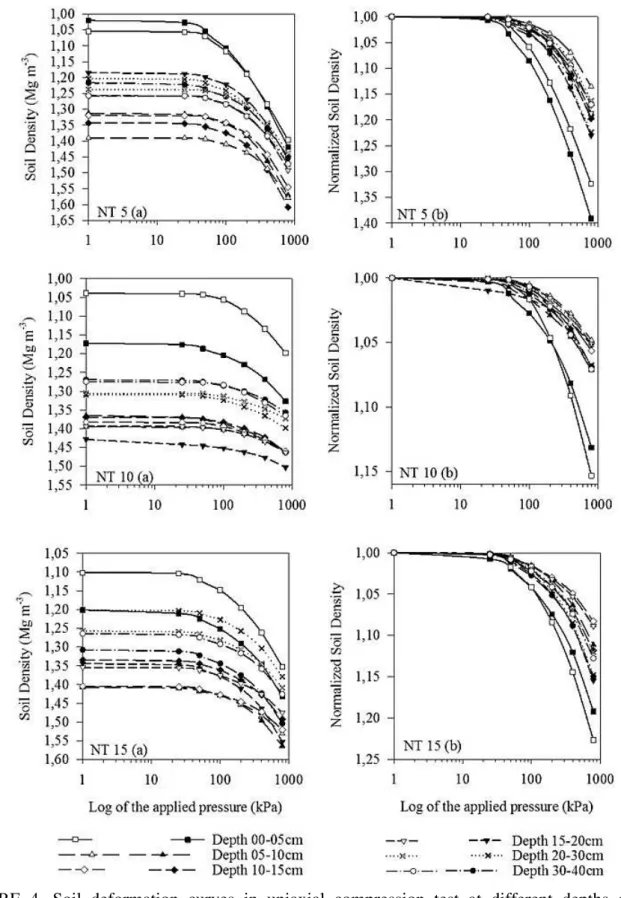
The compression curves (plotted from the relation between the soil density variation - Ds and
the applied pressure log - Logσv), for each depth and time of NT adoption are shown in Figure 2
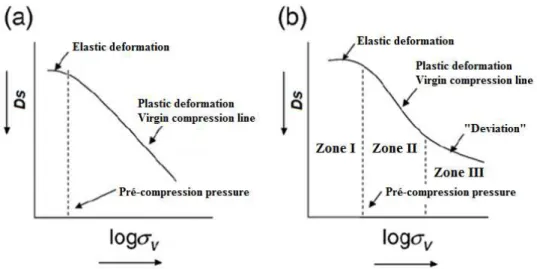
(Paleaudalf), Figure 3 (Red Oxisol) and in Figure 4 (Oxisol). Regardless of the soil class or time of NT adoption, the same dynamics were observed between them, all the data presented a good adjustment to the elasto-plastic model (Figure 1), which is the most used today. The analysis of the relation between the density variation by the logarithm variation of the applied pressure (given by
the ratio dDs/dlogv) was calculated and plotted versus the Logσv variation for each soil class and
management condition. The aim of this relation was to verify if the data could have an adjustment
dynamics also to the “S” model type (Figure 1b), not detectable by the simple adjustment Ds
-Logσv. This fact was not observed for any of the conditions analyzed (data not shown).
FIGURE 1. Main curve forms of uniaxial compression tests: (a) elasto-plastic model; and S-shape model (b). Adapted from Tang et al., (2009).
incompressible, it is necessary for the water to be drained from these pores to have a reduction of volume, which hardly occurs in well-structured soils, due to the strong bonding of the water to the mineral and organic solid fraction present, or in unstructured soils, by the lack of continuity in the pores.
Soils that have a weak structure condition (small aggregates and with low stability) or that are continuously revolved (and in this case have their structure destroyed) provide a greater probability of presenting a dynamic of the "S" curve type, as pointed out by Gregory et al. (2006) and Tang et al. (2009). According to these authors, in addition to the structural condition, more clay soils (more than 35% of clay) and with a high plasticity index (higher than seven) are more likely to present this dynamic than those with a lower index.
The analysis of soil consistency showed values of plasticity index higher than seven (9.2, 21.0 and 11.2 for PVd, LBa and LVd, respectively). However, none of the soils showed such behavior, indicating that, for the times of NT adoption under analysis, the soils maintained their structures preserved, even under high-pressure action. This fact is beneficial, as it allows the soils a load support, without suffering great shocks in its pores structure, especially meso and micro-pores responsible for the storage and redistribution of water in the soil.
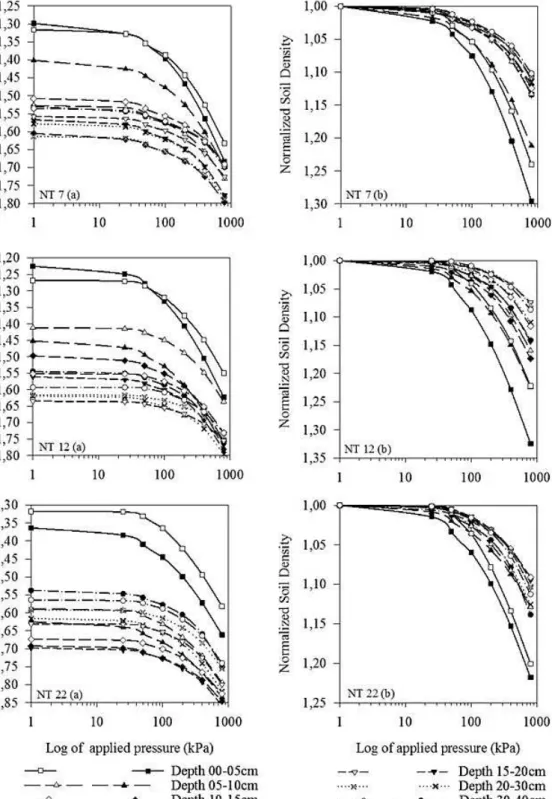
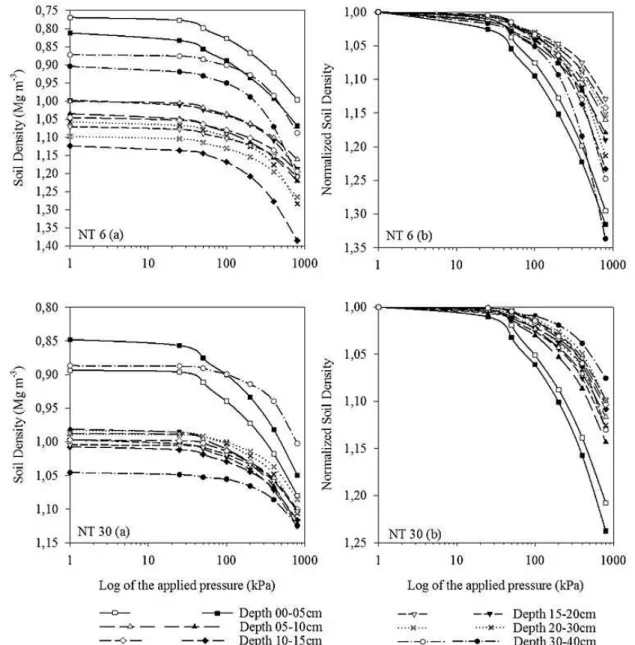
In Figures 2a, 3a and 4a, the soil density variation is shown as a function of the log of the applied pressure, for each loading time. Regardless of the loading time, a large variation in the initial density values between and within the same soil was observed, except for the LBa (Figure 3).These variations are attributed to the spatial variability of this attribute, which is influenced by the intrinsic characteristics of the soil (texture and mineralogy) and by the soil management.
The reduction in loading time (from 300 seconds to 30 seconds) did not interfere with the curve dynamics, that is, the shape obtained after each application of pressure, but rather on the magnitude of the deformation experienced by the soil at each pressure (represented by the variation in soil density). An increase in soil density was observed with the increase of applied pressure, but at low pressures (<100 kPa) the rate of increase in density was lower than compared to high pressures (>100 kPa). This indicates that pressures greater than 100 kPa have a deleterious effect on the soil structure, even at low loading times, such as those tested here, although they are lower than the methodology proposed by NBR 12007/90 (ABNT, 1990), they are still much higher than the time of loading application by the mechanized sets under normal sowing and harvesting conditions.
The largest compression deformations occurred in the layers of 0-5, 5-10 and 10-15 cm of depth. This behavior is attributed to two main factors: the presence of organic matter and the water content. In these layers there is a greater content of organic matter in different degrees of decomposition and that collaborates in the greater stability of aggregates (Tomazzi, 2008).On the other hand, the increase in organic matter content reduces the contact points between soil particles, increases the total porosity and decreases the density (Braida, 2004).Thus, when the soil deformation is related to the stability of the aggregates and the loading time, when the soil is subjected to a short loading time, the soil structure undergoes deformation, but at a lower rate. On the other hand, when the loading time is increased, there is a greater chance of rupture and rearrangement of the aggregates in more compact forms, increasing the soil density.
For the soil layers below 15 cm of depth, the content of organic matter decreases and the compressive dynamics is attributed to the water content retained in the pores. Thus, the reduction in the loading time reduces the probability of the water contained in the pores (meso and micro-pores) that is going to be drained, which would allow a new decrease in volume and an increase in density, as observed by Tang et al. (2009).
(2003), which are 1.55 Mg m-3 for sandy and medium-textured soils (20 to 55% of clay) and 1.45
Mg m-3 for soils with clay texture (> 55% of clay).
FIGURE 2. Soil deformation curves in uniaxial compression test at different depths and NT adoption times (7, 12 and 22 years) at Paleudult. Water content in soil on a mass basis
of 0.19, 0.14 and 0.18 kg kg-1 for the NT condition of 7, 12 and 22 years respectively.
FIGURE 3. Soil deformation curves in uniaxial compression test at different depth and NT adoption times (6 and 30 years) at Oxisol. Water content in soil on a mass basis of 0.36 and 0.33
kg kg-1 for 6 and 30 years of NT system respectively. White and black markers indicate
FIGURE 4. Soil deformation curves in uniaxial compression test at different depths and NT adoption times (5, 10 and 25 years) at Red Oxisol. Water content in soil on a mass
basis of 0.27, 0.20 and 0.22 kg kg-1 for 5, 10 and 15 years of NT system respectively.
White and black markers indicate load time of 30 and 300 seconds, respectively.
The pre-consolidation pressure is obtained based on the radius of the smallest curvature formed by the interpolation between the soil density data and the logarithm of the applied pressure. Thus, the lower the increase rate in the density values, the higher will be the obtained pre-consolidation pressure values, as there is a shift of the curves to the right. This is observed by the graphical analysis of the normalized data (Figure 2b, 3b and 4b), where there are no significant differences between the curves for the loading times, within the same depth.
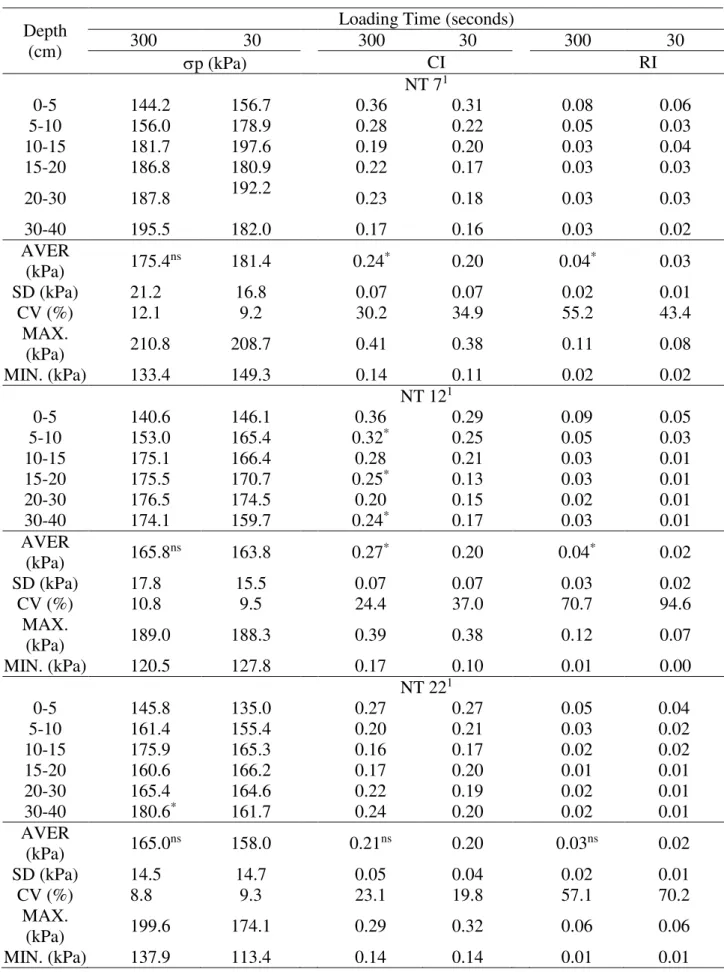
The values of pre-consolidation pressure (p), compressibility index (CI) and recompression
(RI) for soil classes and times of NT adoption are shown in Tables 2, 3 and 4. No significant
differences were observed in the values of p between loading times within the same layer, except
for the 30-40 cm in the 22-year in the NT (PVd) - Table 2 and, in the average values, in 10 NT
(LVd ) - Table 4. However, in general, there was an increase tendency in the values of σp (absolute
values) with increase of the sampling depth. This observation is similar to that observed in the
dynamics analysis of the compression curves previously discussed. The small variations presented by the curves within the same depth, however with different loading times, show that the reduction in loading time does not significantly change the results of σp. In addition, the analysis of the standard deviation, the coefficient of variation, of maximum and minimum, show a similarity in the values, indicates the same magnitude of variation in the values, regardless of the loading application time in the laboratory.
TABLE 2. Pre-compression stress (p), compress index (CI) and recompress index (RI) at two loading time in Paleudult for different NT adoption system times.
Depth (cm)
Loading Time (seconds)
300 30 300 30 300 30
p (kPa) CI RI
NT 71
0-5 144.2 156.7 0.36 0.31 0.08 0.06
5-10 156.0 178.9 0.28 0.22 0.05 0.03
10-15 181.7 197.6 0.19 0.20 0.03 0.04
15-20 186.8 180.9 0.22 0.17 0.03 0.03
20-30 187.8 192.2 0.23 0.18 0.03 0.03
30-40 195.5 182.0 0.17 0.16 0.03 0.02
AVER
(kPa) 175.4
ns 181.4 0.24* 0.20 0.04* 0.03
SD (kPa) 21.2 16.8 0.07 0.07 0.02 0.01
CV (%) 12.1 9.2 30.2 34.9 55.2 43.4
MAX.
(kPa) 210.8 208.7 0.41 0.38 0.11 0.08
MIN. (kPa) 133.4 149.3 0.14 0.11 0.02 0.02
NT 121
0-5 140.6 146.1 0.36 0.29 0.09 0.05
5-10 153.0 165.4 0.32* 0.25 0.05 0.03
10-15 175.1 166.4 0.28 0.21 0.03 0.01
15-20 175.5 170.7 0.25* 0.13 0.03 0.01
20-30 176.5 174.5 0.20 0.15 0.02 0.01
30-40 174.1 159.7 0.24* 0.17 0.03 0.01
AVER
(kPa) 165.8
ns 163.8 0.27* 0.20 0.04* 0.02
SD (kPa) 17.8 15.5 0.07 0.07 0.03 0.02
CV (%) 10.8 9.5 24.4 37.0 70.7 94.6
MAX.
(kPa) 189.0 188.3 0.39 0.38 0.12 0.07
MIN. (kPa) 120.5 127.8 0.17 0.10 0.01 0.00
NT 221
0-5 145.8 135.0 0.27 0.27 0.05 0.04
5-10 161.4 155.4 0.20 0.21 0.03 0.02
10-15 175.9 165.3 0.16 0.17 0.02 0.02
15-20 160.6 166.2 0.17 0.20 0.01 0.01
20-30 165.4 164.6 0.22 0.19 0.02 0.01
30-40 180.6* 161.7 0.24 0.20 0.02 0.01
AVER
(kPa) 165.0
ns 158.0 0.21ns 0.20 0.03ns 0.02
SD (kPa) 14.5 14.7 0.05 0.04 0.02 0.01
CV (%) 8.8 9.3 23.1 19.8 57.1 70.2
MAX.
(kPa) 199.6 174.1 0.29 0.32 0.06 0.06
MIN. (kPa) 137.9 113.4 0.14 0.14 0.01 0.01
1 Adoption time of no-tillage system in years; AVER, SD, CV, MAX and MIN -Average, Standard Deviation, Coefficient of
TABLE 3. Pre-compression stress (p), compress index (CI) and recompress index (RI) at two loading time in Oxisol for different NT adoption system times.
Depth (cm)
Loading Time (seconds)
300 30 300 30 300 30
p (kPa) CI RI
NT 61
0-5 157.6 160.1 0.25 0.22 0.13 0.11
5-10 170.5 173.4 0.18 0.17 0.06 0.05
10-15 174.6 179.8 0.30* 0.15 0.05 0.04
15-20 184.1 192.3 0.20 0.15 0.05 0.04
20-30 188.6 177.9 0.26 0.17 0.05 0.04
30-40 188.0 187.2 0.35 0.27 0.06 0.05
AVER (kPa)
176.4ns 178.5 0.26* 0.19 0.06ns 0.06
SD (kPa) 12.6 12.3 0.11 0.05 0.03 0.03
CV (%) 7.1 6.9 42.6 29.0 54.0 55.7
MAX. (kPa)
199.2 200.5 0.64 0.30 0.16 0.17
MIN. (kPa) 154.0 153.0 0.13 0.10 0.03 0.03
NT301
0-5 165.8 158.0 0.19 0.18 0.08 0.07
5-10 168.8 166.2 0.15 0.12 0.04 0.03
10-15 183.5 165.5 0.12 0.11 0.03 0.02
15-20 174.1 169.3 0.14 0.12 0.03 0.02
20-30 180.9 175.2 0.14 0.12 0.03 0.02
30-40 177.7 187.4 0.19 0.15 0.03 0.02
AVER (kPa)
175.1ns 170.2 0.15ns 0.13 0.04ns 0.03
SD (kPa) 10.5 13.3 0.05 0.03 0.02 0.02
CV (%) 6.0 7.8 34.6 24.0 53.35 67.6
MAX. (kPa)
198.8 193.2 0.32 0.21 0.08 0.09
MIN. (kPa) 157.2 139.9 0.09 0.07 0.01 0.01
1 Adoption time of no-tillage system in years; AVER, SD, CV, MAX and MIN - Average, Standard Deviation, Coefficient of
TABLE 4. Pre-compression stress (p), compress index (CI) and recompress index (RI) at two loading times in Red Oxisol for different NT adoption system times.
Prof. (cm)
Loading Time (seconds)
300 30 300 30 300 30
p (kPa) CI RI
NT 51
0-5 141.1 131.8 0.39 0.35 0.12* 0.08
5-10 165.7 175.7 0.31 0.23 0.03 0.02
10-15 172.2 168.3 0.32 0.28 0.02 0.02
15-20 155.9 165.2 0.31 0.25 0.04 0.03
20-30 164.9 165.5 0.33 0.25 0.04 0.02
30-40 165.1 155.0 0.25 0.25 0.05 0.02
AVER (kPa)
159.8ns 159.9 0.32* 0.27 0.05* 0.03
SD (kPa) 13.4 16.9 0.05 0.06 0.04 0.03
CV (%) 8.4 10.6 16.9 23.2 77.3 88.5
MAX. (kPa)
183.6 182.9 0.43 0.43 0.16 0.12
MIN. (kPa) 128.9 120.3 0.24 0.17 0.02 0.01
NT 101
0-5 176.7 145.5 0.16 0.19 0.04 0.02
5-10 164.1 149.5 0.10 0.08 0.02 0.01
10-15 157.2 136.9 0.11 0.09 0.01 0.01
15-20 183.0 160.0 0.07 0.08 0.01 0.01
20-30 134.5 134.7 0.10 0.08 0.01 0.01
30-40 160.3 133.3 0.10 0.10 0.01 0.01
AVER (kPa)
162.0* 143.8 0.10ns 0.10 0.02ns 0.01
SD (kPa) 31.4 15.3 0.05 0.05 0.01 0.01
CV (%) 19.4 10.7 49.9 48.3 59.3 88.5
MAX. (kPa)
252.0 200.1 0.29 0.25 0.05 0.03
MIN. (kPa) 105.8 126.0 0.01 0.05 0.01 0.00
NT 151
0-5 156.0 150.4 0.24 0.26 0.05 0.06
5-10 161.9 154.0 0.18 0.13 0.02 0.02
10-15 154.2 173.2 0.17 0.13 0.03 0.02
15-20 167.5 159.3 0.24 0.13 0.03 0.02
20-30 161.8 166.3 0.20 0.22 0.03 0.03
30-40 166.6 175.7 0.22 0.18 0.03 0.03
AVER (kPa)
161.3ns 162.0 0.21ns 0.17 0.03ns 0.03
SD (kPa) 13.9 14.5 0.08 0.08 0.02 0.02
CV (%) 8.6 9.0 39.2 43.5 64.9 64.9
MAX. (kPa)
185.4 186.7 0.34 0.33 0.07 0.09
MIN. (kPa) 133.0 131.3 0.09 0.10 0.01 0.01
1 Adoption time of no-tillage system in years; AVER, SD, CV, MAX and MIN - Average, Standard Deviation, Coefficient of
Variation, Maximum and Minimum values, respectively. ns, * - Non significant and significant differences, respectively, by the t test p <0.05, comparing values in the line within each variable.
2008) are the same for both loading conditions. This corroborates with the studies by Or & Ghezzehei (2002) and Fazenkas & Horn (2005), which point out that the CI increased with the increase of loading time of soil samples.
According to Salire et al. (1994), soils in which the clay fraction predominates between textural and/ or structure fractions (stable aggregates) are less susceptible to compression (lower CI), they are more resistant to compaction. This is because, in order to have differences in CI (or in σp), it is necessary to have shear of the aggregates when subjected to a load. This shear leads to a new rearrangement of the structure, reducing the empty spaces and increasing the density, as observed by Salire et al. (1994). Thus, even when the time of application of a load is reduced, there is structural damage to the soil, but in a smaller magnitude when compared to a longer time, as observed by Or & Ghezzehei (2002) and Fazenkas & Horn (2005) and evidenced by the data shown.
Thus, the longer the time of NT adoption, the greater will be the probability of organic matter accumulation and the more stable tends to be the soil structure. As the shear of the aggregates occurs in points of weakness, and originates from the low stability of the structure, and the other factors mentioned above are the same (based on the data shown), in systems with a longer time of NT adoption, it is expected that there will be no changes in the CI, regardless of the loading time, which is actually observed.
Similar to the CI, the recompression index (RI) is a parameter that allows inferring about the mechanical resilience of the soil, the capacity of the soil to recover immediately after the relief of the applied pressure. There was a significant difference between the average value of RI (Tables 2, 3 and 4) and between the loading times for the PVd soils (7 and 12 years NT) and for the LVd (5 years NT).
This dynamic is related to the soil structure load and the organic matter content, as shown by Gregory et al. (2009) and Dexter et al. (2008), respectively. With the shortest loading time, there was, at the same time, less deformation in the soil sample (fact that can be verified also by the analysis of the CI) and less recovery. On the other hand, with the longer loading time and, consequently, greater deformation, it could expect less recovery, since there was more packing of the particles. However, Keller et al. (2011) point out that a small part of the elastic energy is “stored” in the soil structure during compression and released after unloading, and the soil can be understood as a capacitor. This would grant small values of soil structure recovery, as observed in this study.
In addition, the increase in the organic matter content in the soil acts as much in the improvement of the soil structure (and with that greater aggregation and less deformation), as well as presents greater elasticity than the mineral material (Braida et al., 2008).This allows a greater recovery of the soil structure after a loading, especially if part of this organic matter is associated with minerals, as Dexter et al. (2008) pointed out.
CONCLUSIONS
The analysis of the pressure-deformation curve dynamics, in a uniaxial compression test, allows us to conclude that, regardless of the loading time, the elasto-plastic model described well the dynamics of the compression curve through increment of loads, no variations were observed for the sigmoidal adjustment model (type “S” model), for the conditions tested.
The pre-consolidation pressure values were not significantly modified by the reduction in loading time in the uniaxial test condition. Thus, it is possible to introduce, satisfactorily, the conditions of information use for agricultural purposes, the reduction in the loading application time.
the shorter time of adoption of the no-tillage system, indicating a lower stability of these soils structure.
The reduction in the loading application time in the laboratory to values close to those applied at the tire-soil interface by agricultural machines, indicated that there is an overestimation of soil susceptibility to compaction (given by the compressibility index) by the current methodology, since the main obtained parameter (the pre-consolidation pressure) showed no change in value. This suggests that many soils prone to compaction (in case of Oxisols) are not susceptible, especially if managed in long-term of no-tillage systems.
REFERENCES
ABNT - Associação Brasileira De Normas Técnicas (1990) Ensaio de adensamento unidimensional: NBR 12007. ABNT, 13p.
Arvidsson J, Keller T (2004) Soil precompression stress. I. A survey of Swedish arable soils. Soil and Tillage Research 77(1):85-95.
Braida JA (2004) Acúmulo de resíduos vegetais na superfície e de matéria orgânica no solo e suas implicações no comportamento mecânico do solo sob plantio direto. Tese, Universidade Federal de Santa Maria.
Braida JA, Reichert JM, Reinert DJ, Sequinatto L (2008) Elasticidade do solo em função da umidade e do teor de carbono orgânico. Revista Brasileira de Ciência do Solo 32(2):477-485.
Carpenedo V (1994) Compressibilidade de solos em sistemas de manejo. Tese, Porto Alegre. Universidade Federal do Rio Grande do Sul.
Chamen WTC, Alakukku L, Pires S, Sommerd C, Spoor G, Tijink F, Weisskop P (2003) Prevention strategies for field traffic-induced subsoil compaction: a review. Part 2. Equipment and field
practices. Soil and Tillage Research 73(1-2):161-174.
Chan KY, Oates A, Swan AD, Hayes RC, Dear BS, Peoples MB (2006) Agronomic consequences of tractor wheel compaction on a clay soil. Soil and Tillage Research 89(1):13-21.
Dawidowski JB, Koolen AJ (1994) Computerized determination of the preconsolidation stress in compaction testing of field core samples. Soil and Tillage Research 31(2-3):277-282.
Debiasi H, Levien R, Trein CR, Conte O, Mazurana M (2008) Capacidade de suporte e compressibilidade de um Argissolo, influenciadas pelo tráfego e por plantas de cobertura de inverno. Revista Brasileira de Ciência do Solo 32:2629-2637.
Dexter AR, Richard G, Arrouays D, Czyz EA, Jolivet C, Duval O (2008) Complexed organic matter controls soil physical properties. Geoderma 144(3-4):620-627.
Fazekas O, Horn R (2005) Zusammenhang zwischen hydraulicher und mechanischer
Bodenstabilität in Abhängigkeit von der Belastungsdauer. Journal of Plant Nutrition Soil Science 168(1):60-67.
Gregory AS,Watts CW, Griffiths BS, Hallet PD, Kuan HL, Whitmore AP (2009) The effects of
long-term soil management on the physical and biological resilience of a range of arable and grassland soils in England. Geoderma 153(1-2):172-185.
Gregory AS, Whalley WR, Watts CW, Bird NRA, Hallet PD, Whitmore AP (2006) Calculation of the compression index and precompression stress from soil compression test data. Soil and Tillage Research 89(1):45-57.
Keller T, Berli M, Ruiz S, Lamandé M, Arvidsson J, Schjonning P, Selvadurai APS (2014) Transmission of vertical soil stress under agricultural tyres: Comparing measurements with simulation. Soil and Tillage Research 140:106-117.
Keller T, Lamandé M (2010) Challenges in the development of analytical soil compaction models. Soil and Tillage Research 111(1):54-64.
Keller T, Lamandé M, Peth S, Berli M, Delenne JY, Baumgarten WR, Radjaï F, Rajchenbach J, Selvaduari APS, Or D (2013) An interdisciplinary approach towards improved understanding of soil deformation during compaction. Soil and Tillage Research 128:61-80.
Keller T, Lamandé M, Schjonning P, Dexter AR (2011) Analysis of soil compression curves from uniaxial confined compression tests. Geoderma 163(1-2):13-23.
Lebert M, Burger M, Horn R (1989) Effects of dynamic and static loading on compaction of structured soils. In: MECHANICS and Related Processes in Structured Agricultural Soils. Dordrecht, Kluwer, p73-80. (NATO ISI Series, E: Applied Sciences 172)
Machado ALT (2001) Previsão do esforço de tração para ferramentas estreitas em solos do Rio Grande do Sul. Tese, Porto Alegre, Universidade Federal do Rio Grande do Sul.
Or D, Ghezzehei TA (2002) Modeling post-tillage soil structural dynamics: a review. Soil and Tillage Research 64(1-2):41-59.
Pereira JO, De’Fossez P, Richard G (2007) Soil susceptibility to compaction by whelling as a function of some properties of s silty soil as affected by the tillage systems. European Journal of Soil Science 58(1):34-44.
Reichert JM, Reinert DJ, Braida JA (2003) Qualidade dos solos e sustentabilidade de sistemas agrícolas. Revista Ciência e Ambiente 27:29-48.
Salire EV, Kammel JE, Hardcastle JH (1994) Compression of intact subsoils under short-duration loading. Soil and Tillage Research 31(2-3):235-248.
Severiano EC, De Oliveira GC, Dias Júnior MS, Costa KAP, Benites VM, Filho SMF (2011)
Structural changes in latosols of the cerrado region: II – soil compressive behavior and modeling of
additional compaction 35:783-791.
Tang AM, Cui Y, Eslami J, Défossez P (2009) Analysing the form of the confined uniaxial compression curve of various soils. Geoderma 148(3-4):282-290.