European Accounting and
Management Review
Volume 5, Issue 1, November 2018
ISSN (online): 2385-3921
Published on
AIMS AND SCOPE OF THE JOURNAL
The European Accounting and Management Review (EAMR) is a peer-reviewed journal that aims to contribute to the advancement of scientific and technical knowledge in the fields of accounting and management, through publishing of research papers, including those which analyze problems of the research activities in these disciplines.
EAMR articles are built in a framework of a theory and contribute to management practice using a variety of empirical methods (quantitative, qualitative, field, laboratory, meta-analytic, and combination). Research papers written from the theoretical and methodological perspective of other disciplines -such as economics, industrial engineering, law, management science, operations and other social sciences- are accepted as long as they include an interface with accounting and management and contribute to the study and understanding of organizations. Work published should be of interest of accountants and organizational experts, whether they work in industry, the public sector, in consulting, or in academic institutions.
EAMR is published by the Catalan Association of Accounting and Management (Associació Catalana de Comptabilitat i Direcció, ACCID), an association founded in 2002 with the intention of becoming a nexus for professionals and academics working in the field of accounting and management. Currently, ACCID has more than 10.000 associate members and is oriented towards the following objectives: Improving the transparency of financial information, the promotion of best practices in the disclosure of financial information. The existence of a platform for debate and opinion about accounting issues, the promotion of research and the dissemination of new developments regarding accounting and management and, finally, the organization of conferences, seminars and conferences.
EAMR provides authors and academics many benefits, such as free PDFs of the articles published, special discounts for ACCID publications and much more.
OPEN ACCES POLICY
Dr. Diego Prior (Universitat Autònoma de Barcelona)
Dr. Llorenç Bagur (Barcelona School of Management – Universitat Pompeu Fabra) Dr. Fernando Campa (Universitat Rovira i Virgili)
Dra. Soledad Moya (ESADE)
Dr. Jordi Perramon (Barcelona School of Management – Universitat Pompeu Fabra)
EDITORIAL TEAM
Oriol Amat (Universitat Pompeu Fabra)
Josep Maria Argilés (Universitat de Barcelona) Josep Bisbe (ESADE)
Walter Briec (Université Perpignan) Simon Čadež (University of Ljublijana) Danny Chow (Durham University)
Elisabeth A. Demers (Darden School of Business) José Luis Gallizo (Universitat de Lleida)
María Antonia García Benau (Universitat de València)
Domingo García Pérez de Lema (Universidad Politécnica de Cartagena) Tom Groot (University of Amsterdam)
David Hillier (Strathclyde University)
Kristiaan Kerstens (CNRS, IESEG School of Management) Baruch Lev (New York University, Stern School of Business) Josep Llach (Universitat de Girona)
Cecilio Mar- Molinero (Kent Business School)
Frederic Marimon (Universitat Internacional de Catalunya) Chris Nobes (Reading University)
Vicente Pina (Universidad de Zaragoza)
Josep Rialp (Universitat Autònoma de Barcelona) Juan M. Rivera (University of Notre Dame) Hanno Roberts (Norwegian Business School)
Gonzalo Rodríguez (Universitat Autónoma de Barcelona)
Waymond Rodgers (Hull University / University of Texas, El Paso) Josep Maria Rosanas (IESE)
INDEX
Mission Climate Measurement: a new validated scale
Marta Mas-Machuca and Frederic Marimon
...1
Value Creation and Women on Boards
Bettina C.K. Binder
...21
The European Perspective of the Labour Market for Graduates in Business Administration: The Spanish case
Miguel de Aguilera, Mercedes Cancelo and José Daniel Barquero
...47
A Binomial Model with Edgeworth Expansion on Particular Circumstances
Gaston Milanesi and Emilio El Alabi
...69
Supplier–customer negotiation model: the vendor receives a bonus for holding the inventory
Frederic Marimon and Jasmina Berbegal-Mirabent
...94
European Accounting and
Management Review
EUROPEAN ACCOUNTING AND MANAGEMENT REVIEW
VOLUME 5, ISSUE 1, ARTICLE 1, 1-20, NOVEMBER 2018
Mission Climate Measurement: a new validated scale
Marta Mas-Machuca
Universitat Internacional de Catalunya Frederic Marimon
Universitat Internacional de Catalunya
Received September 27, 2018; accepted November 28, 2018.
ABSTRACT
Despite the level of interest surrounding mission statements and their internalization in organizations, there is a lack of a valid construct to measure the sense of mission in organizational climate surveys. The aim of this exploratory study is to define and validate an instrument to assess the perception of the implementation of the mission in everyday routines. A sample of 132 employees from two companies completed the questionnaire to probe the scale’s reliability and validity. A principal components analyses (PCAs) were conducted, taking the three dimensions separately. Later, a confirmatory analysis of the entire scale, which was a factor analysis using structural equation modelling (SEM) techniques, taking into accounts the three aforementioned dimensions. The scale is composed of ten items arranged in three dimensions: sensemaking of the mission, employee mission engagement, and organizational alignment. These scales provide clues to human resources managers about how to define and implement the mission to ensure that it will be interiorized by all members of the company. This new scale provides scholars with a comprehensive way to measure and assess the presence of the mission in the organizational climate and provides human resources managers with a useful kit to apply within their organizations.
KEYWORDS
2
1.
Introduction
While managers pay ample attention to determining the correct strategy for the company, they often lack a basic understanding of the perceptions, feelings and attitudes of their employees (measured by the organizational climate). This ignorance frequently provokes organizations to lose effectiveness and motivation in their employees, who are their most valuable resource. Therefore, it is relevant for organizations to measure and understand the organizational climate to effectively apply human resource development policies and practices.
Actually, some pioneering studies introduced and developed the organizational climate concept in the 1960s (Likert, 1967 & Kaczka & Kirk, 1968). According to Hellriegel & Slocum (1974), the organizational climate refers to “a set of attributes which can be perceived about a particular organization and/or its subsystems, and that may be induced from the way that organization and its subsystems deal with their members and
environment”. The more recent definition of Patterson et al. (2005) considered the climate
to be “employees’ perceptions of their organizations”. The psychological climate is referred to as an individual level of analysis, but most recent research focuses on the aggregate level (departmental or organizational climate constructs).
In sum, the organizational climate refers to a set of characteristics that can be perceived about a specific company. It shows the employees’ shared perceptions of their work environment. Many previous studies have worked to conceptualize, measure, and use organizational climate constructs. There have been several different data-based studies published in important journals to identify the appropriate construct for climate surveys (Litwin & Stringer, 1968; Payney et al., 1976; O'Sullivan, 2007; Thumin & Thumin, 2011, among others) and its relationship with other constructs, such as that of McMurray et al. (2004), who studied the relationship between organizational commitment and organizational climate. Additionally, other studies have focused on some aspects of the climate instrument, such as the ‘Transfer Climate Instrument’ of Holton et al. (1997) and
the ‘Open Innovation Climate Measure’ of Remneland‐Wikhamn & Wikhamn (2011).
However, after a literature review, there are few well-validated measures that consider mission statement aspects (Payne et al. 1992 or Patterson et al., 2005, among others). For
3 related to the mission statement; however, no previous studies have focused on the employees’ perceptions of the mission deployment in their regular activities.
Indeed, one cannot forget that the mission becomes visible to employees in different ways. The mission statement is just a declaration of the organization’s reason for being, revealing what it wants to be and who it wants to serve (David, 1989; Bart, 2001), but the sense of mission is something different. The sense of mission is commonly understood as the employees’ commitment to the company’s mission (Campbell & Yeung, 1991; Davies & Glaister, 1997; Baetz & Kenneth, 1998; Bart et al., 2001). This commitment is necessary to fuel a real effect on employee behavior (Bart et al., 2001); on the other hand, without this commitment, defining a mission can even be counterproductive (Ireland & Hitt, 1992).
Currently, there is a need to measure the organizational climate while keeping in mind the employees’ sense of mission. Therefore, the objective of this paper is to present and validate a scale composed of three dimensions (sensemaking of the mission, employee mission engagement, and organizational alignment) to propose an integral approach to measuring the organizational climate. This measurement is theoretically grounded and empirically validated in a new mission-based managing framework. Our paper demonstrates the usefulness and adequacy of our climate measures in terms of reliability and discriminant and external validity. This new scale offers researchers and practitioners an original approach to evaluate the organizational climate from the point of view of the mission statement. We hope that human resource managers will improve their policies and practices toward the better development of their employees.
4
2.
Organizational climate measures
The first publication about the concept of climate and the relevance of measuring the climate construct was published in the early 1960s (e.g., McGregor, 1960; Litwin & Stringer, 1968). One of the best known definitions of organizational climate comes from Reichers & Schneider (1990), who defined it as the shared perceptions of employees concerning the practices, procedures, and behaviors that are rewarded and supported in a work setting. More recently, Hong & Kaur (2008) defined organizational climate as the
global impression of one’s organization and the personal impact of the work environment,
which influence the individual’s work behaviors and job-related attitudes.
According to Neal et al. (2000), the psychological climate refers to individual perceptions of organizational attributes, practices, and procedures. When these evaluations are shared by numerous people within a firm, they are referred to as the organizational climate. As Patterson et al. (2005) state, most empirical studies have applied an aggregate unit of analysis, and now general research focuses on aggregate rather than physiological climates. Therefore, this research proposes a scale measurement of organizational climate that takes into account the employees’ perceptions about the mission’s implementation in the management of the company. We are particularly interested in the way that the mission inspires the employees’ behaviors.
At this point, describing the relationship between climate and culture is required because they are close concepts and might lead to some misunderstandings. James et al. (2008) suggest that climate is behaviorally oriented and represents the patterns of behavior of something specific (e.g., safety or services). Meanwhile, organizational culture refers to when employees are asked why this pattern exists. According to Svyantek & Bott (2004), organizational culture is a set of shared values and norms held by employees that guide their interactions with peers, management, and customers. In contrast, the organizational climate is more behaviorally oriented; in other words, the climate for innovation, safety, or service is the surface manifestation of culture.
5 variety in terms of the type of dimensions. Moreover, no mission-related dimension is found.
Author(s) and Year Climate denomination Climate dimensions Litwin and Stringer
(1968)
Organizational Climate Questionnaire
Campbell et al. (1974)
1. Individual autonomy; 2. Degree of structure imposed on the situation; 3. Reward orientation; 4. Consideration, warmth and support.
James et al. (1981) 1. Role stress and lack of harmony; 2. Job challenges and autonomy; 3. Leadership facilitation and support; 4. Work groups, cooperation, friendliness and warmth.
Glick (1985) 1. Leader’s psychological distance; 2. Managerial trust and consideration; 3. Communication flow; 4. Open-mindedness, 5. Risk orientation; 6. Service quality; 7. Equity; 8. Centrality.
Koys & deCotiis (1991)
1. Autonomy; 2. Cohesion; 3. Trust; 4. Pressure; 5. Support; 6. Recognition; 7. Impartiality; 8. Innovation.
Payne et al. (1992) Business Organization Climate Index:
1. Customer service; 2. Impact of information quality; 3. Ability to manage culture.
Patterson et al. (2005)
Organizational Climate Measure (OCM):
1. Autonomy; 2. Integration; 3. Involvement; 4. Supervisory Support; 5. Training; 6. Welfare; 7. Formalization; 8. Tradition; 9. Innovation and Flexibility; 10. Clarity of Organizational Goals; 11. Efficiency; 12. Effort; 13 Performance Feedback; 14. Pressure to Produce; 15. Quality.
Thrush et al. (2007) Organizational Climate for Research Integrity (OCRI) Survey: (64 survey items):
1. Organizational inputs; 2. Structures; 3. Processes; 4. Outcomes. Thumin & Thumin
(2011)
Survey of Organizational Climate.
Suarez et al. (2013) Organizational Climate Scale (CLIOR): One-dimension construct (50 items)
Table 1. Some organizational climate measures and their dimensions.
There is a pressing need for well-grounded measures of the level of the mission’s implementation in companies. Therefore, this study seeks to partially bridge this gap by suggesting a measure of the sense of mission climate. Measuring certain aspects of the organizational climate can reveal some improvements to help successfully internalize the mission and hence improve the alignment of the people’s behaviors regarding the
mission’s values. The internalization of the mission refers to the way in which employees
6
3.
Measurement of the Mission Organizational Climate
According to previous studies in this field (Bart et al, 2001; Suh et al., 2011; Wang, 2011; among others), we propose three dimensions related to different aspects of the sense of mission in companies: (1) sensemaking of the mission, (2) employee mission engagement, and (3) organizational alignment.
Sensemaking of the mission
In recent decades, many companies have conducted the exercise of defining institutional principles or mission statements. These principles, commonly defined under headings such as mission, vision, values, credo, and philosophy (Abrahams, 1999; Leuthesser & Kohli, 1997, Blair Loy et al., 2011) capture an organization’s ‘reason for being’ and identity (Wang, 2011). The mission considers the organizational purpose and enables the sensemaking of the business and its processes and practices. These statements are of great relevance to the company, as they facilitate consistency in the definition and implementation of its strategy (Drucker, 1974; Ireland & Hitt, 1992; George, 2001; Vasconcellos e Sá et al., 2011). They are also a source of motivation and emotional security for employees (Kanter, 2009; Rey & Mas, 2013) and sometimes have an impact on the performance of the company (Bart et al., 2001; Desmidt et al., 2011).
However, publishing the mission and values on a website or hanging up posters around the office is one thing; getting employees to truly internalize these principles is quite another (Campbell & Nash, 1992). To increase the mission sensemaking (hereafter, SM), many companies put great effort into carrying out communication actions. However, quite often, these initiatives do no produce the expected results (Bart, 1997; Bart and Baetz, 1998; Bartkus & Glassman, 2008). To stimulate employees to truly understand the mission, we need a combination of various types of communication actions, which integrate the mission into everyday practices and into the reality of company employees. Following the sensemaking theory of communication, sensemaking is crucial because it is the principal site where meanings emerge that inform and limit identity and action to human behavior (Weick et al., 2005). According to Wang (2011), the SM of the
management philosophy is ‘the process through which individuals develop cognitive
maps of the management philosophy’. Therefore, SM is related to the process through
7 how to act to incorporate these concepts. Therefore, SM is the first step in really knowing how to put the mission into practice and to achieve the company mission (Wang, 2011). To expand their knowledge of the mission and to encourage its internalization throughout an organization, employees must have explicit knowledge of the mission’s content (Nonaka, 1994) to the extent that they are able to explain the mission in their own words (Wang, 2011). In fact, although implicit or tacit knowledge of the mission is an option (Nonaka & Tokoyama, 2003), several studies advise that the mission be formally communicated by members of the organization (Hirota et al., 2010), with special attention paid to the denotative and connotative aspects of the message (Cochran et al., 2008). The denotative aspect refers to the correct interpretation of the meaning of the message, and the connotative aspect refers to the feelings and emotions that emerge in the process of its transmission.
If there is no explicit knowledge of the mission or if it is poorly communicated, the general result will be a lack of awareness or ambiguous or contradictory messages. For this reason, the informative communication of the mission should be an initial step to ensure that employees know the content of the mission and are able to explain it in their own words. To sum up, to know and understand the company’s mission statement is a basic state for a mission-driven organization.
Employee Mission Engagement
In the past two decades, there has been a great deal of interest in employee engagement in organizations. However, there has been little academic and empirical research on this popular topic (Robinson et al., 2004). Employee engagement refers to the individual’s involvement and satisfaction with the company as well as his or her enthusiasm for work (Harter et al., 2002). According to Maslach et al. (2008), engagement is related to involvement, energy, and efficacy—the direct opposite of burnout. In the academic literature, engagement is said to be related to but distinct from other constructs in organizational behavior, such as organizational commitment or job involvement. According to Saks (2006), we can consider employee engagement as “a unique construct that consist of cognitive, emotional, and behavioral components that are associated with
individual role performance”. Macey & Schneider (2008) state that employee
8
Following to Suh et al. (2011), employee engagement can be adopted in mission statement literature. They define employee mission engagement (hereafter, EME) as ‘a psychological state in which an employee desires to exert effort and devote careful attention to ensure the fulfillment of a mission that he or she perceives as significant or
meaningful’.
Previous studies have highlighted the motivational nature of the EME concept (Saks, 2006). Employee motivation is one of the main reasons that an organization should define its mission statement (Bart et al., 2001; Ireland & Hitt, 1992; Campbell & Yeung, 1991; Klemm et al., 1991). Previous studies have proposed a relationship between employees’ motivations and mission statements, for instance, in the public sector (Wright 2007) or in non-profit organizations (Kirk, 2010). However, other researchers have suggested that a mission that is truly interiorized and fulfilled within a company instills a strong capacity to contribute to something or to someone, constituting a source of prosocial motivations (Wang, 2011, Mas & Rey, 2013). The potential of this type of motivation (prosocial motivation based on mission statements) is reflected in the concept of EME. Moreover,
central to the motivational nature of EME is the notion of an employee’s willingness to
invest personal effort and attention to fulfill the mission (Salanova et al., 2005). Therefore, employees with high EME tend to commit to and continue to work toward firm goals. This is an important concept to measure within a climate survey.
Mission-organizational alignment
In recent decades, several authors have submitted proposals on how to define a mission (Lundberg, 1984; Cochran et al., 2008 Jones & Kahaner, 1995; Collins & Porras, 1996; Abrahams, 1999; Levin, 2000) and to ensure the alignment of the mission and the
company’s processes and systems (Bart et al., 2001; Crotts, 2005; Cardona & Rey, 2008).
In practice, the mission is implemented from a communicative perspective (Williams, 2008), but it frequently is not integrated into the strategy and management systems that govern day-to-day organization (Bart, 1997). Therefore, companies that already work with the mission must have and use a number of tools to help effectively manage the company's mission.
The company’s mission should be present in the knowledge and information possessed
9 all aspects of the company. It is therefore important to align the company’s management systems with its mission (Drucker, 1974; Pearce, 1982; Campbell & Nash, 1992; Hirota et al. 2010.).
According to Bart et al. (2001), management systems and processes must be aligned with strategy to achieve a successful mission. When managers design and plan their management systems, they have to align them with their mission statements. Therefore, it is important to consider this variable to measure the influence of the mission in the company’s daily decisions and management processes. A real and active mission must be present in the company’s management systems and decisions, such as budgets, recruitment, planning and employee assessments or rewards (Williams et al., 2014). On the other hand, to enhance their commitment to the mission, employees need to believe that the organization’s decisions and practices are aligned with its mission (Bart, 2001; Cardona & Rey, 2008; Suh et al., 2010). This aspect is especially relevant when a mission is tested, which may occur, for example, if a company faces the need for layoffs or a client’s costly claim (Jones & Kahaner, 1995). The way that the company acts in these situations, and, more importantly, how this performance is perceived by its employees, is essential for the development of true mission internalization (Campbell & Yeung, 1991; Jones & Kahaner, 1995; Collins & Porras, 1994). If employees do not
perceive coherence between a company’s policies and its practices, the mission will
gradually lose its credibility. Such a credibility loss may occur due to a lack of coherence or due to ignorance or poor communication, especially among employees who have limited visibility and access to information about the company’s general operations. Therefore, the company must frequently carry out actions to present how the organization manifests its commitment to the mission through evidence, tools, events and company decisions. Such actions promote the employees’ awareness of how the company’s everyday practices are coherent manifestations of the practical applications of the
company’s institutional principles.
In this study, the label used for mission-organizational alignment is OA.
4.
Method and results
10
A series of meetings with the managers of two companies was conducted to explain the aims of this study. Established in Spain, the first company is a market leader in spare auto parts distribution that now operates in Europe. This company has worked intensively on mission-based management for more than seven years. The second company operates internationally in engineering construction activities, and its headquarters is located in South America. This company has defined its mission statement and has tried to be a mission-driven organization. Before the questionnaire was launched, some pilot managers completed it and suggested some changes to enhance its understanding. Five managers from different companies agreed to participate in the definition and assessment of the questionnaire.
The questionnaire included a section to collect 10 items to assess the constructs explained before. These items were based on previous quantitative studies of the mission statement literature. All of them were measured on a five-point Likert scale. In the last section, the
respondents’ socio-demographic information was collected.
The survey was launched in January 2015, and 156 questionnaires were collected, from which only 132 were retained for our analysis (61 from the first company and 71 from the second company).
The data were analyzed in a two-step process. First, any array of three principal components analyses (PCAs) were conducted, taking the three dimensions separately. The unidimensionality construct was proved. The second step was the confirmatory analysis of the entire scale, which was a factor analysis using structural equation modelling (SEM) techniques, taking into account the three aforementioned dimensions. The 6.2 EQS software was used.
Assessing the three dimensions
11
Dimension KMO
Bartlett’s test of sphericity
χ2 Degrees of
freedom Significance
SM 0.710 14.297 3 0.000
EME 0.679 98.722 3 0.000
OA 0.790 169.492 6 0.000
Table 2. KMO indices and Bartlett’s test of sphericity for the three dimensions.
Consequently, the three EFAs (through CFA) were conducted. Table 3 shows the loading factors for each item, proving the individual consistency of the items (0.767 – 0.885). The reliability (internal consistency) of the dimensions is confirmed by the Cronbach’s alphas and the composite reliability (CR), all above 0.7 or near this threshold (Hair et al., 2006). When the state of art is still not consolidated, as is the case when an exploratory analysis is performed, these thresholds can be relaxed to 0.6 (Malhotra, 2004). In addition, the variance extracted for each scale was greater than 0.5.
Scale adapted from Items Loads
Sensemaking of the mission
(Wang, 2011)
Cronbach’s α: 0.820
CR: 0.894 AVE: 0.738
SM1 I could make sense of my company’s mission
very well. 0.840
SM2 I am able to interpret my company’s mission
in my own words. 0.885
SM3 I can explain the mission to people outside
the company if required. 0.852
Employee mission engagement
(Suh et al. 2010)
Cronbach’s alpha:
0.746 CR: 0.862 AVE: 0.676
EME1 I am motivated by the mission to do my work. 0.789 EME2 I work hard to ensure X is successful in
carrying out our mission. 0.818
EME3 I carry out the mission when I do my work
well. 0.859
Organizational Alignment (Bart el al. 2001)
Cronbach’s alpha:
0.808 CR: 0.877 AVE: 0.642
OA1
To what extent is your current mission statement taken into account when setting up and managing your firm's operating planning system?
0.811
AO2
To what extent is your current mission statement taken into account when setting up and managing your firm's budgeting system?
0.767
OA3
To what extent is your current mission statement taken into account when setting up and managing your firm's performance evaluation criteria?
12
OA4
To what extent is your current mission statement taken into account when setting up and managing your firm's system of rewards?
0.796 Table 3. Reliability analysis for the three constructs.
Discriminant validity was analyzed using the linear correlations or standardized covariances between latent factors by examining whether inter-factor correlations were less than the square root of the average variance extracted (AVE). Table 4 shows that the square roots of each AVE were greater than the off-diagonal elements. Discriminant validity was guaranteed.
SM EME OA
SM 0.859
EME 0.425 0.812
OA 0.375 0.525 0.801
Diagonal elements are the square roots of average extracted (AVE). Table 4. Correlation matrices of the three dimensions.
Confirmatory factor analysis for the entire scale
Once the unidimensionality for each dimension was assessed, the second step of the analysis was lunched. It consisted of a confirmatory factor analysis with the 10 items from the three dimensions.
The model was estimated using the robust maximum likelihood method from the asymptotic variance–covariance matrix. The fit indices obtained in the measurement model estimation showed that the variables converged towards the factors established in
the CFA (see Table 5). χ2 Satorra–Bentler was 57.84, with 32 degrees of freedom and a
p-value of 0.00341. χ2/df was 1.81, which was below the acceptable limit of 5. RMSEA
was 0.079, and the comparative fit index (CFI) was 0.915. Bollen's (IFI) fit index was 0.919, and McDonald's (MFI) fit index was 0.907. Being cautious about the significance
of the robust χ2 statistic and noting the global indicators, the global fit was acceptable.
13
Dimension Items Load t-value r2
SM
SM1 0.787 - 0.619
SM2 0.805 9.250 0.648
SM3 0.745 7.477 0.554
EME
EME1 0.640 - 0.409
EME2 0.746 5.795 0.557
EME3 0.770 7.044 0.593
OA
OA1 0.766 - 0.587
AO2 0.666 6.731 0.443
OA3 0.760 7.602 0.578
OA4 0.701 6.949 0.491
Table 5. Confirmatory factor analysis for the climate scale.
To proceed to a benchmarking exercise between the two companies, the aggregated responses on a scale from 1 to 5 were calculated for each dimension (figure 2). The first company scored higher in the three dimensions. It was expected that the company that scored better in one dimension would also score better in the other two dimensions because of the correlations among them. The findings show better results for the first company because it is a company that has been working since 2008 to implement mission-based management via the policies and practices within the company.
In addition, a multiple group analysis among the two companies has been performed to test the invariance of the correlations of the dimensions across the two companies. The
data fit reasonably: the scaled χ2 Satorra–Bentler was 88.31, with 67 degrees of freedom
14
Figure 1. A comparison of the mission climate indices of the two companies.
5.
Discussion and managerial implications
Successful organizations understand the needs and attitudes of their employees and seek to develop their capabilities. Human resource managers try to create a positive environment where people can work happily and feel that what they do contributes to some personal aims through their engagement with the mission values. Consequently, the company’s performance indicators improve alongside the empowerment of their employees. To assess the fit between personal values and the mission, organizational climate surveys are a powerful tool. The results of these surveys also provide a basis for effective action planning for employee development and organizational change. The climate survey is an important tool to help organizations understand their employees’ perceptions of their working environment. The proposed scale can assess the different dimensions that affect people’s behaviors. Although the working environment in organizations is a topic studied by different authors, it has not been addressed from the perspective of the company’s mission. Organizations’ mission statements are basic starting points that will enable the development and implementation of corporate strategies. In this sense, having indicators that measure the degree of the mission’s internalization, the level of based motivation and the effectiveness of mission-derived management tools is important and useful for making management decisions. The proposed scale includes three dimensions. The first one (consisting of three items) captures the knowledge of the mission and the sense of this particular mission, which is
005 005 005
004 004
004
001 002 003 004 005
SM EME OA
15 employees’ first step in internalizing the mission; hence, it is a starting point for assessing the climate. This first dimension provides an answer to “what” the mission in this company is and to what extent the employee knows it. It is not enough to have only superficial knowledge of the mission; it must be fully understood to the point that every employee is able to explain it (Nonaka & Tokoyama, 2003, Cochran et al., 2008, Hirota et al., 2010).
The second dimension (employee mission engagement) relates to the employees’ motivation to feel that they are contributing while they stick to the mission. It provides an answer for “why” an employee should work at this company, which has this explicit statement mission. This dimension is assessed using three items. What are the values that make the employee adhere to the mission and hence feel that it is worth working at this company? This is the conceptualization of the second dimension.
It is not enough to simply know the mission statement (the first dimension); the mission has to motivate employees (the second dimension), and it should be aligned with the company’s management (the third dimension). This third dimension ensures that the management system and processes enable the accomplishment of the mission statement. This last dimension is assessed using four items. To strengthen commitment within the company, employees must believe that the day-to-day decisions are aligned with the mission. Consequently, employees know the reward deserved according to their behaviors. Employees thus have to assess the alignment between actual personal work and the mission statement. Such assessments provide feedback to the employees, which helps them know how their work is valued; hence, they can make any necessary adjustments.
16
REFERENCES
Abrahams, J. (1999). The mission statement book: 301 corporate mission statements from America's top companies. Berkeley, CA: Ten Speed Press.
Baetz, B., & Kenneth, C. (1998). The relationship between mission statements and firm performance: An exploratory study. Journal of Management Studies, 35(6), 823-853. Bart, C. (1997). Sex, lies and mission statements. Business Horizons, 40(6), 9-18. Bart, C. & Baetz. M. (1998). The relationship between mission statements and firm performance: an exploratory study. Journal of Management Studies, 35(6), 823-853. Bart, C. K. (2001). Measuring the mission effect in human intellectual capital. Journal of Intellectual Capital, 2(3), 320-330.
Bart, C. K., Bontis, N., & Taggar, S. (2001). A model of the impact of mission statements on firm performance. Management Decision, 39(1), 19-35.
Bartkus, B. R., and Glassman, M. (2008). Do firms practice what they preach? The relationship between mission statements and stakeholder management. Journal of Business Ethics, 83(2), 207-216.
Blair-Loy, M., Wharton, A. S., & Goodstein, J. (2011). Exploring the relationship between mission statements and work-life practices in organizations. Organization Studies, 32(3), 427-450.
Campbell, A., & Nash, L. L. (1992). A sense of mission: Defining direction for the large corporation. Addison-Wesley Longman.
Campbell, A., & Yeung, S. (1991). Creating a sense of mission. Long range planning, 24(4), 10-20.
Campbell, J. P., Bownas, D. A., Peterson, N. G., & Dunnette, M. D. (1974). The measurement of organizational effectiveness: A review of relevant research and opinion. Personnel decisions research inst minneapolis MN.
Cardona, P., & Rey, C. (2008). Management by missions. Palgrave Macmillan.
Cochran, D. S., David, F. R., & Gibson, C. K. (2008). A framework for developing an effective mission statement. Journal of Business strategies, 25(2), 27.
Collins, J. C., & Porras, J. I. (1996). Building your company's vision. Harvard business review, 74(5), 65.
17 Davies, S. W., & Glaister, K. W. (1997). Business school mission statements—the bland leading the bland? Long Range Planning, 30(4), 481-604.
Desmidt, S., Prinzie, A., & Decramer, A. (2011). Looking for the value of mission statements: a meta-analysis of 20 years of research. Management Decision, 49(3), 468-483.
Drucker, P. (1974). Management: tasks. responsibilities. Practices, New York: Harper and Row .
Glick, W. H. (1985). Conceptualizing and measuring organizational and psychological climate: Pitfalls in multilevel research. Academy of Management Review, 10(3), 601-616. Hair, J. F., Black, W. C., Babin, B. J., Anderson, R. E., & Tatham, R. L. (2006). Multivariate data analysis (Vol. 6). Upper Saddle River, NJ: Pearson Prentice Hall. Harter, J. K., Schmidt, F. L., & Hayes, T. L. (2002). Business-unit-level relationship between employee satisfaction, employee engagement, and business outcomes: a meta-analysis. Journal of Applied Psychology, 87(2), 268.
Hellriegel, D., & Slocum, J. W. (1974). Organizational climate: Measures, research and contingencies. Academy of Management Journal, 17(2), 255-280.
Hirota, S., Kubo, K., Miyajima, H., Hong, P., & Won Park, Y. (2010). Corporate mission, corporate policies and business outcomes: evidence from Japan. Management Decision, 48(7), 1134-1153.
Holton, E. F., Bates, R. A., Seyler, D. L., & Carvalho, M. B. (1997). Toward construct validation of a transfer climate instrument. Human Resource Development Quarterly, 8(2), 95-113.
Hong, L. C., & Kaur, S. (2008). A relationship between organizational climate, employee personality and intention to leave. International Review of Business Research Papers, 4(3), 1-10.
Ireland, R. D., & Hitt, M. A. (1992). Mission statements: Importance, challenge, and recommendations for development. Business Horizons, 35(3), 34-42.
James, L. R., & Sells, S. B. (1981). Psychological climate: Theoretical perspectives and empirical research. Toward a psychology of situations: An interactional perspective, 275-295.
James, L. R., Choi, C. C., Ko, C. H. E., McNeil, P. K., Minton, M. K., Wright, M. A., & Jones, P., & Kahaner, L. (1995). Say It and Live It: Fifty Corporate Mission Statements That Hit the Mark.
18
Kim, K. I. (2008). Organizational and psychological climate: A review of theory and research. European Journal of Work and Organizational Psychology, 17(1), 5-32. Kirk, G., & Beth Nolan, S. (2010). Nonprofit mission statement focus and financial performance. Nonprofit Management and Leadership, 20(4), 473-490.
Klemm, M., Sanderson, S., & Luffman, G. (1991). Mission statements: selling corporate values to employees. Long Range Planning, 24(3), 73-78.
Koys, D. J., & DeCotiis, T. A. (1991). Inductive measures of psychological climate. Human Relations, 44(3), 265-285.
Leuthesser, L., & Kohli, C. (1997). Corporate identity: The role of mission statements. Business Horizons, 40(3), 59-66.
Levin, J. S. (2000). The revised institution: The community college mission at the end of the twentieth century. Community College Review, 28(2), 1-25.
Likert, R. (1967). The human organization: its management and values.
Litwin, G. H., & Stringer Jr, R. A. (1968). Motivation and organizational climate. Lundberg, C. C. (1984). Zero-in: A Technique for formulating better mission statements. Business Horizons, 27(5), 30-33.
Macey, W. H., & Schneider, B. (2008). The meaning of employee engagement. Industrial and organizational psychology, 1(1), 3-30.
Malhotra, N. K. (2004). Marketing research and applied orientation (4th ed.). Upper Saddle River, NJ: Prentice-Hall.
Maslach, C., & Leiter, M. P. (2008). Early predictors of job burnout and engagement. Journal of applied psychology, 93(3), 498.
McGregor, D. (1960). The human side of enterprise. New York, 21, 166.
McMurray, A. J., Scott, D. R., & Pace, R. W. (2004). The relationship between organizational commitment and organizational climate in manufacturing. Human Resource Development Quarterly, 15(4), 473-488.
Neal, A., Griffin, M. A., & Hart, P. M. (2000). The impact of organizational climate on safety climate and individual behavior. Safety science, 34(1), 99-109.
Nonaka, I. (1994). A dynamic theory of organizational knowledge creation. Organization science, 5(1), 14-37.
19 O'Sullivan, P. S. (2007). Content validation of the organizational climate for research integrity (OCRI) survey. Journal of Empirical Research on Human Research Ethics, 2(4), 35-52.
Patterson, M. G., West, M. A., Shackleton, V. J., Dawson, J. F., Lawthom, R., Maitlis, S., ... & Wallace, A. M. (2005). Validating the organizational climate measure: links to managerial practices, productivity and innovation. Journal of organizational behavior, 26(4), 379-408.
Payne, R. L., Fineman, S., & Wall, T. D. (1976). Organizational climate and job satisfaction: A conceptual synthesis. Organizational Behavior and Human Performance, 16(1), 45-62.
Payne, R., Brown, A. D., & Gaston, K. (1991). Reliability and validity of an updated version of the Business Organisation Climate Index (BOCI). Manchester Business School.
Pearce, J. A. (1982). The company mission as a strategic tool. Sloan management review, 23(3), 15-24.
Reichers, A. E., & Schneider, B. (1990). Climate and culture: An evolution of constructs. Organizational climate and culture, 1, 5-39.
Remneland‐Wikhamn, B., & Wikhamn, W. (2011). Open Innovation Climate Measure: The Introduction of a Validated Scale. Creativity and Innovation Management, 20(4), 284-295.
Rey, C. & Mas, M. (2013) “Mission based motivation: Relationship with extrinsic and
intrinsic motivation”. GIKA, Global Innovation and Knowledge Academy.
Robinson, D., Perryman, S., & Hayday, S. (2004). The drivers of employee engagement. Report-Institute for Employment Studies.
Saks, A. M. (2006). Antecedents and consequences of employee engagement. Journal of Managerial Psychology, 21(7), 600-619.
Salanova, M., Agut, S., & Peiro, J. M. (2005). Linking organizational resources and work engagement to employee performance and customer loyalty: the mediation of service climate. Journal of Applied Psychology, 90(6), 1217.
Suárez, E. P., Fernández, J. M., Alvarez, A. C., Pedrero, E. F., & Cueto, E. G. (2013). Assessing organizational climate: Psychometric properties of the CLIOR Scale. Psicothema, 25(1), 137-144.
20
Svyantek, D. J., & Bott, J. P. (2004). Organizational culture and organizational climate measures: an integrative review. Comprehensive handbook of psychological assessment: Industrial and Organizational Assessment, 4, 507-524.
Thrush, C. R., Vander Putten, J., Rapp, C. G., Pearson, L. C., Berry, K. S., &
Thumin, F. J., & Thumin, L. J. (2011). The measurement and interpretation of organizational climate. The Journal of Psychology, 145(2), 93-109.
Vasconcellos e Sá, J. A., Olão, F., & Pereira, M. (2011). From Levitt to the global age: one more time, how do we define our business?. Management Decision, 49(1), 99-115. Wang, Y. (2011). Mission-driven organizations in Japan: Management philosophy and individual outcomes. Journal of Business Ethics, 101(1), 111-126.
Weick, K. E., Sutcliffe, K. M., & Obstfeld, D. (2005). Organizing and the process of sensemaking. Organization Science, 16(4), 409-421.
Williams Jr, R., L. Morrell, D., & V. Mullane, J. (2014). Reinvigorating the mission statement through top management commitment. Management Decision, 52(3), 446-459. Williams, L. S. (2008). The mission statement A corporate reporting tool with a past, present, and future. Journal of Business Communication, 45(2), 94-119.
EUROPEAN ACCOUNTING AND MANAGEMENT REVIEW
VOLUME 5, ISSUE 1, ARTICLE 2, 21-46, NOVEMBER 2018
Value Creation and Women on Boards
Bettina C.K. Binder Hochschule Pforzheim
Received September 8, 2018; accepted October 26, 2018.
ABSTRACT
Value creation is a major claim of most companies. Mahajan (2017) argues that “value
and value creation are natural to and basic in human behaviour and endeavour”,
nevertheless women are often marginalized and impeded in their advancement towards
leadership positions, where they could shape and influence the process of value creation.
The present article looks at the companies of EURO STOXX 50 index in the year 2015
and offers an overview of women representation on the boards of these 50 companies.
The paper tries to establish whether the success of these companies can be related to the
percentage of female members in supervisory positions. The findings reveal the existence
of a weak correlation between Earning before Taxes (EBT) and the proportion of women
on the boards of the EURO STOXX 50 companies.
KEYWORDS
Value creation, women on supervisory boards, key performance indicators, gender quota,
22
1.
Introduction
Value creation is a major claim of most companies and when leafing through the annual
reports of companies one encounters expressions such as “value to our shareholders”, “we
provide value for our customers”, “we create value for our employees, shareholders,
business partners, neighbours and the public”, etc. While it seems to be clear for whom
value is created, the concept of “value” itself is subjected to various interpretations and is
regarded in the literature as ambiguous (Lepak, Smith and Taylor, 2007; Marinova, Larimo
and Nummela, 2017). Mahajan (2017) argues that “value and value creation are natural to
and basic in human behaviour and endeavour”, nevertheless women are often marginalized
and impeded in their advancement towards leadership positions, where they could shape
and influence the process of value creation. The urge to better use the talent pool
represented by women was voiced by many actors: OECD (2016) for example emphasized
that women “can provide society with different perspectives and approaches to
management, organisation and business issues”. In order to change the organizational
culture of all-male boards, positive actions such as gender quotas were introduced in many
European countries.
The present paper looks at the companies of EURO STOXX 50 index in the year 2015 and
offers an overview of women representation on the boards of these 50 companies, the
index being described as a “Blue-chip representation of supersector leaders in the
Eurozone” (stoxx.com). The paper tries to establish whether the success of these
companies can be related to the percentage of female members in supervisory positions.
The findings reveal the existence of a weak correlation between Earning before Taxes
(EBT) and the proportion of women on the boards of the EURO STOXX 50 companies.
This paper replicates the study of Binder, Alonso-Almeida and Bremser (2016) which
analysed the relationship between female’s representation in the management board
(executive board) and firm performance (measured by EBT) of the EURO STOXX 50
companies in 2014.
The author of this paper deems the presence of women on corporate boards as valuable in
itself and argues that images such as the “white, heterosexual, western, middle/upper class,
23
2.
Value creation in annual reports
The centrality of value creation is uncontestable for companies and management and
organizational scholars alike. While agreeing that “there is little consensus on what value
creation is or on how it can be achieved” (Lepak, Smith, Taylor, 2007, p. 180) this paper
does not seek to coin a new definition of value creation. It examines companies’
understanding of the world “value” and “value creation”, it presents shortly the
management approach which places value creation at the core of a company’s strategy,
namely value-based management (VBM), and it focuses on the presence of women in
supervisory board by trying to establish whether there is a relationship between the
percentage of women on board and companies’ performance as measured by earnings
before taxes (EBT). Before embarking on the quest of finding the meanings of “value” and
“value creation” as understood by the companies of EURO STOXX 50 index, it is,
however, important to adopt a definition of value creation from the existing body of
literature.
Value is seen to positivly impact the stakeholders, employees, cusomers, partners and
CEOs, society, companies and shareholders (Mahajan, 2016). The author acknowledges
the significance of the monetary component of value creation, as it becomes apparent also
from the definition offered by Lepak, Smith and Taylor: “value creation depends on the
relative amount of value that is subjectively realized by a target user (or buyer) who is the
focus of value creation – whether individual, organization, or society – and that this
subjective value realization must at least translate into the user’s willingness to exchange
a monetary amount for the value received” (2007, p. 182). Value destruction should be
avoided by the CEO by focussing on the customer and using financial and non-financial
assets and measures (Mahajan, 2016, p. 69).
The paper draws on existing literature in the field of key performance indicators (KPIs),
diversity management, women quota and supervisory boards and it is structured as
follows: in a first step, value and value creation is described on the basis of the annual
reports of the 50 EURO STOXX companies. By reading the annual reports it also became
evident, that some of the companies employ the value-based management approach, and
therefore, one section is dedicated to this aspect. In a second step the presence of women
on the supervisory board as a relevant resource is examined and here evidence from
literature is brought into light. Finally, a correlation analysis is conducted in order to see,
24
financial performance of the companies under scrutiny. The last sections is dedicated to
the findings and it also shows the limitations of this study and offers suggestions for future
research.
Most of the companies of the EURO STOXX 50 index use in their annual reports the word
“value”, be it in the sense of monetary worth, importance in the eyes of someone, or
principle or belief. The Belgian company Anheuser-Busch InBev for instance employs the
word “value” in the following contexts: “The total transaction is valued at 12 billion US
dollar and is conditional on completion of the Combination” (Anheuser-Busch InBev,
2015, p. 2).
The French company Essilor states strongly to have five values, which are “expressed
every day in the way teams around the world work together” (Essilor, 2015, p. 59). These
values are respect and trust, diversity, entrepreneurial spirit, working together and
innovation (Essilor, 2015, p. 61).
Airbus focuses on delivering value for shareholders as in “value to our shareholders
through our share buybacks, with an additional €1 billion launched in October 2015”
(Airbus Group, 2015, p. 19). Airbus also claims to “recognize the value that diversity
brings” and therefore “is committed to advancing women in the workplace and developing
female talent” (Airbus Group, 2015, p. 26). This claim is, however, doubtful: Denis
Ranque, the chairman of the board, speaks about the existence of a “more appropriate level
of gender diversity”, though as of 1st January 2016, there were two women on the board
of directors of Airbus.
Moreover, it has to be pointed out that there is often a tendency of using words in a loose
or even misleading manner. Fresenius for example had at the end of 2015 an all-male
supervisory board, being actually the only company of the EURO STOXX 50 index in this
situation. Yet, in its annual report it is mentioned that “Fresenius values a culture of
diversity1. The interplay of a wide range of views, opinions, cultural backgrounds,
experiences, and values help us to achieve our full potential and contributes to our success”
(Fresenius, 2015, p. 27).
Other companies of the EURO STOXX 50 index claim in their annual reports to being
committed to value creation. Nokia states for example the following: “We aim for all our
25 business groups to be innovation leaders, drawing on our frontline R&D capabilities to
deliver leading products and services for our customers, and ultimately ensure the
company’s long-term value creation” (Nokia, 2015, p. 40).
Social and economic value creation is the aim of the Spanish company Inditex (Industria
de Diseno Textil SA): “To create value for society while creating value for the business is
the fundamental target of Inditex ” (Inditex, 2015, p. 98).
Philips, ING, and Eni offer in their annual reports a detailed description of the process of
value creation, though none of them claim to use VBM. Philips draws on “six different
forms of capital to drive value in the short, medium and long term” – human, intellectual,
financial, manufacturing, natural and social capital (Philips, 2015, pp. 12-13).
Eni goes one step further than Philips, and presents the effects of the capitals employed
(financial, productive, intellectual, human, social and relationship, and natural capital) on
the company itself, but also on the company’s stakeholders.
ING too provides the reader with a value creation model in its annual report, mentioning
that “as a financial institution, our input is mainly in the areas of financial, intellectual, and
human capital, whereas we impact society across all the capital outputs defined in the
International Integrated Reporting Council (IIRC) value creation framework” (ING, 2015,
p. 6).
It should be clear by now the words “value” and “value creation” appear in most annual
reports of the companies of EURO STOXX 50 index, and as already mentioned some of
these companies also employ a VBM metric. The next section of this paper gives a short
overview on VBM and on the of the EURO STOXX 50 companies using this approach.
3.
VBM and the EURO STOXX 50 companies
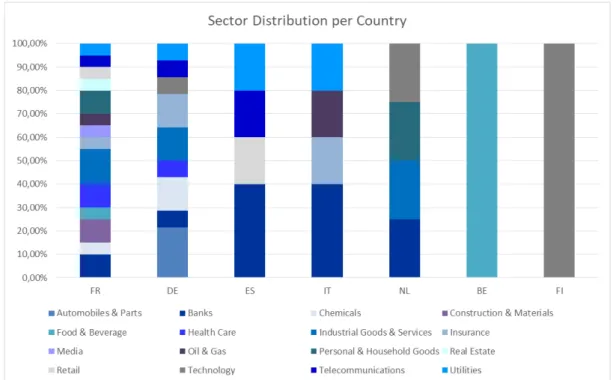
The following table shows the eight companies of the EURO STOXX 50 index, which
26
No. Company name Country Sector VBM
1 Airbus Group SE FR Industrial Goods and Services a
2 BASF DE Chemicals a
3 Bayer DE Chemicals a
4 BMW DE Automobiles and Parts a
5 Daimler DE Automobiles and Parts a
6 Deutsche Telekom DE Telecommunications a
7 SAP DE Technology a
8 Unicredit IT Banks a
Figure 1. Overview of the EURO STOXX companies using VBM in 2015 (Source: own representation based on the information provided in the annual reports of all 50 EURO STOXX companies)
One can find many definitions of VBM in the literature. According to Firk, Schrapp and
Wolff (2016, p. 42) “VBM is a holistic managerial approach that aims to align corporate
action with value creation”. The driving philosophy of companies using VBM is to
“maximize shareholder value by producing returns in excess of the cost of capital”
(Simms, 2001). In order to maximize shareholder value “VBM links the company’s
strategic objectives to a coherent set of performance measures through cause-and-effect
chains (‘value drivers’) that include all relevant processes and all pertinent information
systems across a company” (Burkert and Lueg 2013, p. 5). Among the most known metrics
associated with VBM are economic value added (EVA), discounted cash flow (DCF) and
cash flow return on investment (CFROI).
EVA is the most common method, and a registered trademark of Stern Stewart &
Company. To calculate the EVA, capital losses are deducted from capital profit. It is
considered a simple method, which can be advantageous. However, the existence of a
market and book value in the calculation of the EVA can lead to a lack of transparency.
Capital profit in opposition to the profit from a balance sheet, is a KPI that describes the
profit with interest rates. Capital losses are calculated from the capital multiplied with the
capital margin. Yet, only figures taken out from the profit and loss statement or the balance
27 When using the DCF method cash flow becomes the central KPI and an equity or an entity
approach can be here employed. Discounted rates and the net present value are for the
calculation essential. The advantage of the DCF is its acceptance internationally; it is often
employed e.g. in mergers and acquisitions valuations. Disadvantages of the DCF-method
are that the expected cash flows are uncertain and can change yearly or even during the
year.
Companies sometimes use the CFROI method for VBM as well. Developed by the Boston
Consulting Group, KPIs like the cash value added (CVA), free cash flow, weighted
average costs of capital (WACC) and the gross investments are used for calculating the
CFROI. Advantages are that cash flow values can be internally or externally calculated
and used by managers and investors to indicate liquidity and solvency. The disadvantages
of the CFROI-method are the slightly more complex formulas for calculation.
VBM is, however, ‘not just about the numbers’ as Haspeslagh, Noda and Boulos (2001)
noted: “A successful VBM program is really about introducing fundamental changes to a
big company’s culture. And therein lies the reason for most of the failures: Transforming
beliefs in a large organization is arguably the most difficult of all managerial challenges”.
In the following paragraphs the understanding of VBM as described in the annual reports
of the EURO STOXX companies using this approach is presented.
Airbus states that “among other indicators, the Group uses a Value Based Management
approach in order to guide the Company towards sustainable value creation by generating
financial returns above the cost of capital” (Airbus, 2015, p. 61). The KPIs employed by
Airbus are Return on Capital Employed (RoCE), EBIT pre-goodwill impairment and
exceptionals and free cash flow.
The German company BASF considers VBM an essential part of its strategy: the
company’s slogan “We add value as one company” is regarded as one of the four principles
which contribute to the company’s “We create chemistry” strategy (BASF, 2015, p. 30).
The annual report describes VBM as a holistic approach, implemented at all levels of the
company: “According to our value-based management concept, all employees can make a
contribution in their business area to help ensure that we earn the targeted premium on our
cost of capital. We pass this value-based management concept on to our team around the
28
all levels within BASF” (BASF, 2015, p. 30). As a steering parameter BASF uses EBIT
after cost of capital (BASF, 2015, p. 30).
Bayer is another German company of EURO STOXX index which uses VBM (six out of
the eight companies employing VBM are German). According to the annual report, “one
of the prime objectives of the Bayer Group is to steadily increase enterprise value” (Bayer,
2015, p. 55). The steering parameters involved in reaching this objective are CVA and
CFROI: “These indicators support management in its decision-making, especially in the
areas of strategic portfolio optimization and the allocation of resources for acquisition and
capital expenditures” (Bayer, 2015, p. 55).
BMW writes that “the business management system applied by the BMW Group follows
a value-based approach, with a clear focus on achieving profitable growth, increasing the
value of the business for the capital providers and safeguarding jobs” (BMW, 2015, p. 20).
While declaring that the KPIs engaged in measuring value creation are defined for each
controlling level, BMW employs not only financial indicators, such as RoCE, and return
on equity (RoE), but also non-financial indicators, such as the size of the Group’s
workforce (BMW, 2015, pp. 20-21).
Daimler too uses KPIs which are oriented “toward our investors’ interests and expectations
and provide the foundation of our value-based management” (Daimler, 2015, p. 77). At
the core of Daimler’s performance measurement system is value added which is
“calculated as the difference between operating profit and the cost of capital of average
net assets” (Daimler, 2015, p. 77).
Deutsche Telekom states that in order to “set and achieve [its] strategic goals more
effectively” (Daimler, 2015, p. 64) a value management approach is pursued. According
to the information from the annual report, the Group has a code of conduct which “defines
how employees and management should practice value-based and legally compliant
conduct in their daily business activities” (Daimler, 2015, p. 46), and the Group’s
corporate governance is value-oriented (Daimler, 2015, p. 63). Among the KPIs employed
by Deutsche Telekom are RoCE, EBIT, and free cash flow.
Dedicated to “creat[ing] long-term value by addressing future needs” SAP uses VBM and
it concentrates on two different goals: “We use various performance measures to help
29 profitability, and our primary non-financial goals, which are customer loyalty and
employee engagement” (SAP, 2015, p. 59).
The Italian company Unicredit describes in its annual report its “principles of value
creation and capital allocation” (Unicredit, 2015, p. 36). The main performance indicator
used by Unicredit is the EVA.
From the excerpts of the annual reports it becomes apparent that the companies
implementing VBM systems do have slightly different understandings, approaches, and
KPIs in use. However, as all companies of EURO STOXX 50 index do claim to create
value, in the next step of the paper the author analyses the degree to which these companies
concentrate not only on organizational growth, but also on organizational sustainability.
Sustainability could be achieved if women too were given the chance to be in top positions.
The next section contains a literature review with regard to the presence of women on
boards and women quota and it introduces the hypothesis of this paper.
4.
Women on boards and women quota – a literature review
A controversial issue during the past decades was women’s presence in supervisory
boards. Women are still the exception in German supervisory boards but their
representation increased gradually (Holst and Kirsch, 2014). It can be seen that more
women are integrated in supervisory boards in Northern Europe (e.g. Norway, Iceland,
Latvia, Finland and Sweden to mention the top 5 countries with the highest women quota).
It depends on the examined countries if a study can find a significant link between firm
performance and the women quota in supervisory boards. On the one hand, it was shown
e.g. for Denmark that a higher women quota in supervisory boards can determine a better
company performance (Lückerath-Rovers, 2011) but on the other hand, this finding could
not be verified for the same country by other studies (Rose, 2007).
Beaufort and Summers (2013) identified at European level a 1.5% change of women
representation in mainly male supervisory boards between 2009 and 2013. If women were
already member in a supervisory board, the women quota was likely to increase further.
When one woman was a board member, the women quota stood at 3.2%; by already 3
women in the supervisory board, the women quota increased to 3.7%. According to the
above study the average women quota in supervisory boards in Europe in 2013 was 7.9%.
30
Another study on women in European listed companies suggests positive effects of diverse
boards on corporate governance and even on firm performance (Buchwald and Hottenrott,
2014). A similar result was registered by a Catalyst study which examines the relationship
between women on corporate boards and their companies’ financial performance in the
United States (Catalyst, 2007). The study “Women matter. Gender diversity, a corporate
performance driver” shows that companies with a higher proportion of women in top
management perform better (McKinsey, 2007). Other authors signal rather the lack of
evidence that female representation in supervisory boards improves profitability (Ferreira,
2014). It is suggested that rather benefits for the society should be measured when women
occupy supervisory board positions. In a study with 108 German large corporations which
took place between 2009 and 2013, there was not enough evidence to indicate a significant
relationship between gender diversity and firms’ financial performance (Dick, 2015).
There are however, institutional factors driving gender quotas in supervisory boards such
as e.g. welfare provision for state-owned enterprises, political coalitions and a legacy of
initiatives (Terjesen, Aguilera and Lorenz, 2015). It is more likely to establish a high
gender quota in supervisory board with left-leaning governments. In a survey of 201
Norwegian firms the positive effect of the women quota in supervisory boards is seen in
increased board development activities and in a decreased level of conflict (Nielsen, 2010).
Another exhaustive study, in which 2.360 companies from the Morgan Stanley Capital
International All Country World Index (MSCI ACWI) were observed over a period of 6
years by the Credit Suisse Research Institute (2012) shows as a result a better mix of
leadership skills, a wider pool of talent and a better risk aversion, the higher the women
quota in supervisory boards in the companies is (Kersley and O’Sullivan, 2012).
Many studies (e.g. Bilimoria, 2006; Terjesen, Sealy and Singh, 2009) suggest also a
positive relationship between female supervisory board members and the number of
women officers in management.
What needs to be acknowledged is the fact that gender balance became a priority and
diversifying corporate supervisory boards often represent a target to be achieved. Small
improvements can be seen with a law instituted quota for women in supervisory boards
(Corkery and Taylor, 2012). In Norway, Italy, France, Spain and starting with 2016 also
in Germany binding gender quota exist (Sullivan, 2015). Norway was the first country to