Objective: To evaluate the association between family history and the presence of dyslipidemia in children.
Methods: A cross‑sectional study with 257 children aged 4 to 7 years old from Viçosa, Minas Gerais, Southeast Brazil. Nutritional status and lipid profile (total cholesterol, cholesterol fractions, and triglyceride) assessments and an active search for a family history of dyslipidemia in parents were carried out. Pearson’s chi‑square test was used to identify associations, and Student’s t‑test was used to compare means. A Poisson regression analysis was performed to assess the independent association between family history and the presence of dyslipidemia in children. A significance level of 5% was adopted.
Results: Children of parents with dyslipidemia had higher serum concentrations of total cholesterol and triglycerides. In a regression analysis after adjustments, the presence of dyslipidemia in the father or in the mother (OR: 2.43; 95%CI 1.12–5.27), as well as the presence of dyslipidemia in both the father and the mother (OR: 5.62; 95%CI 2.27–13.92) were associated with hypertriglyceridemia in children. Children of parents with dyslipidemia had a higher prevalence of elevated low‑density lipoproteins (LDL‑c) (OR: 1.52; 95%CI 1.18–1.97).
Conclusions: An investigation of the family history of dyslipidemia should be made as part of the protocol to verify the presence of hypertriglyceridemia and dyslipidemia in children.
Keywords: Child; Parents; Dyslipidemia; Hypertriglyceridemia; Cardiovascular diseases.
Objetivo: Avaliar a associação entre história familiar e presença de dislipidemias em crianças.
Métodos: Estudo transversal com 257 crianças de 4 a 7 anos de idade do município de Viçosa, Minas Gerais. Foram realizadas avaliações do estado nutricional e do perfil lipídico (colesterol total e frações e triglicerídeos), além do registro de história de dislipidemia dos pais. Para análise estatística, foi utilizado o teste do qui‑quadrado de Pearson para identificar associações e teste t de Student para comparação de médias. Foi realizada análise de regressão de Poisson para avaliar a associação independente entre história familiar e a presença de dislipidemia em crianças, sendo adotado o nível de significância estatística de 5%. Resultados: Crianças com pais dislipidêmicos apresentaram maiores concentrações séricas de colesterol total e triglicerídeos. Na análise de regressão após ajuste, a presença de dislipidemia no pai ou na mãe (RP: 2,43; IC95% 1,12–5,27) bem como a presença de dislipidemia no pai e na mãe (RP: 5,62; IC95% 2,27–13,92) estiveram associadas à hipertrigliceridemia nas crianças. Crianças com pais e mães dislipidêmicos apresentaram maior prevalência de lipoproteína de baixa densidade (LDL‑c) elevada (RP: 1,52; IC95% 1,18–1,97).
Conclusões: A investigação da história familiar de dislipidemia deve fazer parte de protocolos para verificar a presença de hipertrigliceridemia e dislipidemias na infância.
Palavras‑chave: Criança; Pais; Dislipidemias; Hipertrigliceridemia; Doenças cardiovasculares.
ABSTRACT
RESUMO
*Corresponding author. E‑mail: [email protected] (M.S. Filgueiras). aUniversidade Federal de Viçosa, Viçosa, MG, Brazil.
Received on July 11, 2017; approved on October 18, 2017; available online on June 21, 2018.
Family history is associated
with the presence oF dyslipidemia
in pre‑school children
O histórico familiar está associado à
presença de dislipidemia em crianças pré-escolares
Mariana de Santis Filgueiras
a,* , Sarah Aparecida Vieira
a,
INTRODUCTION
Dyslipidemia occurs when lipoproteins are metabolically altered such that high serum concentrations of total cholesterol (TC), low density lipoproteins (LDL-c) and triglycerides (TG) are observed, as well as low serum concentrations of high density lipoproteins (HDL-c).1 Genetic factors, being overweight,
sed-entary behavior and poor nutrition may contribute to the onset of childhood dyslipidemia.2,3
The presence of dyslipidemia is the basis for the development of atherosclerosis, which can begin in childhood and extend into adolescence and adulthood.4 Therefore, the identification
of children at risk for dyslipidemia is essential in the effort to reduce morbidity and mortality due to cardiometabolic diseases.5
Family history is one of the main factors that can detect dys-lipidemia, as it is based on heredity, eating habits and the life-styles shared by familes.6 Parents are actively involved in the
for-mation of children’s eating habits and physical activity routines since they are the ones that provide food and set examples of eating habits and meal times. Additionally, they pass on their preferences for specific foods and brands.7
Considering the influence of family history on children’s health, knowing if dyslipidemia is present in the family his-tory may contribute to more effective public health measures. Brazilian studies that deal with this subject are scarce, since, for the most part, family history of dyslipidemia is not an evaluated as a main variable. Thus, the objective of this study was to evaluate the association between family history and the presence of dyslipidemia in children.
METHOD
The present research presents a cross-sectional study of children belonging to a retrospective birth cohort at the only maternity hos-pital in Viçosa, Minas Gerais. The children received medical super-vision from the Lactation Support Program (Programa de Apoio à Lactação — PROLAC) in the first year of their life and were reas-sessed between the ages of 4 to 7 years old. PROLAC is a program of the Universidade Federal de Viçosa (UFV) in partnership with the municipality’s Human Milk Bank (Banco de Leite Humano — BLH).
This age group was decided upon due to the fact that their growth rate was practically constant between the end of their third year of life and the beginning of puberty.8
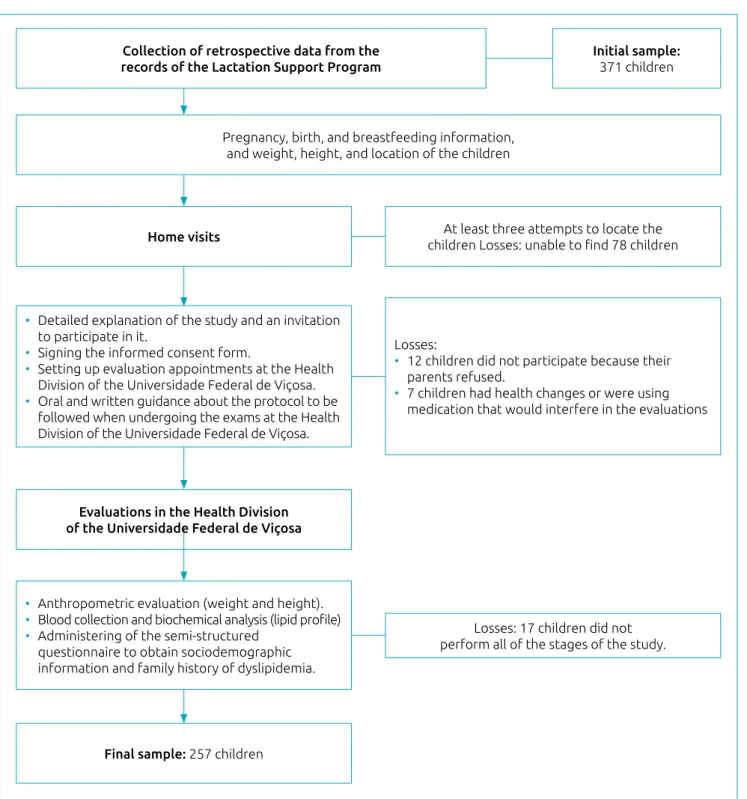
Based on information collected from PROLAC care records, and considering the inclusion criteria of the study - identifi-cation data that revealed the children’s loidentifi-cation, if they had a full-term birth, appropriate weight, and a date of birth com-patible with the ages between 4 and 7 years old at the time of the study - 371 children were eligible for this study. Of the eli-gible children, 78 were not located (change of address) after at
least 3 attempts to locate the children through home visits, 12 were not authorized by their parents to participate, 17 did not complete all stages of the study and 7 had health problems that prevented them from participating. Thus, the final sample of the present study was 257 children. A schematic representation of the data collection and sample losses are shown in Figure 1.
Based on the means and standard deviations of children of mothers with dyslipidemia (178.0 ± 37.6 mg/dL) and mothers without dyslipidemia (165.2 ± 23.3 mg/dL), the sample had a power of 98.9% for a confidence level of 95%. The analysis was performed using the Open Epi Online Program.
The gender and age of the children were obtained through a semi-structured socioeconomic and demographic question-naire, which was then used as an adjustment in the Poisson regression analysis. Gender was dichotomously categorized and age was assessed as a continuous variable (months).
To evaluate nutritional status, the following items were measured: weight, from an electronic digital scale with a max-imum capacity of 150 kg and a sensitivity of 50 g; height, using a vertical stadiometer attached to the wall, with a range of 2m, divided into centimeters and subdivided into millime-ters according to standards recommended by Jelliffe.9 WHO
AnthroPlus software (World Health Organization, Geneva, Switzerland)10 was used to obtain body mass index by age
(BMI/A) in a Z score, and to diagnose the nutritional status of the children, according to growth curves from the World Health Organization (WHO), and adopted by the Ministry of Health.11,12 For the purpose of analysis, overweight and obese
children were classified as being overweight.
After the children had fasted for 12-hours, their blood sam-ples were collected for an analysis of the following biochemical parameters: TC, LDL-c, HDL-c, and TG.
The analyses were performed from the blood serum after the material was centrifuged in the Centrifuge model 206BL Excelsa (FANEM, São Paulo, Brazil) for 10 min at 3,500 rpm. TC, HDL-c and TG were measured according to the enzymatic colorimet-ric method, and automated using Cobas Mira Plus equipment (Roche Corporation, Montclair, USA). LDL-c serum concen-trations were calculated using the Friedwald formula, since no TG value was greater than 400 mg/dL.13 In addition, the ratios
between TC/HDL-c, LDL-c / HDL-c and TG / HDL-c were cal-culated. These ratios accurately predict the presence of subclinical atherosclerosis and coronary disease in children and adults.14,15
The lipid profile was classified according to the I Guidelines for the Prevention of Atherosclerosis in Childhood and Adolescence from the Brazilian Society of Cardiology (I Diretriz de Prevenção da Aterosclerose na Infância e na Adolescência da Sociedade Brasileira de Cardiologia).15 A change in at least one lipid
The family history of dyslipidemia was self-reported through a semi-structured questionnaire filled-out by parents. There was considered to be a family history of dyslipidemia when the father or mother also had dyslipidemia.
Statistical analyzes were performed using the Social Package Statistical Science program (SPSS) for Windows version 20 (IBM Corporation, Chicago, USA). The Kolmogorov Smirnov
normality test was applied, and a descriptive analysis of the data was carried out using frequency, central tendency and disper-sion measurements. Pearson’s chi square test was performed to identify associations between the frequency of changes in the lipid profile and family history of dyslipidemia. The Student’s t test was used to compare the mean values of the lipid profile markers between the two independent groups (children with
Collection of retrospective data from the records of the Lactation Support Program
Pregnancy, birth, and breastfeeding information, and weight, height, and location of the children
Home visits
Evaluations in the Health Division of the Universidade Federal de Viçosa
Final sample: 257 children
• Detailed explanation of the study and an invitation to participate in it.
• Signing the informed consent form.
• Setting up evaluation appointments at the Health Division of the Universidade Federal de Viçosa. • Oral and written guidance about the protocol to be
followed when undergoing the exams at the Health Division of the Universidade Federal de Viçosa.
• Anthropometric evaluation (weight and height). • Blood collection and biochemical analysis (lipid profile) • Administering of the semi‑structured
questionnaire to obtain sociodemographic information and family history of dyslipidemia.
Losses:
• 12 children did not participate because their parents refused.
• 7 children had health changes or were using medication that would interfere in the evaluations
At least three attempts to locate the children Losses: unable to find 78 children
Losses: 17 children did not perform all of the stages of the study.
Initial sample:
371 children
and without a family history of dyslipidemia). Analysis of vari-ance (ANOVA), with Tukey’s post hoc test, was used for com-paring the three groups (no family history; father or mother has dyslipidemia; and father and mother both have dyslipidemia).
Poisson regression models with robust variance were used to evaluate the association of family history of dyslip-idemia (independent variable) with hypercholesterolemia, low HDL-c, high LDL-c, and hypertriglyceridemia in chil-dren (dependent variables). The analysis was adjusted for gender, age and nutritional status (normal weight and over-weight individuals). The suitability of the regression models was assessed by the Hosmer Lemeshow test (Goodness of fit test). For all of the tests performed, the level of statistical sig-nificance adopted was 5%.
This study was approved by the UFV Human Research Ethics Committee (nº 094/2011), and the children were included only after their parents or guardian signed an informed consent form.
RESULTS
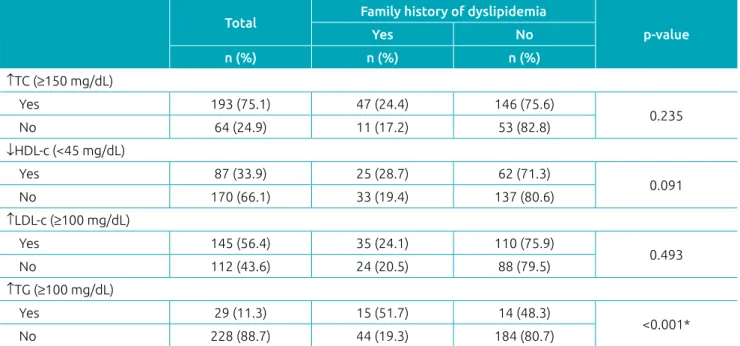
A total of 257 children, with a mean age of 71.5 ± 12.5 months (data not shown) were evaluated. The majority of them were male (55.3%) and had elevated TC (75.1%) and LDL-c (56.4%). The prevalence of family history of dyslipidemia was 22.6% -- 11.8% in mothers and 17.5% in fathers (data not shown). The family history of dyslipidemia was associated with the pres-ence of hypertriglyceridemia in children (Table 1).
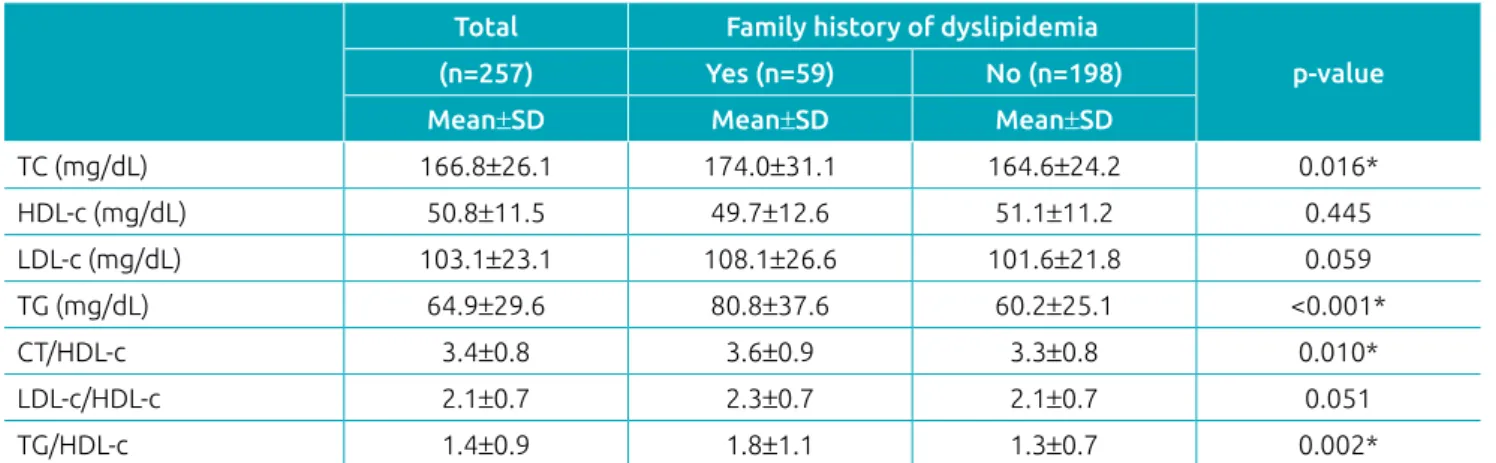
We observed that children with a family history of dys-lipidemia had higher serum concentrations of TC (p=0.016), TG (p<0.001), and higher TC / HDL-c (p=0.010) and TG / HDL-c (p=0.002) ratios (Table 2).
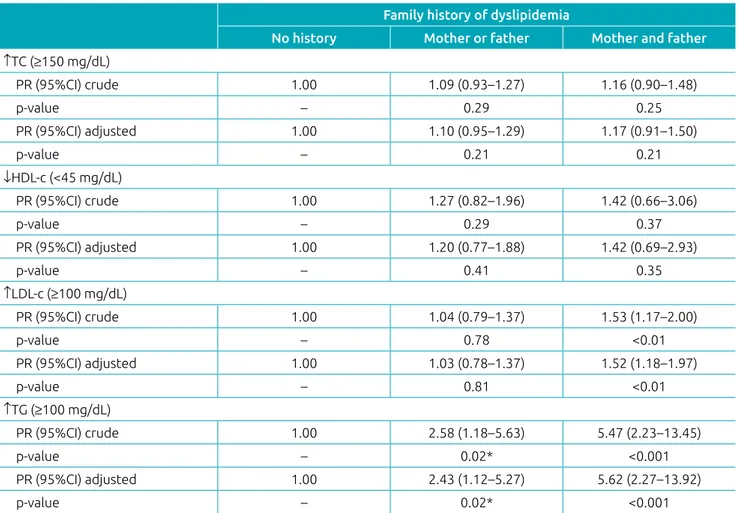
Children of parents with dyslipidemia had higher serum con-centrations of TC and TG compared to those without a family history of dyslipidemia (Figure 2). In the regression analysis, we observed that the presence of dyslipidemia in both the father and the mother increased the prevalence of elevated LDL-c in children (PR: 1.52; 95%CI 1.18–1.97; p=0.001). The presence of dyslipidemia in at least one of the parents increased the prev-alence of hypertriglyceridemia in children (PR: 2.43; 95%CI 1.12–5.27; p=0.020); and was even greater when both parents had it (PR: 5.62; 95%CI 2.27–13.92; p<0.001) (Table 3).
DISCUSSION
This study demonstrated that a family history of dyslipidemia was associated with the worse lipid profile in children, with an emphasis on the presence of hypertriglyceridemia. The presence of dyslipid-emia in both the father and the mother increased the prevalence of elevated LDL-c, regardless of gender, age and nutritional status.
Many studies have shown the importance of the family history of dyslipidemia for the development of various car-diometabolic alterations,17,18 however, the present study is
one of the few that analyzes Brazilian children. Similar to the results found in the present study, a family history of
Table 1 Changes in the lipid profile according to family history of dyslipidemia in children.
Total Family history of dyslipidemia
p‑value
Yes No
n (%) n (%) n (%) ↑TC (≥150 mg/dL)
Yes 193 (75.1) 47 (24.4) 146 (75.6)
0.235
No 64 (24.9) 11 (17.2) 53 (82.8)
↓HDL‑c (<45 mg/dL)
Yes 87 (33.9) 25 (28.7) 62 (71.3)
0.091
No 170 (66.1) 33 (19.4) 137 (80.6)
↑LDL‑c (≥100 mg/dL)
Yes 145 (56.4) 35 (24.1) 110 (75.9)
0.493
No 112 (43.6) 24 (20.5) 88 (79.5)
↑TG (≥100 mg/dL)
Yes 29 (11.3) 15 (51.7) 14 (48.3)
<0.001*
No 228 (88.7) 44 (19.3) 184 (80.7)
Table 2 Lipid profile markers according to family history of dyslipidemia in children.
Total Family history of dyslipidemia
p‑value (n=257) Yes (n=59) No (n=198)
Mean±SD Mean±SD Mean±SD
TC (mg/dL) 166.8±26.1 174.0±31.1 164.6±24.2 0.016*
HDL‑c (mg/dL) 50.8±11.5 49.7±12.6 51.1±11.2 0.445
LDL‑c (mg/dL) 103.1±23.1 108.1±26.6 101.6±21.8 0.059
TG (mg/dL) 64.9±29.6 80.8±37.6 60.2±25.1 <0.001*
CT/HDL‑c 3.4±0.8 3.6±0.9 3.3±0.8 0.010*
LDL‑c/HDL‑c 2.1±0.7 2.3±0.7 2.1±0.7 0.051
TG/HDL‑c 1.4±0.9 1.8±1.1 1.3±0.7 0.002*
SD: standard deviation; TC: total cholesterol; HDL‑c: high density lipoprotein; LDL‑c: low density lipoprotein; TG: triglyceride; Student’s t test; *p<0.05.
No history 185.0
180.0
175.0
170.0
165.0
100.00
90.0
80.0
70.0
60.0 114.0
112.0
110.0
108.0
106.0
104.0
102.0
51.0
50.5
50.0
49.5
Mother or father
182.4b
Total Cholesterol (mg/dL)
LDL c (mg/dL)
Triglyceride (mg/dL)
HDL c (mg/dL)
Mother and father
p=0.046*
No history Mother or father
p=0.920
p=0.001* 49.4a
92.0b
78.0b
61.1a
Mother and father
No history
114.6ª
Mother or father
Dyslipidemia Dyslipidemia
p=0.194*
Mother and father
No history Mother or father
Mother and father 166.4a
174.4a.b
51.0a
50.8a
103.3ª
108.0ª
dyslipidemia was a risk factor for its development in Chinese children.19 It is important to consider that the high
preva-lence of dyslipidemia in children may be associated with genetic and inappropriate lifestyle factors shared between parents and children, such as food consumption and amount of physical activity.20-22
Some studies with other populations have shown the importance of performing screenings to identify a family his-tory of dyslipidemia in children.23-25 It is known that familial
hypercholesterolemia is a common genetic cause of premature coronary disease and is an autosomal dominant disorder pres-ent even in individuals with a healthy lifestyle. A diagnosis of familial hypercholesterolemia is based on phenotypic criteria, involving high serum concentrations of LDL-c, plus a family history of elevated LDL-c, premature coronary disease and/or genetic diagnoses.4 However, an under-diagnosis of familial
hypercholesterolemia in children is observed, which points to the need to implement regular screening strategies.26
It is worth mentioning that, at a pre-school age, parents have a greater influence over eating behaviors and lifestyle.27,28
Considering the high prevalence of lipid profile alterations in this sample, there is a need for public policies that stimulate family involvement in the adoption of healthy living habits.
We observed a high prevalence of high serum concentrations of TC (75.1%) and LDL-c (56.4%) in children. Other stud-ies have reported similar results, such as the one performed in Diamantina, Minas Gerais, which demonstrated low serum con-centrations of HDL-c (81.7%) and high serum concon-centrations of TC (49.3%), LDL-c (30.4%), and TG (2.6%) in pre-school children.3 In the state of Pernambuco, 24 and 6% of children
and adolescents, respectively, had borderline and elevated serum concentrations of TC, and around 15 and 10% of the sample had borderline and elevated LDL-c serum concentrations.29
These results indicate the need to establish public policies that stimulate behavioral change in children, combating unhealthy eating habits and preventing the onset of cardiometabolic diseases.
Table 3 Crude and adjusted prevalence ratios of changes in lipid profile according to family history of dyslipidemia
in children.
Family history of dyslipidemia
No history Mother or father Mother and father ↑TC (≥150 mg/dL)
PR (95%CI) crude 1.00 1.09 (0.93–1.27) 1.16 (0.90–1.48)
p‑value – 0.29 0.25
PR (95%CI) adjusted 1.00 1.10 (0.95–1.29) 1.17 (0.91–1.50)
p‑value – 0.21 0.21
↓HDL‑c (<45 mg/dL)
PR (95%CI) crude 1.00 1.27 (0.82–1.96) 1.42 (0.66–3.06)
p‑value – 0.29 0.37
PR (95%CI) adjusted 1.00 1.20 (0.77–1.88) 1.42 (0.69–2.93)
p‑value – 0.41 0.35
↑LDL‑c (≥100 mg/dL)
PR (95%CI) crude 1.00 1.04 (0.79–1.37) 1.53 (1.17–2.00)
p‑value – 0.78 <0.01
PR (95%CI) adjusted 1.00 1.03 (0.78–1.37) 1.52 (1.18–1.97)
p‑value – 0.81 <0.01
↑TG (≥100 mg/dL)
PR (95%CI) crude 1.00 2.58 (1.18–5.63) 5.47 (2.23–13.45)
p‑value – 0.02* <0.001
PR (95%CI) adjusted 1.00 2.43 (1.12–5.27) 5.62 (2.27–13.92)
p‑value – 0.02* <0.001
Excess LDL-c particles cause atherosclerosis, a chronic inflammatory disease that occurs in response to endothelial aggression, and includes the innermost layer of medium- and large-caliber arteries.30 LDL-c is oxidized and accumulates in
the artery wall, stimulating the formation of leukocyte adhe-sion molecules. In turn, these molecules attract lymphocytes and monocytes into the arterial wall. Monocytes differentiate into macrophages, which pick up oxidized LDL-c, forming the foam cells. These cells stimulate the secretion of cyto-kines and proteolytic enzymes, causing the destruction of endothelial tissue.31
Hypertriglyceridemia results from the accumulation of chylo-microns and/or very low-density lipoproteins (VLDL-c), because of the reduction of TG hydrolysis of these lipoproteins by lipo-protein lipase or by the increase in the synthesis of VLDL-c. Depending on the origin of the TG — whether it is exogenous (chylomicron) or endogenous (VLDL-c) — changes in dietary habits are required, which include a reduction in the intake of fats and/or carbohydrates, and an increase in physical activity.1
A family history of dyslipidemia was associated with higher TC/HDL-c and TG/HDL-c ratios. Studies evaluating this asso-ciation are scarce. However, there is evidence in the literature of the association of these indices with higher concentrations of C-reactive protein (us-CRP),32,33 central obesity, insulin
resistance, metabolic syndrome, and thickness of the inner and middle layer of the carotid artery in children.33
One of the limitations of this study was that the informa-tion regarding family history of dyslipidemia was self-reported. On the other hand, many studies have demonstrated that the self-reporting of diseases is valid and can be used in triage and epidemiological studies.34,35 Another limitation is the study’s
cross-sectional design, which makes it impossible to infer a cause and effect relationship. Therefore, further studies are needed to assess how family history can determine the risk for dyslipidemia in children. This interaction is multifactorial, encompassing cultural, genetic and environmental aspects.36
This study allowed us to consider the importance of family his-tory of dyslipidemia as a way to screen for the risks for hypertriglycer-idemia and elevated LDL-c in children. Family involvement can be a way to prevent the onset of these changes in childhood and can even control these diseases that are already present in the parents.
Funding
National Council for Scientific and Technological Development - CNPq. Process number: CNPQ 485124/2011-4.
conflict of interests
The authors declare no conflict of interests.
REFERENCES
1. Xavier HT, Izar MC, Faria Neto JR, Assad MH, Rocha VZ, Sposito AC, et al. V Diretriz brasileira de dislipidemias e prevenção da aterosclerose. Arq Bras Cardiol. 2013;101:1‑20. 2. Zhang S, Liu X, Necheles J, Tsai HJ, Wang G, Wang B, et al.
Genetic and environmental influences on serum lipid tracking: a population‑based, longitudinal Chinese twin study. Pediatr Res. 2010;68:316‑22.
3. Nobre LN, Lamounier JA, Franceschini SC. Sociodemographic, anthropometric and dietary determinants of dyslipidemia in preschoolers. J Pediatr (Rio J). 2013;89:462‑9.
4. Wiegman A, Gidding SS, Watts GF, Chapman MJ, Ginsberg HN, Cuchel M, et al. Familial hypercholesterolaemia in children and adolescents: gaining decades of life by optimizing detection and treatment. Eur Heart J. 2015;36:2425‑37.
5. Berenson GS, Srinivasan SR, Bao W, Newman WP, Tracy RE, Wattigney WA. Association between multiple cardiovascular risk factors and atherosclerosis in children and young adults. The Bogalusa Heart Study. N Engl J Med. 1998;338:1650‑6.
6. National Heart, Lung, and Blood Institute. Expert panel on integrated guidelines for cardiovascular health and risk reduction in children and adolescents. Summary report. Pediatrics. 2011;128:S213‑56.
7. Burrows R, Atalah E, Leiva L, Rojas P, Maza MP, Vásquez F, et al. Metabolic syndrome prevalence in Chilean children and adolescent with family history of chronic noncommunicable diseases. Arch Latinoam Nutr. 2012;62:155‑60.
8. Monte O, Longui CA, Calliari LE, Kochi C, editors. Endocrinologia para o pediatra. 2nd ed. São Paulo: Atheneu; 1998. 9. Jelliffe DB. Evaluación del estado de nutrición de la comunidad
(con especial referencia a las encuestas en las regiones en desarrollo). Ginebra: Organización Mundial de Salud; 1968. 10. World Health Organization [homepage on the Internet]. WHO AnthroPlus for personal computers: Software for assessing growth of the world’s children and adolescents. Geneva: WHO; 2009 [cited 2017 Feb 02]. Available from: http://www.who.int/childgrowth/software/en/
11. World Health Organization [homepage on the Internet]. WHO Child growth standards. Geneva: WHO; 2006 [cited 2017 Feb 02]. Available from: http://www.who.int/childgrowth/en/ 12. World Health Organization [homepage on the Internet]. WHO
14. Frontini MG, Srinivasan SR, Xu J, Tang R, Bond MG, Berenson GS. Usefulness of childhood non‑high density lipoprotein cholesterol levels versus other lipoprotein measures in predicting adult subclinical atherosclerosis: the Bogalusa Heart Study. Pediatrics. 2008;121:924‑9.
15. Schmidt MD, Dwyer T, Magnussen CG, Venn AJ. Predictive associations between alternative measures of childhood adiposity and adult cardio‑metabolic health. Int J Obes (Lond). 2011;35:38‑45.
16. Sociedade Brasileira de Cardiologia. I Diretriz de Prevenção da Aterosclerose na Infância e na Adolescência. Arq Bras Cardiol. 2005;85:S1‑36.
17. Wiegman A, Rodenburg J, Jongh S, Defesche JC, Bakker HD, Kastelein JJ, et al. Family history and cardiovascular risk in familial hypercholesterolemia: data in more than 1000 children. Circulation. 2003;107:1473‑8.
18. Strufaldi MW, Souza FI, Puccini RF, Franco MC. Family history of cardiovascular disease and non‑HDL cholesterol in prepubescent non‑obese children. Rev Assoc Med Bras. 2016;62:347‑52. 19. Liao Y, Liu Y, Mi J, Tang C, Du J. Risk factors for dyslipidemia
in Chinese children. Acta Paediatr. 2008;97:1449‑53. 20. Ribeiro RQ, Lotufo PA, Lamounier JA, Oliveira RG, Soares JF,
Botter DA. Additional cardiovascular risk factors associated with excess weigth in children and adolescents. The belo horizonte heart study. Arq Bras Cardiol. 2006;86:408‑18. 21. Alcântara Neto OD, Silva RC, Assis AM, Pinto EJ. Factors associated
with dyslipidemia in children and adolescents enrolled in public schools of Salvador, Bahia. Rev Bras Epidemiol. 2012;15:335‑45. 22. Moschonis G, Mavrogianni C, Karatzi K, Iatridi V, Chrousos GP,
Lionis C, et al. Increased physical activity combined with more eating occasions is beneficial against dyslipidemias in children. The Healthy Growth Study. Eur J Nutr. 2013;52:1135‑44. 23. Wilson JM, Jungner G, editors. Principles and practice of
screening for disease. Geneva: WHO; 1968.
24. Kwiterovich PO, Gidding SS. Universal screening of cholesterol in children. Clin Cardiol. 2012;35:662‑4.
25. Galema‑Boers JM, Versmissen J, Lennep HW, Dusault‑Wijkstra JE, Williams M, Lennep JE. Cascade screening of familial hypercholesterolemia must go on. Atherosclerosis. 2015;242:415‑7.
26. Dixon DB, Kornblum AP, Steffen LM, Zhou X, Steinberger J. Implementation of lipid screening guidelines in children by primary pediatric providers. J Pediatr. 2014;164:572‑6. 27. Larsen JK, Hermans RCJ, Sleddens EF, Engels RC, Fisher
JO, Kremers SP. How parental dietary behavior and food parenting practices affect children’s dietary behavior. Interacting sources of influence? Appetite. 2015;89:246‑57. 28. Vollmer RL, Adamsons K, Foster JS, Mobley AR. Association
of fathers’ feeding practices and feeding style on preschool age children’s diet quality, eating behavior and body mass index. Appetite. 2015;89:274‑81.
29. Franca E, Alves JG. Dyslipidemia among adolescents and children from Pernambuco. Arq Bras Cardiol. 2006;87:722‑7. 30. Ross R. Atherosclerosis‑an inflammatory disease. N Engl J
Med. 1999;340:115‑26.
31. Hansson GK. Inflammation, atherosclerosis, and coronary artery disease. N Engl J Med. 2005;352:1685‑95.
32. Agirbasli M, Tanrikulu A, Acar Sevim B, Azizy M, Bekiroglu N. Total cholesterol‑to‑high‑density lipoprotein cholesterol ratio predicts high‑sensitivity C‑reactive protein levels in Turkish children. J Clin Lipidol. 2015;9:195‑200.
33. Pacifico L, Bonci E, Andreoli G, Romaggioli S, Di Miscio R, Lombardo CV, et al. Association of serum triglyceride‑to‑HDL cholesterol ratio with carotid artery intima‑media thickness, insulin resistance and nonalcoholic fatty liver disease in children and adolescents. Nutr Metab Cardiovasc Dis. 2014;24:736‑43.
34. Martin LM, Leff M, Calonge N, Garrett C, Nelson DE. Validation of self‑reported chronic conditions and health services in a managed care population. Am J Prev Med. 2000;18:215‑8. 35. Okura Y, Urban LH, Mahoney DW, Jacobsen SJ, Rodeheffer RJ.
Agreement between self‑report questionnaires and medical record data was substantial for diabetes, hypertension, myocardial infarction and stroke but not for heart failure. J Clin Epidemiol. 2004;57:1096‑103.
36. Giuliano IC, Coutinho MS, Freitas SF, Pires MM, Zunino JN, Ribeiro RQ. Serum lipids in school kids and adolescents from Florianópolis, SC, Brazil ‑ Healthy Floripa 2040 study. Arq Bras Cardiol. 2005;85:85‑91.