Carla Sofia Madeira Gomes Pimentel
Pine Processionary Moth (Thaumetopoea
pityocampa) and Great Tit (Parus major) in Portugal:
Population Dynamics and Interactions
Lisboa
© Novembro de 2004
Carla Sofia Madeira Gomes Pimentel
Depósito legal nº 1 ISBN: 972-8893-02-7
Faculdade de Ciências e Tecnologia daUniversidade Nova de Lisboa Campus de Caparica
Departamento de Ciências e Engenharia do Ambiente
Pine Processionary Moth (Thaumetopoea
pityocampa) and Great Tit (Parus major) in Portugal:
Population Dynamics and Interactions
Dissertação apresentada para obtenção do Grau de Doutor em Ciências do Ambiente, pela Universidade Nova de Lisboa, Faculdade de Ciências e Tecnologia
Orientadores: Doutora Maria Rosa Paiva e Doutor Jan-Åke Nilsson
Acknowledgements
I would like to thank Prof. Maria Rosa Paiva, the supervisor of this thesis, for the giving me the opportunity to do this work and for providing all the means for its execution.
I sincerely thank Prof. Jan-Åke Nilsson, who acted as a co-supervisor of this thesis, for his helpful suggestions on statistics and for introducing me to the fascinating world of nest-boxes and cavity-nesters. I also thank him for receiving me in Lund and providing access to the library service.
I am grateful to Verónica Amparo, Marta Neves, Márcia Santos and Cláudia Ferreira, who were the team that made this work possible. I thank them for the discipline, enthusiasm and team spirit they showed even in the hardest tasks.
I also would like to thank Teresa Calvão and Rita Barrocas for collaborating in Chapter 4 and Ana Paula Martinho for collaborating in Chapter 5. Thanks are also due to Eveline Moura for collaborating in the fieldwork during the season 1999/2000.
I would like to express my gratitude to the Administrations of Apostiça and National Pine Forest of Leiria who provided access to the field sites, and to the meteorological services of Aerial Base of Monte Real and AFLOPS for providing the meteorological data used in the present work.
I also whish to thank my uncle Júlio Botas, and my sister Ana Pimentel for all the unconditional support and encouragement during the last stages of the present work.
Sumário
No presente trabalho estudou-se a dinâmica populacional de uma praga importante nas florestas de pinheiros em Portugal – Thaumetopoea pityocampa (Den. & Schiff.) – e de um
dos seus predadores potenciais – Parus major (L.). As fases de ovo e larvares do lepidóptero
foram estudadas em vários tipos de plantações de Pinus pinaster (Aiton) localizadas em três
regiões do País: Península de Setúbal, Abrantes e Mata Nacional de Leiria. A localização geográfica dos pinhais e a estrutura dos povoamentos foram os factores mais importante para determinar as densidades populacionais de T. pityocampa, sendo as zonas de Setúbal e
Abrantes preferencialmente atacadas em relação a Leiria e pinhais jovens e homogéneos mais susceptíveis ao ataque do que povoamentos mais maduros e heterogéneos. No entanto, uma população anómala de T. pityocampa, cujas larvas se desenvolvem durante o Verão ao invés
do Inverno, como a população normal, atingiu elevadas densidades populacionais em Leiria, ao contrário da população normal. O impacte dos diversos factores de mortalidade nos estados imaturos do insecto (ovos e larvas) e das condições climáticas, são analizados e discutidos para todas as populações, assim como as possíveis implicações evolutivas do aparecimento da população anómala de T. pityocampa numa área de pinhal gerida para produção de madeira há
centenas de anos. Uma vez que é a quebra da diapausa das pupas e a emergência dos adultos que define o ciclo de vida do insecto, foi a emergência precoce dos adultos na população dessincronizada de Leiria o factor que determinou a alteração do ciclo de vida do insecto. Os diferentes factores que influenciam as datas de emergência das populações normais e dessincronizada, ao longo dos anos, são também discutidos. Para o estudo das populações de
P. major foram colocadas caixas-ninho na Península de Setúbal e Mata Nacional de Leiria, as
quais foram monitorizadas ao longo de três anos. As caixas ninho aumentaram a densidade populacional de aves invernantes e nidificantes nas plantações estudadas, indicando ser de facto a ausência de cavidades nas árvores um factor limitante. Registou-se o mais precoce início de nidificação de P. major, o que indica que nos pinhais costeiros nacionais, a
abundância de presas, ocorre mais cedo do que em outras zonas da Europa e Norte de África. Isto determina de facto uma sobreposição entre o final da fase larvar de T. pityocampa e o
início da nidificação de P. major.
Palavras chave: Thaumetopoea pityocampa, Parus major, Pinus pinaster, dinâmica
Abstract
In the present work, we studied a common outbreaking Lepidoptera species in Portuguese pine stands – Thaumetopoea pityocampa (Den. & Schiff.) - and one of its potential predators
– Parus major (L.). The population dynamics of the immature stages of the Lepidoptera was
studied in several types of Pinus pinaster (Aiton) plantations in three different areas: Setúbal
Peninsula, Abrantes and National Pine Forest of Leiria. Location and plantation structure was the most important factors determining population density of T. pityocampa. Setubal and
Abrantes was highly susceptible to attacks by the Lepidoptera, whereas Leiria had lower densities. Young and homogeneous pine stands was more susceptible to attacks than older and more heterogeneous pines stands. However, a desynchronized population of T. pityocampa, in
which the larvae develops during summer instead of during winter, reached high densities also in Leiria. The impact of several mortality factors and climatic conditions on the immature stages of the insect (eggs and larvae), in normal and desynchronized populations are discussed, as well as possible evolutionary implications of the sudden appearance of the new version of T. pityocampa. The break of the pupa diapause and adult emergence times the
annual life cycle of this insect. Adults from the desynchronized population emerged earlier than adults from the normal population, which in turn determined the change in the larvae development period. Different factors, potentially affecting the timing of adult emergence in both normal and abnormal populations are also discussed. To study P. Major, nest-boxes were
placed in the areas of Setúbal and Leiria and they were monitored during three seasons. The nest-boxes increased the density of breeding and wintering birds in the studied pine plantations, indicating that a lack of natural holes are in fact a limiting factor for this populations. The earliest breeding start for this species was recorded in my study area, indicating that Portuguese coastal pines provide good breeding conditions earlier than in other areas of Europe and North Africa. This leads to an overlap between the end of the larvae stage of T. pityocampa and the beginning of the breeding season of P. major.
Key-words: Thaumetopoea pityocampa, Parus major, Pinus pinaster, population dynamics,
Contents
1. General introduction
……...……….. 11.1. The forest ecosystem……….. 1
1.2. Herbivory in forests……….……….. 3
1.3. Gregarious caterpillars……….. 4
1.4. Thaumetopoea moths………..………..………….. 7
1.5. Birds as insect predators in forest ecosystems……..……… 8
1.6. Thesis outline………..………..……….. 10
2. Dynamics of pine processionary moth: comparison of different maritime
pine plantations in Central-South Portugal………...………..…….
132.1. Introduction………..………..……… 13
2.2. Material and Methods……….……...……… 14
2.2.1. Areas of study………...…...………... 14
2.2.2. Precipitation data…………...………...….……….…. 16
2.2.3. Field surveys………...………...……….… 16
2.2.4. Laboratory…...………...……….……...… 18
2.2.5. Life table………...………...……….. 19
2.2.6. Statistical analyses………...………...………..…... 19
2.3. Results………..…..…………. 20
2.3.1. Pine stands characterization………...………... 20
2.3.2. Host selection and orientation………...……….…….…… 21
2.3.3. Egg-batches analysis………...……….…... 23
2.3.4. Eggs per tree and initial larvae survival………...……….….….….. 25
2.3.5. Temporal changes in the number of larvae per nest and tree…….…………..…... 26
2.3.6. Mortality during different stages of development………..….. 31
2.3.7. Larvae development……….…..…...……..………. 33
2.3.8. Larval distribution and densities………..………...……. 35
2.4. Discussion………..………..…………...……… 36
2.4.1. Host selection, egg-batches and nest orientation……...……..….………...…… 36
2.4.2. Egg size, fecundity and larvae batch size………..………...….…… 40
2.4.3. Mortality factors and survival………..…………...……… 43
2.4.4. Larvae development………...………… 46
2.4.5. Susceptibility of different areas……….………..……… 47
2.5. Conclusions………..…….………….…… 49
3. Dynamics of the pine processionary moth in the National Pine Forest of
Leiria (Portugal): comparison of two desynchronized populations in the
same pine stand………..………..………...
513.1. Introduction………..………..……… 51
3.2. Materials and Methods………..………...……… 52
3.2.1. Area………...………... 52
3.2.2. Meteorological data………...………... 53
3.2.3. WP and SP- distribution and attack level ……….……… 53
3.2.4. Larvae and egg-batches ………...……..……... 55
3.2.5. Life table………...………. 55
3.2.6. Statistical analyses………...……… 55
3.3. Results………..………... 55
3.3.1. Plot characterization………...……….. 55
3.3.2: Host selection and orientation………. 56
3.3.4. Eggs per tree and initial larvae survival………...………. 58
3.3.5. Changes in the number of larvae per nest and tree………... 59
3.3.6. The distribution of mortality factors during the egg and larvae periods……...…… 62
3.3.7. Larvae development………...……….. 64
3.3.8. Distribution and density of larvae from the SP and WP……… 65
3.4. Discussion………..………. 67
3.4.1. Host selection and orientation………. 67
3.4.2. Egg size, fecundity and larvae batch size………...………... 69
3.4.3. Mortality factors, survival and development………...………... 72
3.4.4. Larvae development………...……….. 74
3.4.5. Attack level of the two populations……….. 76
3.4.6. Why is the change in the life cycle advantageous? ………...……….. 77
4. Climate influence and spatial characteristics of a desynchronized
population of T. pityocampa outbreak in the National Pine Forest of Leiria
(Portugal): comparison with the normal population on the same
stand………...…………
814.1.Introduction……….……… 81
4.2. Methods……….. 82
4.2.1. Area……….. 82
4.2.2. Meteorological data………...………... 83
4.2.3. Field surveys………... 83
4.2.4. Seasonal flight activity………...…... 84
4.2.5. Statistical analyses………... 85
4.3.Results……….. 85
4.3.1. Climatic variables……….………... 85
4.3.2. Spatial variables in National Pine Forest of Leiria………... 87
4.3.3. SP and WP in National Pine Forest of Leiria………... 90
4.4. Discussion………... 93
5. Adult flight of the pine processionary moth in Portugal: comparison of
different populations
……….. 975.1. Introduction………...………. 97
5.2. Methods and materials……….………...………... 100
5.2.1. Areas of study………. 100
5.2.2. Laboratory studies……… 100
5.2.3. Field studies……… 101
5.2.4. Meteorological data……….. 101
5.2.5. Statistical analysis……….. 102
5.3. Results………. 102
5.3.1. Thaumetopoea pityocampa laboratory populations……....……….. 102
5.3.1.1. Seasonal pattern of emergence………... 102
5.3.1.2 Daily pattern of eclosion………. 105
5.3.2. Male seasonal flight activity in the field……… 106
5.4. Discussion………... 110
6. Population dynamics of great tit in coastal pines in South- Central
Portugal………..
1176.1. Introduction……… 117
6.2. Methods……….. 118
6.2.1. Areas of study………. 118
6.2.2. Climatic data………... 118
6.2.3. Population dynamics on great tit………. 119
6.3. Results………. 119
6.3.1. Climatic characterization of the two areas during the breeding season…..….……. 119
6.3.2. Breeding timings……….. 121
6.3.3. Density of breeding pairs……….………..……… 121
6.3.4. Evolution of the breeding parameters………... 122
6.4. Discussion………... 127
6.4.1. Breeding timings and success………. 127
6.4.2. Clutch size……….. 131
6.4.3. Evolution of density……….. 132
6.5. Conclusions……… 133
7. Final Considerations……….. 135
Figures
Figure 2.1: Field site locations………...……….………... 15
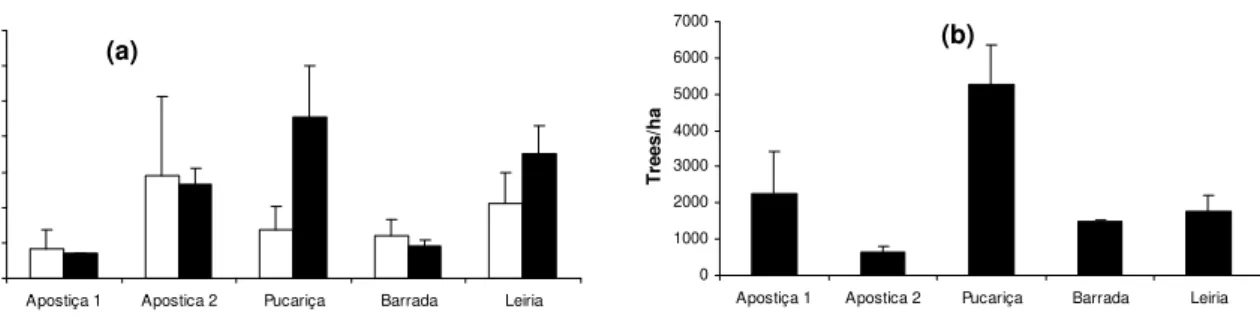
Figure 2.2: Tree diameter at breast height (DBH), basal area and tree density…….……… 21
Figure 2.3: DBH of attacked and non-attacked trees …….……… 22
Figure 2.4: Proportion of egg-batches and nests of three age categories of T. pityocampa larvae
situated in the sunny part of the tree…….……… 23
Figure 2.5: Number of eggs per egg-batch, egg volume, total ovary volume and egg mortality in
the two areas of Apostiça, seasons 2000/01 and 2001/02…….………..….. 24
Figure 2.6: Number of eggs per egg-batch and egg mortality in the different areas and years…... 25 Figure 2.7: Proportion of trees with egg-batches but no living larvae and the total number of
eggs per tree, seasons 2000/01 and 2001/02….………..……… 26
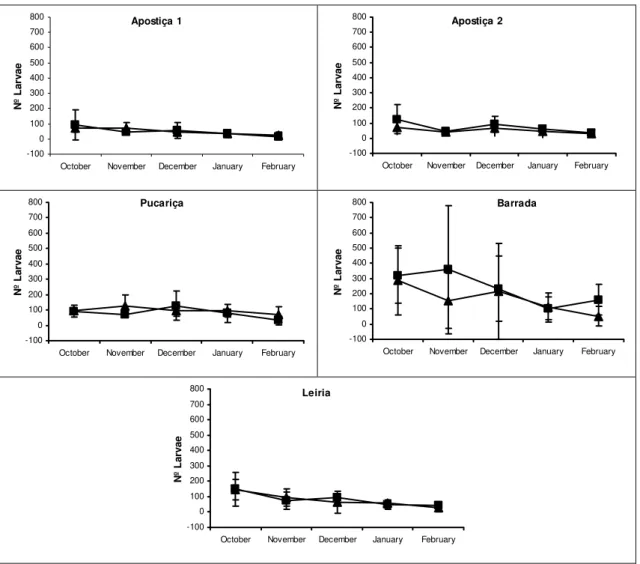
Figure 2.8: Temporal change in the number of larvae per nest ………... 28
Figure 2.9: Number of nests per tree in the five areas, seasons 2000/01 and 2001/02….…..…… 29 Figure 2.10: Temporal variation in the number of larvae per tree in all areas under study during
two seasons….………...……. 30
Figure 2.11: Mortality caused by P. caudata in nests with larvae at the end of the 4th instar in all
areas during three seasons….………...…… 31
Figure 2.12: Moisture content of T. pityocampa larvae during the different stages of
development….………... 33
Figure 2.13: Final wet mass of pre-pupae in different areas and seasons………. 34
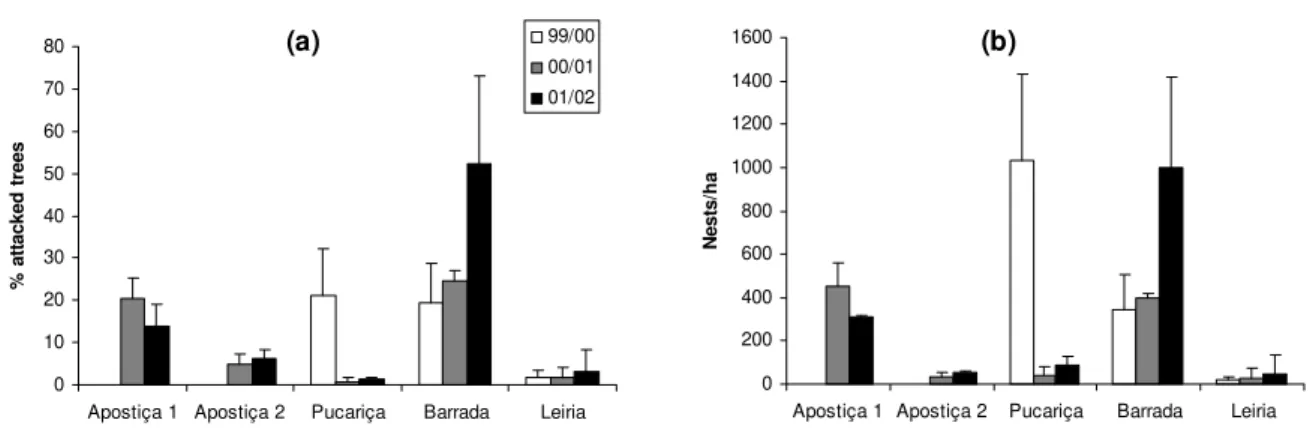
Figure 2.14: Level of attack by T. pityocampa in the different stands, along the three seasons…. 36
Figure 3.1: Location of the field surveys and larvae collection sites in National Pine Forest of
Leiria………..……… 54
Figure 3.2: DBH, Basal Area and tree Density in different Plots in National Pine Forest of
Leiria.……….… 56
Figure 3.3: DBH of attacked and non-attacked trees along the seasons in the WP and SP……… 56 Figure 3.4: Proportion of egg-batches and larvae nests situated in the sunny part of the tree in
the WP and SP during two years of study. ………. 57
Figure 3.5: Number of eggs per egg-batch, egg volume and egg mortality, in the WP and SP
along the seasons……….……… 58
Figure 3.6: Proportion of trees with egg-batches but no living larvae and the total number of
eggs per tree in the WP and SP along the seasons. ………. 59
Figure 3.7: Temporal variation in the number of larvae per nest in the WP and SP along the
seasons………..… 60
Figure 3.8: Number of nests per tree in the WP and SP along the seasons………... 61
Figure 3.9: Temporal variation in the number of larvae per tree in the WP and SP along the
seasons.……… 62
Figure 3.10: Pre-pupae final wet mass in the SP and WP during three seasons.…….………….. 64 Figure 3.11: Proportion of trees being attacked by the SP and WP in the different plots studied
Figure 3.12: Number of larvae nests per ha of the SP and WP in the different plots studied along
the seasons. ……….. 66
Figure 4.1: Location of the field surveys and pheromone traps in National Pine Forest of
Leiria……….………... 84
Figure 4.2: Total precipitation corresponding to the beginning of the pupae period and to the
end of the larvae period for T. pityocampa SP, for a series of 21 years (1981-2001)
(Latitude: 39º50`N, Longitude: 8º53`W) ………... 86
Figure 4.3: Average temperature corresponding to the beginning of the pupae period and to the
end of the larvae period for T. pityocampa SP, for a series of 21 years (1981-2001)
(Latitude: 39º50`N, Longitude: 8º53`W).………... 86
Figure 4.4: Wind frequency and wind speed from each orientation during the time when the
adults of SP and WP are on the wing. Data obtained for a 15 years series: 1960-74 (Latitude: 39º50`N, Longitude: 8º53`W).……….. 88
Figure 4.5: Evolution of tree age classes in the plots of National Pine Forest of Leiria over 20
years……….….. 89
Figure 4.6: Location of T. pityocampa SP distribution area in Portugal……….. 90
Figure 4.7: Management units and tree plots age of National Pine Forest of Leiria and SP
density and distribution………..……….. 91
Figure 5.1: Median and range of adult emergence dates for T. pityocampa laboratory
populations, in the different years………...………...………… 103
Figure 5.2: Median and range of adult emergence dates according to its pupation timing….…… 104 Figure 5.3: Daily pattern of male and female emergence in laboratory populations of T.
pityocampa originated from pre-pupae from different populations………...……… 106
Figure 5.4: Seasonal flight activity of T. pityocampa males monitored by pheromone traps in the
field, April- July 2001 – 2003, Leiria…………...………..………… 107
Figure 5.5: Seasonal flight activity of T. pityocampamales monitored by pheromone traps in the
field, July- October 1998 – 2003, Apostiça………....……… 108
Figure 5.6: Seasonal flight activity of T. pityocampamales monitored by pheromone traps in the
field, July- September 1999 and 2000, Pucariça……….……… 109
Figure 6.1: Degree-day accumulation of maximum monthly temperature and total monthly
precipitation during P. major breeding seasons………..……… 120
Figure 6.2: P. major breeding couples and fledglings produced per ha, in the first three breeding
seasons after the nest-boxes set-up, and number of roosting birds per ha during winter …... 123
Tables
Table 1.1: Life-history of Thaumetopoeidae species……….…………..……....……….. 9
Table 2.1: Climatic Characterization of the areas included in the study……….. 16
Table 2.2: Proportion of trees less than 1.60 m high in the different seasons in Apostiça and
Barrada………….…………..……..……….. 21
Table 2.3: Testing differences in DBH between years, of attacked and non-attacked trees and their
interaction in the different stands (Two-way ANOVA)…...…………...……….…… 22
Table 2.4: Testing for differences in the number of eggs per egg-batch, egg mortality and egg
volume between the stands Apostiça 1 and 2 during two years (Two-way ANOVA)… 23
Table 2.5: Testing for differences in number of eggs per egg-batch, egg mortality and egg volume
between the four areas and three years of study (Two-way ANOVA)………..……… 24
Table 2.6: Testing the differences in total number of eggs per tree and early larvae survival during
the season’s 2000/01 and 2001/02 (Two-way ANOVA)…..……….…………....….. 26
Table 2.7: Correlation between the number of hatched eggs in a tree and the larvae survival……... 26 Table 2.8: Testing the differences in the number of larvae per nest in the 1st, 3rd and 5th sample in
the two areas of Apostiça during the seasons 2000/01 and 2001/02 (Two-way
ANOVA)………..…….……… 27
Table 2.9: Testing the differences in the number of larvae per nest in the 1st, 3rd and 5th sample in
the four areas of study during the seasons 1999/00, 2000/01 and 2001/02 (Two-way
ANOVA) ………...……… 27
Table 2.10: Testing the differences between the number of nests per attacked tree in the five areas,
during the seasons 2000/01 and20 01/02. Data from 1st and 5thsample (non parametric tests)…………..…………..………….…………..………..………..… 29
Table 2.11: Testing the differences in the number of larvae per attacked tree in the 1st and 5th
sample in the five areas of study during the seasons, 2000/01 and 2001/02 (Two-way ANOVA)…..…………..………..….…………..………..….………… 31
Table 2.12: Testing the differences in mortality caused by Pr. caudatain the two areas of Apostiça
during the seasons 2000/01, 2001/02 and in Apostiça 2, Pucariça, Barrada and Leiria during three seasons (Two-way ANOVA)….………..…..…….... 31
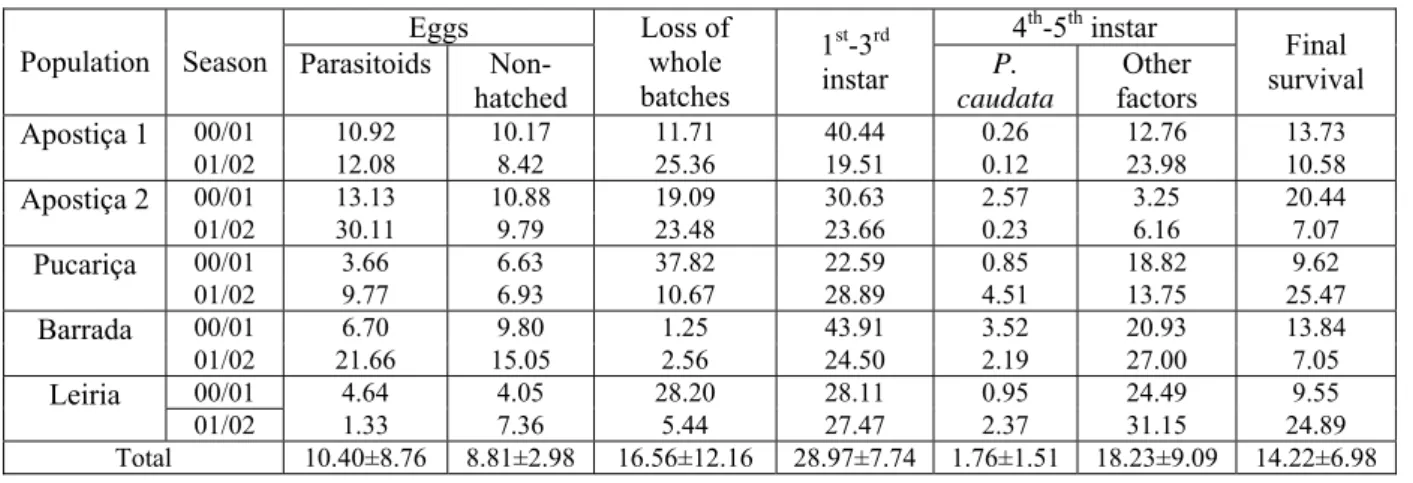
Table 2.13: Mortality of eggs and different larvae stages and final survival in the different
populations, seasons 2000/01 and 2001/02……….…………..……..……… 32
Table 2.14: Testing the differences in the pre-pupae final wet mass in the four areas, seasons
1999/00, 2000/01 and 2001/02 (Two-way ANOVA) ………...………..…….... 34
Table 2.15: Linear regression between the dry mass of the caterpillars and the sampling dates.
Total Precipitation calculated for the period September to February………..…….... 35
Table 3.1: Testing differences between the average DBH of attacked and non-attacked trees and
between the years in the SP and WP (Two Way ANOVA). ………...………. 56
Table 3.2: Testing differences in the number of eggs per egg-batch, egg mortality, egg volume and
ovary volume between SP and WP and years (Two Way ANOVA)………..………... 58
Table 3.3: Testing the differences in total number of eggs per tree and early larvae survival in trees
where both egg-batches and larvae were found in the WP and SP, during the seasons 2000/01 and 2001/02 (Two Way ANOVA)………... 59
Table 3.4: Testing the differences in the number of larvae per nest in the 1st, 2nd and 5th sample in
Table 3.5: Testing the differences between the number of nests per attack tree in the 1st and 5th
sample and between the SP and WP during the season’s 2000/01 and 2001/02. …….. 61
Table 3.6: Testing the differences in the number of larvae per attacked tree in the 1st and 5th sample
between the SP and WP during the seasons 2000/01 and 2001/02 (Two-way
ANOVA)………. 61
Table 3.7: Testing the differences in the number of larvae per attack tree in the 5th sample between
the SP and WP during the season’s 2000/01 and 2001/02 and the covariation according to the 1st sample (Two-way ANOVA)…………….……… 61
Table 3.8: Proportion of eggs that died during different stages and proportion of eggs that
produced larvae that pupated in the two populations in WP and SP in different seasons. ……….. 63
Table 3.9: Linear regression between the dry mass of the caterpillars and the sampling dates;
Insulation, Global Radiation, Precipitation and average temperature during the larvae development of the WP and SP. ………... 65
Table 3.10: Multiple regression between the slope of the linear regression between dry mass of the
caterpillars and sampling dates and climatic parameters for each population/season combination. ………... 65
Table 3.11: Multiple regression between the characteristics of each plot and its location and the
number of nests per ha in each population. ……… 66
Table 4.1: Linear regression between plot age and different plot attributes in National Pine Forest
of Leiria………..…… 87
Table 4.2: Variation of tree parameters for the tree age classes established in National Pine Forest
of Leiria ……… 87
Table 4.3: Significant regression equations found between severity of attack by SP and WP and
plot attributes in National Pine Forest of Leiria ………. 93
Table 5.1: Differences in male and female eclosion timings in the different laboratory populations.. 105 Table 5.2: Differences in male and female pupa length in the different laboratory populations...…. 105 Table 5.3: Kendall`s coefficient rank correlation between the different climatic variables occurring
during late pupa period and median male flight date in SP field populations…..….…. 107
Table 5.4: Number of days in which emergence of laboratory populations preceded the
correspondent field population emergence………. 109
Table 5.5: Kendall`s coefficient rank correlation between the different climatic variables occurring
during late pupa period and median male flight date in Apostiça and Pucariça field populations ……….……… 109
Table 5.6: Linear regression between climatic variables and the increase in the number of male
captures in the field………..……… 110
Table 6.1: Testing differences in maximum daily temperature, between Leiria and Apostiça over
three different seasons during the months of the breeding season (Two-way ANOVA).………...…...………. 120
Table 6.2: Median date and range of dates when the 1st and 2nd clutch was started………...……... 121 Table 6.3: Clutch size, proportion of eggs that hatched, number of fledglings produced per clutch;
proportion of hatched nestlings that fledged and total number of eggs and fledglings produced per pair during the breeding seasons….……….. 124
Table 6.4: Correlations between the start of egg laying in first clutches for each breeding pair and
the two areas studied………..………..
Table 6.5: Correlation between the start of egg laying in second clutches and the start of egg laying
in the first clutch, the number of eggs and fledglings produced and nestlings survival in the second clutch, in the two areas studied……….……..……….. 126
Table 6.6: Correlation between the number of eggs and fledglings produced in the first clutch and
1. General Introduction
1.1. The forest ecosystem
The combined action of the geochemical and biochemical cycles in undisturbed forest ecosystems results in an active accumulation and retention of nutrients from the geochemical cycle. The organic forest floor that develops from decomposing litter promotes the chemical retention of nutrients, and the combined action of mycorrhizal roots and fungi provides an efficient biological mechanism for nutrient uptake and retention. Plants growing under conditions of low nutrient availability have evolved mechanisms of nutrient conservation, such as long foliage retention, leaching-resistant cuticles, chemical defences against losses to herbivores, infrequent reproduction, and efficient internal recycling. The biogeochemical efficiency of forests is one of the main reasons why forests are able to grow on soils of extremely low fertility. It is frequently observed that mature forests of similar composition and productivity can develop on areas varying in the inherent fertility of the soil. Part of this apparent independence of a mature forest from the nutritional status of the underlying mineral substrate arises from the tendency for forests to build up a forest floor, accumulate a capital of nutrients, and then operate largely from the nutrients in the biogeochemical cycle (Mattson 1980, Kimmins 1997).
Mediterranean type ecosystems are characterized by hot, dry summers and warm, wet winters. This climate type characterizes only 5% of the earth, but it is present in all inhabited continents – Mediterranean Basin, California, Central Chile, South Africa, and Southwest Australia – these areas have clear physiognomic similarities despite genetic diversity (Fouseki and Margaris 1981). Coniferous and sclerophyllous forests and shrub lands are widely distributed in this area and the evergreen leaves of Mediterranean vegetation are typically poor in nutrients and rich in recalcitrant compounds. In fact Mediterranean-climate ecosystems are characterized as low nutrient ecosystems and the efficient withdrawal of nutrients before leaf fall reduces the quality of litter, nutrients being conserved within aerial biomass thus reducing the dependence of individual plants on the soil system (Fouseki and Margaris 1981, Rapp et al. 1999).
altitudes. This high plasticity probably explains the dynamic behaviour of most of these pines and the important roles that they play in vegetation dynamics around the Mediterranean Sea wherever human-induced disturbances are not too severe (Barbéro et al. 1998).
An idealized “pine prototype” would conform with the following profile: “a light-demanding, fast-growing, sclerophyllous tree that regenerates as even-aged cohorts following landscape-scale disturbance and retains its position in the landscape by exploiting aspects of its regeneration biology”. Among the factors that have contributed to the rapid range extension and population increase of pines are; abundant output of seeds from an early age; ability to recruit dense daughter stands on exposed sites soon after disturbance; effective mechanisms for long distance seed dispersal; a mating system that permits inbreeding and selfing in isolated trees; various life-history traits that confer resilience at the population level under a wide range of disturbance regimes; and the ability to colonize nutrient-poor sites (Richardson and Rundel 1998).
These characteristics helped to expand the range of the pine in South Western Europe (France and Spain) in recent decades. Pines are often invaders occupying the abandoned fields induced by the “set-aside” policy of the European Union and burned areas. On the contrary, in many areas of the southern part of the Mediterranean Basin, the shortage of fuel and timber is severe (e.g. in Algeria and Morocco) and the area covered with pine decrease drastically (Barbéro et al. 1998).
In Portugal the forested area covers about 40 % of the territory - about 3.4 million ha. About 30 % of this area is monocultures of maritime pine Pinus pinaster (Aiton), which constitutes
98 % of the stands - the other 2 % are Pinus pinea (L.) stands (DGF 1999, DGF 2001). Fossil,
charcoal and palynological records indicate that P. pinaster has been present in Portugal for
55 000 years and was probably able to survive the last glaciation in sheltered areas at low altitudes close to the Atlantic Ocean (Figueiral 1995). In the 1870`s the area occupied by pines was just 210 000 ha, but in the 1960`s this area had increased to 1.3 million ha. Most of this increase was due to massive forestation campaigns at the end of the 14th century (DGF 1999). Ribeiro et al. (2001) did not find any discernible geographic pattern for the Portuguese
populations of P. pinaster and they explain these results by the recent expansion of the
economical value for production of high quality timber and resin (Silveira da Costa 1984, DGF 1999, DGF 2001).
P. pinaster is considered to be drought resistant species that grows well in acid infertile sandy
soils. It prefers high air moisture content and its distribution reaches 1000 m a.s.l., it is intolerant to frost and cold weather, thus being well adapted to the north coastal areas of Portugal (Silveira da Costa 1084). P. pinaster has a long needle life span – about six years -
and an annual foliage mass turnover of just 18% (Warren and Adams 2000). Mass and nutrient of litter fall and its decomposition rate is lower in P. pinaster stands than in other
evergreen Mediterranean forest ecosystems, indicating that this species is extremely efficient in recovering most of its nutrients, especially Nitrogen, before needles fall (Moro and Domingo 2000, Kavvadias et al. 2001, Santa Regina 2001).
1.2. Herbivory in forests
The extent to which plants are consumed by herbivores varies greatly between different types of ecosystems. Phytoplankton communities in aquatic ecosystems experience exploitation by herbivores of 60-99%, grassland plants loose between 28-60% of their net primary production to herbivores, while in forests only about 5-10% of the foliage is consumed. Under endemic insect densities (less than 10% foliage reduced) this average level represents only 1.5-3% of the net primary production. In grasslands, a very high percentage of aboveground plant biomass and of the net primary production is palatable, digestible and within reach of herbivores. In forests, on the other hand, the foliage corresponds to a much smaller proportion of the net primary production, the rest being woody tissues that are little used by herbivores, with the exception of thin roots and young twigs. Forest foliage tends to be less palatable and digestible than grassland foliage because of its physical and chemical characteristics, and much of it is physically out of reach of many herbivores (Kimmins 1997, Hunter 2001).
structure of plant canopies and the cover that they provide, with concomitant changes in light availability, soil temperature and moisture. Such pulses of energy flow from the producer to the primary consumer level may be reflected in temporary expansions of the magnitude of energy flow and biomass all the way up the trophic chain (Kimmins 1997, Hunter 2001).
While outbreaking species of forest insects attract most research attention, the majority of forest insects have low, stable population sizes and never cause noticeable defoliation – for example only less than 2 % of macrolepidoptera tree feeding species undergo outbreaks (Nothnagle and Schultz 1987). Outbreaking and stable species of folivorous macrolepidoptera coexist in essentially the same habitat, on resources that are relatively predictable in time and space (Nothnagle and Schultz 1987, Hunter 1991). Differences in habitat stability and selective regimes cannot by themselves explain the patterns (Hunter 1991) although community structure can be very important (Faeth 1987, Redfearn and Pimm 1987).
According to Hunter (1991), forest outbreaking macrolepidoptera species have specific life cycle characteristics in response to weather, predation and changes in hosts. They typically have higher fecundity and host breadth, which allows them to rapidly exploit large sections of the environment when conditions are favourable. Furthermore, a disproportional number of outbreaking species are gregarious (12% of the total number of species analysed were gregarious, but 51% of them caused outbreaks whereas only 7% of the solitary species caused outbreaks), gregariousness was also found to be connected with egg-clustering and poor flying ability among females (Hunter 1991). In fact Tammaru and Haukioja (1996) connected Lepidoptera eruptivity with a capital breeding life-cycle – species in which adults depend mostly on resources derived from the larval period – and these characteristics are connected with low mobility in females, egg clustering and larval gregariousness.
1.3. Gregarious caterpillars
which may result in the inability to finish development, and sometimes to death of all offspring of a female (Floater and Zalucki 1999).
In fact gregariousness remains rare during the larval stage in Lepidoptera: of the about 160 thousand described species of butterflies and moths only about 300 species are known, so far to exhibit gregarious or social life-styles for at least part of their larval development. However, it is a widespread phenomenon, occurring in some twenty or more butterfly and moth families, and is likely to have multiple origins, with different species coming to sociality by different paths (Costa and Pierce 1997).
Two pre-requisites are generally considered essential for this life-style to evolve in Lepidoptera: egg clustering (Stamp 1980) and aposematism – repellent defences and warning coloration (Sillen-Tullberg 1988, Sillen-Tullberg and Leimar 1988, Tullberg and Hunter 1996). Egg clustering evolved due to energetic constrains to decrease oviposition searching time (Courtney 1984, Wiklund et al. 1987). This is especially important in species where
adults do not feed and have short life span. An increase in fecundity is connected with an increase in the size of the abdomen and, consequently, an increase in the energetic cost of flying for females (Wickman and Karlsson 1989, Tammaru and Haukioja 1996). Egg clustering may be enhanced if it reduces desiccation of the eggs, as has been demonstrated for the nymphalid Chlosyne lacinia (Geyer) (Clark and Faeth 1998). Repellent scent glands, long
hairs or spines, coordinated “head-flickering” movements, regurgitation of host plant toxins and irritant substances are defensive tactics that work out much better in large groups performing synchronized group behaviour (Gamberale and Tullberg 1996, 1998, Hunter 2000, Ruf 2002). Taking into account that natural enemies are the main cause of mortality in immature herbivorous insects (Cornell and Hawkins 1995, Cornell et al. 1998), this may lead
to higher larval survival in gregarious than in solitary species (Hunter 2000). Thus, these defences make it possible to overcome the disadvantage of belonging to a slow and highly visible group.
(Breurer and Devkota 1990, Ruf and Fiedler 2000) or increasing temperature when the group bask in the sun (Joos et al. 1988, Breuer et al. 1989, Ruf and Fiedler 2002a).
Social behaviour can be advantageous for feeding facilitation in ways which include communal overcoming of plant defence structures (Clark and Faeth 1997, Fordyce and Agrawal 2001), optimal exploitation of resources (Tsubaki and Shiotsu 1982, Le Masurier 1994) or the development of a pheromone based communication system, which can be more or less sophisticated according to the caterpillars food demands (Peterson and Fitzgerald 1991, Fitzgerald and Underwood 1998a,b, Fitzgerald and Pescador-Rubio 2002, Fitzgerald 2003).
Solitary caterpillars are able to elevate their body temperature by exposing their preferably dark coloured bodies to the radiation of the sun, which enhances consumption and digestion rates and consequently the development rate (Casey 1976, Bryant et al. 2000). Their small
size increases the rates of heating, but also of cooling, giving them a limited capacity of increasing their body temperature above the air temperature (Stevenson 1985a,b). In aggregation, caterpillars multiply their effective body mass, which results in much higher temperatures than in solitary larvae (Knapp and Casey 1986, Stevenson 1985a,b, Bryant et al.
2000). Aggregation can also be important for water balance in warmer climates when there is no need for an increased body temperature (Klok and Chown 1999). Furthermore, if caterpillars build tents, these structures may enhance temperature gains even further (Joos et al. 1988, Breuer et al. 1989, Fitzgerald and Underwood 2000, Ruf and Fiedler 2002a).
It is noticeable that sociality in caterpillars combined with tent building predominantly occurs in species that develop in early spring in temperate climatic areas, feeding on deciduous trees, like the eastern tent caterpillar Malacosoma americanum (F.) (Joos et al. 1988) and the small
aggar moth Eriogaster lanestris (L.) (Ruf and Fiedler 2000, 2002a); or throughout the winter
in warmer climates, feeding on evergreen species, like the madrone caterpillar Eucheria socialis (Westwood) (Kevan and Bye 1991), Ochrogaster lunifer (Herrich-Schaffer) (Floater
1997) and Thaumetopoea pityocampa (Den. & Schiff). Both types explore thermal conditions
that are very restrictive for ectothermic insects.
and feed on leaves incorporated within the structure. Nomadic foragers move in groups from one food patch to the next, and depleted sites are regularly abandoned. They do not construct three-dimensional silken shelters but often build silken pads for resting or moulting. Central-place foragers represent the most complex system of sociality in caterpillars. These species usually construct shelters but unlike patch-restricted foragers they feed outside these constructions in the surrounding vegetation. These species evolved a sophisticated communication system, which includes group cohesion, group defence, spatial orientation, and exchange of information about feeding sites (Costa and Pierce 1997.).
In central place foragers that move in processions, a chemical trail marker secreted from the tip of the abdomen is primarily responsible for eliciting trail following (Peterson and Fitzgerald 1991, Fitzgerald and Underwood 1998a,b, Fitzgerald and Pescador-Rubio 2002, Ruff et al. 2001, Fitzgerald 2003). This communication system can be more or less
sophisticated according to the caterpillar’s food demand. The eastern tent caterpillar is an example of a fine tuned trail-marking system. The species feed on the youngest leaves in the tree, which allow them to have a fast growth rate. To meet the food demands they need to find new sources of food and leave exhausted areas efficiently, dealing with a patchily distributed food supply. These larvae are able to quickly abandon exhausted food paths and recruiting their nest mates to new food sources (Peterson and Fitzgerald 1991). Other species, with slower growth rates, do not discriminate among patches of leaves of different nutritional quality and have a less efficient trail marking system (Fitzgerald and Underwood 1998a,b). According to Fitzgerald (2003), T. pityocampa seems to be the less demanding of all central
place foragers studied. The caterpillars have the ability to distinguish new from weaker trails which enables them to move to communal feeding sites independently, and to find their way back to the nest after feeding, but colonies are relatively inefficient in abandoning exhausted feeding sites in favour of new sites and they do not recruit others to food.
1.4. Thaumetopoea moths
Moths belonging to the Thaumetopoeidae family are widespread throughout Eurasia, Africa and Australia. The processionary moths of the Mediterranean area belong to the genus
Thaumetopoea. All Thaumetopoea species oviposit in clusters and live in aggregations. Some
six instars and pupate in the nest. Nocturnal behaviour in late instars and adults, as well as urticating late instar larvae, are also common features. The known Thaumetopoea species can
be grouped in species having egg diapause, the so called “summer processionary moths” which are Thaumetopoea pinivora (Treitschke), T. processionea, Thaumetopoea bonjeani
(Powell), Thaumetopoea solitaria (Freyer) and Thaumetopoea herculeana (Rambur); and a
pupal diapause the so-called “winter processionary moths”. T. pityocampa, Thaumetopoea wilkinsoni (Tams) and Thaumetopoea jordana (Staudinger) (Douma-Petridou 1989, Schmidt
1989, Halperin 1990) (see Table 1.1).
Chemistry of the pheromone components corroborates the split between the two groups of processionary moths except for T. solitaria, which differs from both groups (Frerot and
Demolin 1993). All these species, except T. herculeana, which feeds on Geraniaceae, are
reported as causing outbreaks in deciduous and coniferous trees.
Another well-known Thaumetopoeidae is the O. lunifer species complex, widespread in
Australia, feeding on Eucalyptus spp. and Acacia spp., which has a univoltine life cycle very
similar to the Thaumetopoea species with pupal diapause (Floater 1996 a,b,c).
1.5. Birds as insect predators in forest ecosystems
For immature stages of herbivorous insect, natural enemies are known to be the major cause of mortality (Cornell and Hawkins 1995, Cornell et al. 1998). Predatory birds are the third
trophic level in a forest ecosystem, and evidence suggests a “top-down” effect, having a potential impact on the community composition, plant productivity and individual plant fitness (Marquis and Whelan 1994). In fact, insectivorous birds are known to respond numerically to forest Lepidoptera outbreaks (Holmes et al. 1986, Haney 1999), effectively
reducing the density of insect larvae in tree canopies (Holmes et al. 1979, Gunnarsson 1996)
Table 1.1: Life-history of nine Thaumetopoeidae species: the eight species belonging to European Taumetopoea and the Australian specie of the genus Ochrogaster.
Specie Cycle Diapause Flight period Larval period Nests Host Distribution Reference
Thaumetopoea pinivora
Treitschke, 1834 Bianual Univoltine Egg+Pupa Pupa July-August April-June April-July June-August Yes Pinus spp. Central and South Europe Schmidt 1989
Thaumetopoea bonjeani
Powell, 1922 Univoltine Egg August-September March-July Yes Cedrus atlantica (Endl.) North of Africa Yousfi 1989
Thaumetopoea processionea
Linnaeus, 1758 Univoltine Egg August-September April-July Yes Quercus spp. Central and South Europe Pascual 1988a,b
Thaumetopoea solitaria
Freyer, 1838 Univoltine Egg August-November February-March No
Pistacea spp. and
Cypressus spp. East Mediterranean
Schmidt 1989
Thaumetopoea herculeana
Rambur, 1840 Univoltine Egg August-November Spring Yes Cistus spp.spp. and Erodium spp., Helianthemum Iberian Peninsula, North Africa and Palestine Schmidt 1989
Thaumetopoea pityocampa
Denis & Schiffermüller, 1775 Univoltine Pupa July-September September-March Yes Pinus spp. and Cedrus spp. Mediterranean Basin Schmidt 1989
Thaumetopoea wilkinsoni
Tams, 1924 Univoltine Pupa August-November October-March Yes Pinus spp. Cyprus, Israel and Jordan Schmidt 1989
Thaumetopoea jordana
Staudinger, 1894 Univoltine Pupa September-December November-March No Rhus tripartita (Ucria) Israel, Jordan and Saudi Arabia Halperin 1990
Ochrogaster lunifer
Herrich-Schäffer, 1855 Univoltine Pupa October-November November-May Yes Acacia spp.
and
Eucalyptus spp. Australia
Vegetation characteristics are the dominant factors in determining a forest bird community composition, distribution, and abundance (Holmes et al. 1986). A resource essential to the
community of cavity-nesters, an essential part of the insectivore’s guild in the forest, is the availability of trees containing cavities (Showalter and Whitmore 2001). Especially large trees with dead wood or with lightning scars are important for providing this resource (Ganey 1999). Due to modern forestry practices, managed forests consist of homogenous, even-aged stands of trees, where the systematic removal of such trees reduces the overall abundance, species diversity and richness of breeding and roosting birds (Lohr et al. 2002).
Great tit Parus major (L.) is a common cavity-nester all over Europe. It readily breeds in nest
boxes and, upon provisioning such boxes, most of the great tits in a study area will breed in them, resulting in the control of virtually the whole population (Lack 1964, Perrins 1965). This fact has made the species extremely suitable as a model organism for solving ecological and evolutionary questions, and it has been intensively studied during the last fifty years (e.g. Lack 1964, Perrins 1965, Sanz 1998, Pettifor et al. 2001, Tinbergen and Verhulst 2000). By
now, long-term studies on the breeding biology of the species are available (Boyce and Perrins 1987, McCleery and Perrins 1998) and its feeding ecology is well known. Great tits are largely insectivorous and are a Lepidoptera larvae specialist during the breeding season (Betts 1955, Gibb and Betts 1963, Royama 1970, Cowie and Hinsley 1988). The relationship between oak, winter moth, and great tits has been studied for many years in Central West Europe, and this three-step food chain is a classical example in forest ecology (van Noordwijk
et al. 1995, Buse et al. 1999).
Studies have connected great tit abundance and breeding performance to the abundance of its favourite prey (Seki and Takamo 1998, Naef-Daenzer and Keller 1999). Furthermore, great tits have been shown to be an effective predator on larvae, causing a reduction in larvae density and the damage to the primary producers (Murakami and Nakamo 2000, Mols and Visser 2002, Mols 2003). All these characteristics make the great tit potentially suitable as a pest control agent in young forest plantations where tree age homogeneity normally precludes breeding due to lack of natural breeding cavities.
1.6.Thesis outline
losses (Laurent-Hervouët 1986, Markalas 1998). The distribution of maritime pine monocultures are mainly restricted to the north of the Tejo River and two major spots can be identified: the Central Pines, located exactly in the central area of the country and the Atlantic Coastal Pines located at the North West coast of Portugal. A smaller P. pinaster forest is
found in the Setúbal Peninsula and thus, isolated from the other two areas. These three areas are known to have different climatic and geological characteristics, representing the main pine forests in the country and were therefore selected for this study of the population dynamics of
T. pityocampa during three seasons (1999-2002). The overall aim with the study was to assess
potential factors leading to outbreaks. This subject is developed in Chapter 2, with focus on the different mortality factors that are potentially important for the control of the population. This was done by monitoring the larval growth and development and assessing variation in the susceptibility of T. pityocampa attacks to different pine plantations, differing in location,
structure and climatic variables.
In 1997 a desynchronized population of T. pityocampa had an outbreak in the oldest National
Forest of the country, the National Pine Forest of Leiria, located in the area of the Atlantic coastal pines. Larvae of this abnormal population develop through the summer, being named the summer population (SP), while the normal version of the species develops through the winter, thus named the winter population (WP). The existence of this desynchronized population offers a unique opportunity to study the ecological and evolutionary factors behind its appearance and apparent success. This new version of T. pityocampa was also studied and
compared to the normal population coexisting in the National Pine Forest of Leiria (see Chapter 3).
Abiotic factors, mainly climatic variables are known to induce outbreaks of forest insects (Martinat 1987) and affect their dispersion patterns (Pedgley et al. 1989, Showers et al. 1989,
Pedgley and Yathos 1993). Factors connected with pine stand structure are also known to have great importance (Floater and Zalucki 1999), and Leiria is a national pine forest in which there is a good record of management operations during the last 30 years. The fact that the outbreak date of the Leiria desynchronized population of T. pityocampa is well known, and
that it occurred in a managed pine wood with good records allowed to explore this subjects, which was made in Chapter 4.
laboratory concerning the pupal period and adult phenology of both the winter populations and the abnormal summer population, allowing a comparison between them. The objective of this chapter is to understand biological and environmental factors that govern adult emergence timing in the normal WP and compare this with the desynchronized SP.
Great tit P. major, being a common cavity-nester and one of the most thoroughly studied bird
species, was the most logical choice for studying the third trophic level in the ecosystem dealt with in the present study. Furthermore, great tits are known to be a predator on T. pityocampa
(Gonzalez-Cano 1981). Thus, nest-boxes for P. major were placed in two of the areas -
Setúbal and Leiria – covering SP and WP distribution areas in order to study the population dynamic of this bird species and to assess the mutual influence on the T. pityocampa
2. Dynamics of pine processionary moth: comparison of different maritime
pine plantations in Central-South Portugal.
2.1. Introduction
The pine processionary moth T. pityocampa is an economically important pine pest in the
Mediterranean region (e.g. Schmidt et al. 1990). Severe pine defoliation caused by the
caterpillars frequently occurs, resulting into biomass loss and economic damage
(Laurent-Hervouët 1986, Markalas 1998). Additionally, this moth also affects humans, since late instar
larvae possess urticating hairs, which cause irritation to the skin and mucous membranes,
often leading to severe allergic reactions (Lamy 1990). T. pityocampa is considered part of the
native fauna and is normally present in pine stands across the country and is one of the most
important phytophagous insect known to cause visible damages to this forest.
The larvae are gregarious and develop through five instars during the winter months (e.g.
Schmidt et al. 1990). The caterpillars weave a silky nest, very important for their
thermoregulation during this cold and wet season (Breuer et al. 1989). At the end of the 5th
instar the larvae start a procession and pupate in the soil; a diapause occurs during the spring
(Schmidt et al. 1990). Adult emergence extends throughout the summer but the timing is
strongly dependent upon several factors, mainly altitude and latitude: at higher altitudes and
latitudes an earlier period of emergence occurs (Masutti & Battisti 1990, Devkota et al. 1992).
Pine forest had gain importance in the last decades in the Mediterranean Basin due to the fact
that pines are often invaders occupying the abandoned fields induced by the “set-aside” policy
of the European Union and burned areas (Barbéro et al. 1998). In Portugal maritime pine P.
pinaster covers about one million ha of the territory, which constitutes 98 % of the pine
stands, and most of this area originated from massive plantations occurred in the 19th century
(DGF 1999). Pure stands of this tree correspond to 65 % of all its area (DGF 2001). The Pine
Processionary Moth gained this way importance. However, information about Mediterranean
pine forest outbreaking species, its possible inducing and controlling factors and the
relationship with forest structure is very fragmented and rudimentary.
The appearance of outbreaks in forest Lepidoptera have been connected with climatic
extremes (Martinat 1987, Kamata 2000), variations in host quality (Haukioja 1980, Haukioja
forest structure (Bragança et al. 1998b, Floater and Zalucki 2000) and site quality (Kamata
2000, Alfaro et al. 2001). In the present work, a study was made on the population dynamics
and different factors with the potentiality of leading and/or controlling T. pityocampa
outbreaks in Central-South Portugal.
2.2. Material and Methods
2.2.1. Areas of study
P. pinaster stands located in three areas of Central and South Portugal were selected for this
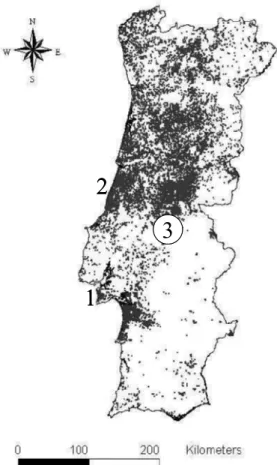
study (Fig. 2.1): Península de Setúbal, Abrantes and Leiria National Pine Forest. Preliminary
surveys indicated that T. pityocampa outbreaks are detected mainly in very young plots with
trees below 10 years, so stands of this age class were preferably selected for our study. In
Leiria, T. pityocampa nests are rarely detected in stands below this age, so plantations
between 10-15 years old were selected.
National Pine Forest of Leiria is located 200 km north of Lisbon (Latitude: 39º50´N,
Longitude: 8º57´W, Altitude: 30-50 m a.s.l.). It has an area of 11 023 ha, of which 10 828 ha
are covered by pine stands of P. pinaster. Part of the area, 8 702 ha, is managed to produce
high quality timber. The area close to the Atlantic Ocean evolves mainly by natural
regeneration, resulting in low tree density and low growth rates. In the XIII century King
Dinis included Leiria in the crown possessions and established the first management rules,
mainly because of the protective function of the pinewood for stabilising the dunes and
protect agricultural fields. However its origin probably predates this event (Ferreira and
Gomes 2000).
The management scheme presently in operation dates from the end of the XVIII century, with
some minor changes. The pinewood is divided into 334 rectangular plots of 30 to 40 ha each
(except on the border areas), which are the management units. The trees within a plot are
even-aged and the initial density is 2000–2500 trees.ha-1. Adjacent plots are often planted at
the same time, leading to large continuous areas with trees of the same age. Thinning is
practised according to management targets so that, by the time trees reach their ideal size at
about 80 years, tree density will be only 10 % of the initial one and a clear cut is made. Seven
3
2
1
3
2
1
3
2
1
Figure 2.1: Field site locations 1) Apostiça; 2) Leiria; 3) Abrantes. The black spots are the Pine forests in Portugal.
Apostiça, is a private forest property with total area of about 4 000 ha located in the Setúbal
Península, also close to the Atlantic Ocean but located south of Lisbon (38º30´N, 9º11´W, 35
m). The area has few P. pinea and Quercus suber (L.) spots, but is mostly a P. pinaster forest.
This forest is the result of major P. pinaster plantations made during the 30’s and 40’s.
Logging in part of the original stand, fires and natural regeneration has resulted in a low
density and a more diverse forest. For the present study areas with a large amount of young
trees were selected. Two spots 2000 m apart were selected: 1 - an area with high density of
young trees (around six years) resulting from a clear cut and natural regeneration; 2 - a stand
originating after a fire that occurred 20 years ago with a diverse age composition.
Two pine stands, separated by 60 km, were selected in theAbrantes region, Central Portugal.
Barrada in the Tejo River flats (39º26´N, 8º04´W, 162 m) is an eight ha P. pinaster stand aged
seven years. This small stand was surrounded by older pine stands, an olive tree stand and a
E. globulus stand. Pucariça (39º32´N, 8º15´N, 230 m), is located north of the Tejo River, in
the border of an area called the Central Pine, the largest continuous P. pinaster forest in
Portugal (and in the World) that was the result of massive plantations made during the IXX
Overall the Abrantes area has more a continental climatic type. Typically temperatures reach
the lowest levels in the winter and the highest in the summer, with more number of days of
frost per year. Setúbal Peninsula is more Mediterranean, with lower precipitation, and higher
Global radiation and number of hours of sun per year. Leiria represents the coastal Atlantic
area at north of Lisbon. It has a soft weather, with lower temperature fluctuations along the
year, higher precipitation and higher air moisture content (Table 2.1).
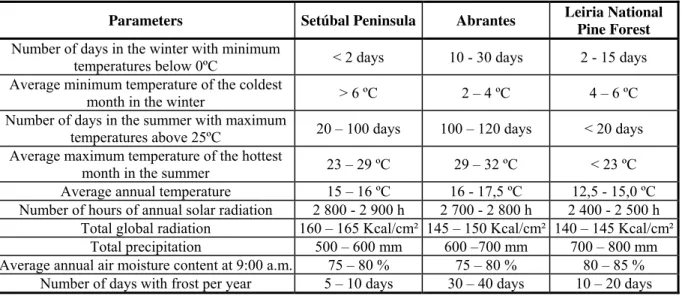
Table 2.1: Climatic characterization of the three areas included in this study (Instituto do Ambiente 2003).
Parameters Setúbal Peninsula Abrantes Leiria National
Pine Forest
Number of days in the winter with minimum
temperatures below 0ºC < 2 days 10 - 30 days 2 - 15 days Average minimum temperature of the coldest
month in the winter > 6 ºC 2 – 4 ºC 4 – 6 ºC Number of days in the summer with maximum
temperatures above 25ºC 20 – 100 days 100 – 120 days < 20 days Average maximum temperature of the hottest
month in the summer 23 – 29 ºC 29 – 32 ºC < 23 ºC Average annual temperature 15 – 16 ºC 16 - 17,5 ºC 12,5 - 15,0 ºC Number of hours of annual solar radiation 2 800 - 2 900 h 2 700 - 2 800 h 2 400 - 2 500 h
Total global radiation 160 – 165 Kcal/cm² 145 – 150 Kcal/cm² 140 – 145 Kcal/cm² Total precipitation 500 – 600 mm 600 –700 mm 700 – 800 mm Average annual air moisture content at 9:00 a.m. 75 – 80 % 75 – 80 % 80 – 85 %
Number of days with frost per year 5 – 10 days 30 – 40 days 10 – 20 days
2.2.2. Precipitation data
Total precipitation was obtained from stations located near the studied sites: Leiria -Latitude:
39º50´N, Longitude: 8º53´W, Altitude: 52 m a.s.l.; Pucariça - Latitude: 39º32´N, Longitude:
8º20´W, Altitude: 127 m a.s.l.; Barrada - Latitude: 39º27´N, Longitude: 8º12´W, Altitude:
190 m a.s.l.; Apostiça - Latitude: 38º28´N, Longitude: 9º5´W, Altitude: 120 m a.s.l.. Total
precipitation is the amount of precipitation, which reaches the ground in a specific period of
time and is measured in millimetres with rain gauges.
2.2.3. Field surveys
The present study was based on survivorship and densities during the larval development in
the field. Other similar studies on tent building caterpillars were based on colony
1999, Ruf 2002). The assumption behind this measure is that, in highly social caterpillars,
individual survivorship is closely tied to that of the group. However, preliminary surveys
indicated striking differences in tree defoliation in the different areas studied. Thus, knowing
how many individuals were causing the defoliation in each tree seems to be an important
population dynamic parameter. To count and weigh caterpillars, nests were collected in the
field and handled in the laboratory. Thus, this study is not based on the survivorship of a
certain number of colonies in the field, but on the average variation in numbers of caterpillars
in the different larval stages.
The study was made during three seasons between 1999 and 2002. During the larval period,
samples of T. pityocampa nests and egg-batches were collected monthly from P. pinaster
trees. The samples were always taken at the same location in each stand: in Leiria, in four
plots located in the central and northern area of the wood; in Apostiça, at two locations of
young trees in area 1 and 2, although in area 1 samples were only taken during the two last
seasons; in Barrada and Pucariça, at one location for each stand.
Sampling occurred during five months, between October and February, covering the whole
larval period. During the season 1999/00, samples of nests and egg-batches were taken
randomly from the trees: 3 to 12 nests in each sampling location and all the egg-batches we
could find, thus the sampling unit was nest/ egg-batch not tree.
In the last two seasons (2000/01 and 2001/02) samples were collected per tree. For each
sampling date and sampling location, 3-12 attacked trees either with nests or showing signs of
larval grazing, were randomly selected and all nests and egg batches were collected. The
orientation of egg-batches and larval nests was recorded as heading towards NE, SE, SW, NW
or along the axis of the tree. The nests and egg-batches which were along the tree axis or
towards SE and SW were considered to be in the sunny part of the tree and the ones located at
NE and NW were considered to be in the shade part of the tree.
After the larval period was completed (starting in March), an estimate of the attack level by T.
pityocampa was made, expressed as the proportion of trees attacked and the number of
nests.ha-1. The diameter at breast height (DBH) of all trees within a specified area (see below)
was measured and the number of nests present on each tree and its orientation recorded
always covered an area different from the one where the nests had been collected. This data is
not available for the first season (1999/00) in Apostiça.
At the three sampling locations in Leiria, two transects with 15 m width were sampled, which
followed two perpendicular axes inside the plot (between 1.35 and 1.99 ha in each plot
summing to a total area of 12.77 ha). In Apostiça the measurements were made inside two
squares of 50x50 m in Area 1 (a total of 0.5 ha), and three transects, 15 m wide and 760-960
m long, in Area 2 (a total of 3.78 ha). In Pucariça, we sampled inside four squares with an
area between 0.10 and 0.18 ha (a total of 0.52 ha) and in Barrada inside two squares of 40x40
m (a total of 0.32 ha).
2.2.4. Laboratory
In the laboratory the structural characteristics of the egg-batches were recorded. The scale
cover was removed from each egg-batch and the number of lines and number of eggs in a
sample of lines were recorded. From this, the number of eggs per batch could be estimated.
Furthermore, those eggs that did not hatch were counted and the number of eggs that were
parasitized was annotated (black or with an emergence hole). Emerged parasitoids in the
laboratory were identified.
For each population and season, 10 egg batches were randomly selected to measure egg
volume. Egg length and width were measured at 70-fold magnification and egg size is
reported as the volume of the egg (mm3) assuming the egg to be a prolate spheroid and using
the formula V=1/6πw2L, where w is the egg width and L is the egg length (Berrigan 1991,
García-Barros 2000).
The pine needles around which the females wrap their egg-batches constitute the first source
of food for the newly hatched caterpillars. Since these needles eventually will dry and have a
tendency to fall from the tree, the calculation of the number of eggs per tree, mortality of all
batches and survival of the early larval instars were restricted to trees sampled in October and
November. These calculations were only made during the last two seasons (2000/01 and
2001/02) because only then were the samples made on a per tree basis.
Each collected nest was opened and the larvae separated according to instar and counted.