Mílton Jorge Santos Cordeiro
Mestre em Biotecnologia
Gold NanoBeacons for Spectral
Codification – Application as a DNA
Sensor
Dissertação para obtenção do Grau de Doutor em Biotecnologia
Orientador: João Carlos Lima, Professor Associado com agregação, FCT-UNL
Co-orientador: Pedro Viana Baptista, Professor Associado com agregação, FCT-UNL
Júri:
Presidente: Prof. Doutor Maria João Lobo de Reis Madeira Crispim Romão. Arguentes: Prof. Doutor Manuel José Estevez Prieto.
Prof. Doutor Jorge Miguel de Ascenção Oliveira. Vogais: Prof. Doutor Nuno Correia dos Santos.
Prof. Doutor Maria João Lobo de Reis Madeira Crispim Romão.
Universidade Nova de Lisboa
Faculdade de Ciências e Tecnologia
Gold NanoBeacons for Spectral Codification -
Application as a DNA Sensor
Mílton Jorge Santos Cordeiro
supervised by
Prof. João Carlos Lima
Prof. Pedro Viana Baptista
“Gold NanoBeacons for Spectral Codification – application as a DNA sensor“
“Copyright” em nome de Mílton Jorge Santos Cordeiro, da FCT/UNL e da UNL
The work presented in this Thesis was funded by the Doctoral Fellowship SFRH/BD/87836/2012 financed by the Portuguese Foundation for Science and Technology – Ministry of Science, Technology and Higher Education.
The research performed during this fellowship was published in International Peer-Reviewed Scientific Journals.
1. Cordeiro M.; Carvalho L.; Silva J.; Saúde L.; Fernandes A.R.; Baptista P.V. Gold Nanobeacons for Tracking Gene Silencing in Zebrafish. Nanomaterials 2017,7, 10.
2. Vinhas R.; Cordeiro M.; Pedrosa P.; Fernandes A.R.; Baptista P.V. Current trends in molecular diagnostics of Chronic Myeloid Leukemia. Leukemia lymphoma 2016, 0,0, 1-14.
3. Cordeiro M.; Carlos F.F.; Pedrosa P.; Lopez A.; Baptista P.V. Gold Nanoparticles for Diagnostics: Advances Towards Point-of-Care. Diagnostics 2016, 6, 43.
4. Cordeiro M.; Giestas L.; Lima J.C.; Baptista P.M.V. BioCode gold‑nanobeacon for the detection of fusion transcripts causing chronic myeloid leukemia. Journal of Nanobiotechnology 2016, 14, 38.
5. Larguinho M.; Canto R.; Cordeiro M., Pedrosa P., Fortuna A., Vinhas R., Baptista P.V. Gold nanoprobe-based non-crosslinking hybridization for molecular diagnostics. Expert Rev. Mol.
Diagn. 2015, 15, 10,1355–1368.
6. Cordeiro M.; Vinhas R.; Carlos F.F.; Mendo S.; Fernandes A.R.; Figueiredo S.; Baptista P.V. Gold nanoparticle-based theranostics: disease diagnostics and treatment using a single nanomaterial,
Nanobiosensors in Disease Diagnosis 2015, 4, 11–23.
II
Agradecimentos
Esta tese é dedicada à Rita. Porque só tu sabes de que foi feito este percurso. Só te posso agradecer pela força, motivação e constante presença. Fazes de mim uma pessoa melhor. E mais importante que tudo, pelo Vasco.
Vasco, fizeste-me perceber o que de facto é importante.
Pai e Mãe. Não há palavras que possam transmitir a minha gratidão por tudo o que vocês fizeram por mim. Vocês são o melhor que alguém pode desejar.
Bruno. Apesar da distância, continuas a ser o ‘Mamajero’.
Aos Meus Orientadores, João Carlos Lima e Pedro Viana Baptista. Espero ter adquirido uma fracção do conhecimento com que me presentearam todos os dias. São um exemplo que vou para sempre recordar.
Letícia. Não sabes o quanto fizeste por mim.
Rosa, Larguinho, Fábio, Raquel, Sara. Rita ‘tu é que és’, Veigas, Gonçalo, Conde, Pedrosa e Sofia. Porque aprendi com vocês o que significa ser parte de uma equipa. Nenhum grupo chega perto do 315.
André, Pekas, Lois, Kebra, Bana, Toni, … O tempo passa, mas aqui estamos.
IV
Abstract
The use of gold nanoparticles (AuNPs) to develop sensing platforms for the detection of nucleic acids has gained momentum for the past decade. This is due to unique physical properties of AuNPs, such as intense optical modulation, coupled to the possibility of tailoring their reactivity through surface modification.
The main objective of this thesis was to develop a biosensor based on the gold nanobeacons technology coupled to wavelength shift mediated by Förster resonance energy transfer (FRET). As a proof-of-concept, the molecular hallmark of Chronic Myeloid Leukemia (CML) - the BCR-ABL fusion gene - was chosen as target. The detection is based on a spectral shift of the donor signal to the acceptor, which allows the corroboration of the hybridization event. The Au-nanobeacon acts as a scaffold for detection of the target in a homogenous format whose output capability (i.e. additional layers of information/NP) is potentiated via the specific FRET signal. To do so, the design of the conventional molecular beacon was changed into a two-component system comprising 1) a donor labeled single-strand DNA with a hairpin structure and 2) an acceptor labeled oligonucleotide that hybridizes to the open state of the hairpin. This system was optimized to allow the specific detection of the fusion sequences and not be triggered by the partial non-fused sequence and, subsequently, hybridize to an acceptor-labeled oligo that identifies which hairpin was triggered in solution. The spectral coded Au-nanobeacons (BioCode) allowed the detection of synthetic pathogenic fusion sequences (with high specificity towards partial complementary sequences), using two distinct fluorescence signals (FRET signal and a partial recovery of the donor emission) over the same hybridization event.
Translation of this BioCode strategy to intracellular signaling was also attempted in a theranostic approach. Here, the specific gene silencing and tracking the silencing events via the beacon’s emission. Conceptually, silencing of the enhanced green fluorescence protein (EGFP) mRNA in zebrafish embryos, followed by application to CML cell lines.
VI
Resumo
O uso de nanopartículas de ouro para o desenvolvimento de plataformas de deteção de ácidos nucleicos baseado em fluorescência tem sido alvo de investigação intensa nas ultimas décadas. Isto deve-se às suas propriedades físicas únicas, como a modulação da fluorescência de fluoróforos vizinhos, acoplada à possibilidade de modificar a sua reatividade através da alteração/funcionalização da sua superfície.
Esta tese teve como objetivo principal, o desenvolvimento de um biossensor baseado na tecnologia de nanobeacons (faróis moleculares) de ouro e acoplar um mecanismo de transição de sinal mediado por FRET (Transferência de energia por ressonância de Förster). Como prova de conceito, esta plataforma foi otimizada para a deteção das sequências de fusão BCR-ABL associadas ao desenvolvimento de Leucemia Mielóide Crónica (CML). O princípio de deteção é baseado na mudança espectral devido à transferência de energia entre o fluoróforo doador e o fluoróforo aceitante, o que permite a corroboração da ocorrência de hibridação. O Au-nanobeacon atua como uma matriz de deteção do alvo em meio homogéneo em que o sinal de deteção é potenciado através do sinal FRET específico gerado. Para tal, o design de faróis moleculares convencional foi transformado num sistema de dois componentes: 1) uma molécula de DNA em cadeia simples marcada com o fluoróforo dador com uma estrutura de hairpin; e 2) um oligonucleótido marcado com aceitador que apenas é capaz de hibridar com o estado aberto do hairpin. Este sistema foi otimizado para: a) permitir a deteção específica das sequências de fusão e não ser desencadeado pelas sequências parciais não fundidas; b) permitir a hibridação de um oligonucleótido marcado com o fluoróforo aceitante. O sinal de fluorescência gerado pela ocorrência de transferência de energia identificará qual sequência está presente em solução. O Au-nanobeacons com esta codificação espectral (BioCode) permitiu a deteção de cada uma das sequências de fusão patogénicas sintéticas, usando dois sinais de fluorescência distintos (sinal FRET e recuperação parcial da emissão do doador) para o mesmo evento de hibridação.
A utilização dos nanoconstructos desenvolvidos foi aplicada numa abordagem de teragnóstico, em que o silenciamento de mRNA da uma green fluorescence protein (EGFP) em embriões de uma linha transgénica de peixe zebra fli-EGFP foi visualizada e rastreada via a sinalização do farol (nano)molecular. A mesma abordagem foi aplicada em linhagens humana de CML.
VIII
Table of contents
Agradecimentos ... II
Abstract ... IV
Resumo ... VI
Table of contents ... VIII
Table of Figures ... XIV
Table index ... XX
Abbreviations and symbols ... XXII
1 General Introduction ... 1
Light ... 3
Light absorption ... 4
Fluorescence ... 8
Steady-state and Time-resolved fluorescence ... 12
Fluorescence intensity variation ... 12
Energy transfer systems ... 14
Spectral codification ... 17
NanoBiotechnology ... 21
Synthesis and functionalization ... 22
Optical properties ... 25
Interaction of AuNP with fluorophores ... 27
Other properties ... 28
Fluorescence-based nanodiagnostics ... 29
Nucleic acids sensing ... 30
Protein sensing ... 32
AuNP based fluorescence biosensors ... 32
Chronic Myeloid Leukemia ... 35
IX
2 Materials and Methods ... 39
General information ... 41
Fluorophore selection... 42
Oligonucleotides ... 42
Hairpin Characterization ... 45
Fluorescence spectroscopy ... 45
Electrophoretic Mobility Shift Assay ... 46
Isothermal Titration Calorimetry ... 46
MicroScale Thermophoresis ... 47
Small-Angle X-ray Scattering ... 47
Gold nanoparticles synthesis ... 48
Gold nanoparticle functionalization ... 49
AuNP functionalization with PEG - Ellman saturation curve ... 49
PEGylated AuNP functionalization with hairpins ... 49
PEGylated AuNP dual functionalization with hairpins ... 50
Au-nanobeacon characterization ... 50
Quantification of PEG molecules per NP ... 50
Quantification of Oligonucleotides per NP ... 51
Transmission Electron Microscopy ... 51
Dynamic Light Scattering... 51
Zeta Potential ... 52
BioCode synthetic target detection ... 52
Target detection using BioCode with one acceptor ... 52
Acceptor titration against double labeled BioCode ... 53
Target detection using double labeled BioCode and one acceptor ... 53
Target detection using double labeled BioCode and two acceptors ... 53
X
Human lymphoblastic cell culture maintenance ... 54
Total RNA extraction ... 54
Reverse transcription ... 55
PCR from cDNA ... 55
Asymmetric PCR ... 56
Detection of fusion sequences ... 56
3 Design of two-component molecular beacon as bioreceptor for fusion sequence biomarker for Chronic Myeloid Leukemia ... 57
Introduction ... 59
Fluorophore selection... 60
Oligonucleotide in silico design ... 63
Fluorescence assessment of the designed hairpins ... 67
Design optimization ... 67
Specificity and selectivity of the designed sequences. ... 73
Mixture characterization ... 78
Binding affinity characterization ... 81
Isothermal Titration Calorimetry ... 81
MicroScale Thermophoresis ... 86
Analysis of the ensemble formation through SAXS and electrophoretic mobility. ... 89
Conclusion ... 95
4 BioCode Gold-Nanobeacon for the detection of fusion transcripts causing Chronic Myeloid Leukemia ... 97
Introduction ... 99
AuNP characterization ... 100
Optimization of AuNP surface coverage with thiolated Poly-ethylene Glycol ... 102
BioCode Au-nanobeacon characterization... 105
BioCode SAXS/SANS characterization ... 113
XI
Acceptor titration against double labeled Biocode ... 121
Target detection using double labeled BioCode ... 124
Target detection using double labeled BioCode and two acceptors ... 128
BioCode RNA detection ... 131
Conclusion ... 135
5 Gold Nanobeacons for in Vitro Imaging and Tracking Gene Silencing in Zebrafish ... 137
Introduction ... 139
Methodology ... 140
Synthesis and functionalization of AuNPs ... 140
Ethics statement ... 140
In Vitro imaging of Au-nanobeacon within human cell line ... 140
Zebrafish line ... 141
Microinjection of zebrafish embryos ... 141
Silencing and imaging ... 141
Toxicity assessment in zebrafish embryos ... 142
Results and Discussion ... 142
Gold nanobeacons for in Vitro Imaging ... 142
Synthesis and characterization of the Au-Nanoconjugates for EGFP silencing in zebraFish 144 Silencing efficiency ... 146
Toxicity in zebrafish embryos ... 148
Conclusions ... 148
6 General conclusions and future perspectives ... 151
7 References ... 157
8 Appendix ... 181
Appendix I ... 183
Appendix II ... 184
XII
Appendix IV ... 197
Appendix V ... 198
Appendix VI ... 203
Appendix VII ... 206
Appendix VIII ... 207
Appendix IX ... 208
Appendix X ... 209
Appendix XI ... 211
XIV
Table of Figures
Figure 1.1. Schematic representation of the possible ways non-ionizing electromagnetic radiation
interacts with matter. 4
Figure 1.2. Schematic representation of vertical electronic transitions generated from absorption
of photons with wavelengths in the UV-Vis range. 6
Figure 1.3. Jablonski diagram. Upward facing straight arrows represents the electronical
excitation of electrons to higher energy orbitals. 9
Figure 1.4. Absorption and emission spectra of 6-carboxyfluorescein with ~25 nm Stokes shift. 10
Figure 1.5. Schematic representation of the overlap between the donor emission spectrum and
the acceptors absorption spectra. 15
Figure 1.6. Graphical representation of the distance-dependent energy transfer efficiency and its
relation to R0. 16
Figure 1.7. Surface plot of the square difference between the theoretical and fitting coefficients
for all the possible combination. 19
Figure 1.8. Representation of ideal direct excitation versus the occurrence of cross-excitation of
the several fluorophores in solution at the excitation wavelengths. 20
Figure 1.9. Schematic representation of the biomolecules that can be functionalized on the surface
of AuNP. 24
Figure 1.10. Schematic representation of metal nanoparticles in localized surface plasmon
resonance (LSPR). 26
Figure 1.11. Representation of the cross-linking method developed by Mirkin et al. 30
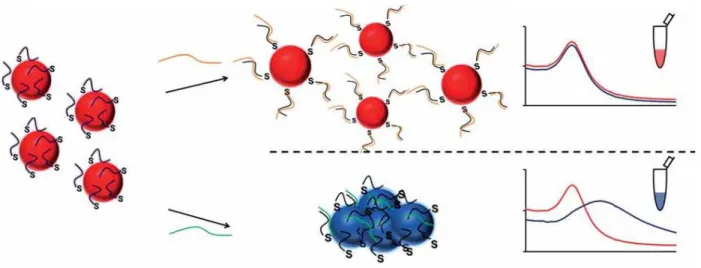
Figure 1.12. Representation of the non-cross link method developed by Baptista et al. 31
Figure 1.13. Schematic representation of the BCR-ABL translocation. 36
Figure 3.1. Working principle of the conventional molecular beacon. 61
Figure 3.2. Normalized absorption and emission spectra of the used fluorophores and absorption
spectra of AuNP. 63
Figure 3.3. Schematic representation of fusion region of the most common BCR-ABL fusion
sequences and localization of detection probe. 65
Figure 3.4. Schematic representation of the recognition principle used in the developed biosensor. 66
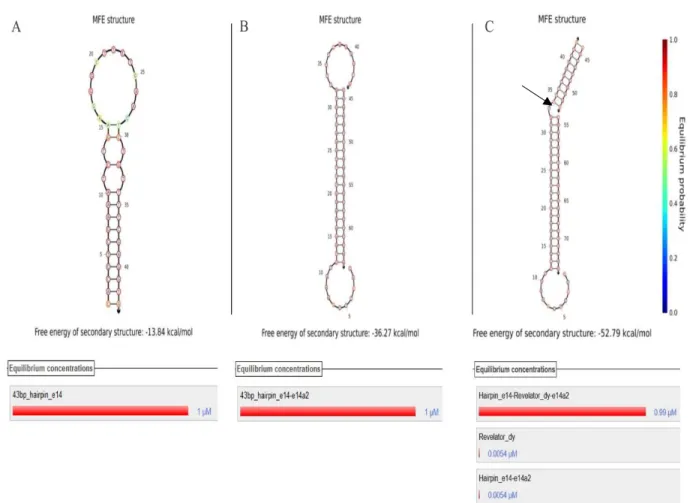
Figure 3.5. In silico assessment of hybridization for the designed sequences of pair 2. 67
Figure 3.6. In silico simulation of equilibrium concentrations for the hairpin/revelator pair 2 and
XV Figure 3.7. Emission variation of the donor and acceptor emission as a function of time and
temperature 72
Figure 3.8. Signal variation of donor and acceptor in the presence of different targets for
hairpin/revelator pair 2. 75
Figure 3.9. Signal variation of donor and acceptor in the presence of different targets for
hairpin/revelator pair 3. 76
Figure 3.10. Signal variation of fluorophore pairs FAM/Dy and Cy3/Dy in the presence of
different targets for hairpin/revelator pair 4 and 5, respectively. 77
Figure 3.11. Specificity assessment of the 10bp revelator for 43bp_hairpin_e13 and
43bp_hairpin_e14. 79
Figure 3.12. Emission spectra of a mixture containing hairpin/revelator 3 and 4 in the presence
of various targets. 82
Figure 3.13. Isothermal titration calorimetry injection profile and binding isotherms of the
formation of the tcMB towards fusion sequence e13a2. 84
Figure 3.14. Schematic representation of MST setup and experiments. 88
Figure 3.15. Determination of binding affinities for the hybridization of the target e14a2 and
revelator sequence to the fam labeled 43bp_hairpin_e14. 89
Figure 3.16. Experimental SAXS patterns (dots with error bars) and scattering calculated from
the ab initio models (continuous line). 93
Figure 3.17. Ab initio models of the hairpin (magenta), disrupted hairpin after target hybridization
(green) and final ensemble (blue). 94
Figure 3.18. Acrylamide gel electrophoresis of the isolated hairpin, intermediate ensemble and
final ensemble. 95
Figure 4.1. Schematic representation of the BioCode Au-nanobeacon. 101
Figure 4.2. Characterization of citrate-capped AuNPs. 103
Figure 4.3. Donor signal variation upon incubation with the complementary target. 106
Figure 4.4. Hydrodynamic diameter of AuNP@citrate and Au-nanobeacon (from
BioCode-43bp-e14-FAM-1) in different conditions. 107
Figure 4.5. Representation of the solvation shell of the AuNP in the different phases of
functionalization. 108
Figure 4.6. Characterization of the BioCode-43bp-e13-FAM and BioCode-43bp-e14-Cy3 and
comparison with AuNP@citrate and AuNP@45% PEG. 110
XVI Figure 4.8. Characterization of the BioCode-47bp-e13-FAM and BioCode-47bp-e14-Cy3,
formed using pair 6 and 7. 112
Figure 4.9.Characterization of the double-labeled BioCode, formed using pair 6 and 8. 114
Figure 4.10. SAXS scattering data (points) and GNOM fit (line) for AuNP functionalized with
the full biosensor ensemble for e13a2 (hairpin, target and revelator). 116
Figure 4.11. Hybridization assays of BioCode-43bp-e14-FAM in presence of different target
sequences. 118
Figure 4.12. A) Emission spectra after hybridization in different reaction condition using BioCode-e13. B) Emission spectra after hybridization in different reaction condition using
BioCode-e14. 119
Figure 4.13. Hybridization assays of Biocode-43bp -e13-FAM in presence of different target
sequences. 121
Figure 4.14. Schematic representation of the working principle of the double labeled BioCode
Figure 4.15. Emission spectra of double-labeled BioCode incubated with an excess of the fully
complementary target or non-complementary target titrated with Dy labeled revelator. 125
Figure 4.16. Emission spectra after hybridization in different reaction condition using double
labeled BioCode in the presence of the e13a2 (A) and e14a2 (B) fusion sequence. 126
Figure 4.17 Hybridization assays of double-labeled BioCode in presence of different target
sequences. 128
Figure 4.18. Dose response curve of double-labeled BioCurve in the presence of either the e13a2
or e14a2 fusion sequence in the presence of each respective revelator. 129
Figure 4.19. Emission spectra after hybridization in different reaction condition using the
double-labeled oligonucleotide. 131
Figure 4.20. A) Acceptor emission after the incubation of the different targets with the double-labeled BioCode fitted with the isolated emission bands of the acceptors. B) Coefficient table of
the fitted spectra. 132
Figure 4.21. Coefficient values obtained through the fitting of the isolated spectrum of each
fluorophore to the experimental spectra obtained after the incubation with different targets. 133
Figure 4.22. Signal variation of BioCode-47bp-e13-FAM incubated with RNA derived from
BV173 cell lines. 136
Figure 4.23. Signal variation of double-labeled BioCode incubated with total RNA. 137
Figure 5.1. A) Fluorescent photos of K562 cell lines in the tested condition. B) Mean fluorescence
intensity per cell of the tested condition. 145
XVII Figure 5.3. Au-nanobeacon silencing efficiency of the enhanced green fluorescence protein
(EGFP) and acute toxicity assessment. 149
Figure I.1. Extinction coefficient determination of ROX fluorophore bound to revelator sequence. 176 Figure I.2. Extinction coefficient determination of Dy – 520 Xl MegaStockes fluorophore bound
to revelator sequence. 177
Figure II.1. In silico assessment of hybridization of the designed sequences of pair 1 using the
software NUPACK. 178
Figure II.2. In silico simulation of equilibrium concentrations for the hairpin/revelator pair 1 and
different targets using 1 µM of each component. 179
Figure II.3. In silico assessment of hybridization of the designed sequences of pair 3 using the
software NUPACK. 180
Figure II.4. In silico simulation of equilibrium concentrations for the hairpin/revelator pair 3 and
different targets using 1 µM of each component. 181
Figure II.5. In silico assessment of hybridization of the designed sequences of pair 6 using the
software NUPACK. 182
Figure II.6. In silico simulation of equilibrium concentrations for the hairpin/revelator pair 6 and
different targets using 1 µM of each component. 183
Figure II.7. In silico assessment of hybridization of the designed sequences of pair 7-8 using the
software NUPACK. 184
Figure II.8. In silico simulation of equilibrium concentrations for the hairpin/revelator pair 3 and
different targets using 1 µM of each component. 185
Figure IV.1. Hybridization assays of pair 1 in different buffers. 190
Figure V.I. Signal variation of donor and acceptor in the presence of different targets for
hairpin/revelator pair 6. 191
Figure V.II. Signal variation of donor and acceptor in the presence of different targets for
hairpin/revelator pair 7. 192
Figure V.III. Signal variation of donor and acceptor in the presence of different targets for
hairpin/revelator pair 8. 193
Figure V.1V. Melting profile of the hairpin/revelator pairs 4 and 3. 194
Figure V.V. Melting profile of the hairpin/revelator pairs 4 and 3. 195
Figure VI.1. Isothermal titration calorimetry of e14a2 sequence to 43bp_hairpin_e14. 196
Figure VI.2. Isothermal titration calorimetry of revelator sequence to complex
XVIII Figure VII.1. Initial fluorescence assessment of the 16 capillaries used to determine the binding
affinity of the target e14a2 and 43bp_hairpin_e14.
199
Figure VII.2. MST profile of the cross-reactivity test between the target e13a2 and the
43bp_hairpin_e14. 199
Figure VIII.1. Agarose gel electrophoresis of the tested scenarios. 200
Figure IX.1. Calibration curve used for the quantification of thiolated PEG in the supernatant. 201
Figure IX.2. Saturation curve of PEG functionalization. 201
Figure X.1. Calibration curve for the quantification of the number of hairpins per AuNP. 202
Figure X.2. Characterization performed for BioCode-47bp-e14-FAM. 203
Figure XI.1. Hybridization assays of Biocode-43bp -e14-Cy3 in presence of different target
sequences. 204
Figure XI.2. Hybridization assays of Biocode-43bp -e14-FAM in presence of different target
sequences. 205
Figure XI.3. Hybridization assays of Biocode-47bp -e13-FAM in presence of different target
sequences. 206
Figure XI.4. Hybridization assays of Biocode-47bp -e14-Cy3 in presence of different target
sequences. 207
Figure XI.5. Hybridization assays of Biocode-47bp-e14-FAM in presence of different target
sequences. 208
Figure XI.6. Hybridization assays of double-labeled BioCode in presence of different target
sequences (e14a2 as complementary target). 209
Figure XI.7. Hybridization assays of double-labeled BioCode in presence of different target
sequences (e13a2 as complementary target). 210
Figure XI.8. Emission spectra of the acceptor in the presence and absence of a fully
complementary target, after the subtraction of the donor emission. 211
Figure XI.9. Emission spectra of double-labeled BioCode incubated with an excess of the fully
complementary target or non-complementary target titrated with ROX-labeled revelator. 212
Figure XII.1. Agarose gel electrophoresis of retrotranscript nested-PCR products of the e14a2
(360 bp) and e13a2 (285 bp) fusion transcripts. 213
Figure XII.2. Signal variation of BioCode-47bp-e14-Cy3 incubated with RNA derived from
k-562. 214
XIX Figure XII.4. Signal variation of double-labeled BioCode incubated with non-purified
asymmetric PCR product. 216
Figure XII.5. Signal variation of double-labeled BioCode incubated with purified asymmetric
XX
Table index
Table 1.1. Common covalent immobilization strategies for AuNP functionalization. 25
Table 2.1. Unmodified oligonucleotides. 43
Table 2.2 Sequences of donor labeled hairpins and revelator accessed experimentally. 44
Table 2.3 Condition used to evaluate the formation of the desired structure. 45 Table 3.1. Förster distance of FRET pairs used and theoretical ΦET at different distances. 64 Table 3.2. Fold change in the emission of the donor and acceptor fluorophores after 2 hours of
incubation in the tested conditions. 70
Table 3.3. Fitting coefficients derived from spectra presented on Figure 3.12. 82
Table 3.4. Parameters derived from the ITC experiments of 43bp_hairpin_e13 binding to e13a2
sequence at 20 °C. 85
Table 3.5. The overall structural parameters estimated from SAXS data. 92
Table 4.1. Fold variation of donor and acceptor channels of the formulated BioCodes after target
addition. 122
Table 4.2. Fold variation of donor and acceptor channels of double-labeled Biocode after target
addition. 129
Table III.1. In silico simulations of the designed sequences. 187
Table III.1. In silico simulations of the designed sequences (cont1). 188
XXII
Abbreviations and symbols
ABL Abelson murine leukemia
ASO Anti-sense oligonucleotide
AuNP Gold nanoparticle
AuNP@citrate Citrate-capped gold nanoparticle
AuNP@PEG Gold nanoparticle functionalized with polyethylene glycol
BCR Breakpoint Cluster Region
bp Base pair
DEPC Diethyl pyrocarbonate
DLS Dynamic light scattering
DMEM Dulbecco's Modified Eagle's medium DTNB 5,5'-dithio-bis-[2-nitrobenzoic acid]
DTT Dithiothreitol
EGFP Enhanced green fluorescence protein EMSA Electrophoretic mobility shift assay
FBS Fetal bovine serum
FRET Förster resonance energy transfer ITC Isothermal titration calorimetry LSPR Localized surface plasmon resonance
MST Microscale thermophoresis
NC Non-complementary
NSET Nano surface energy transfer NTP Nucleoside triphosphate
PEG Polyethylene glycol
PMT Photomultiplier
POS Positive reaction
RPMI Roswell Park Memorial Institute
RT Room temperature
SAXS Small-Angle X-Ray Scattering
TAE Tris-acetate-EDTA
tcMB Two component molecular beacon
XXIII ΦET Energy transfer efficiency
1
2 Some of the literature review presented within this Chapter was derived from the following publications:
1. Vinhas R.; Cordeiro M.; Pedrosa P.; Fernandes A.R.; Baptista P.V. Current trends in molecular diagnostics of Chronic Myeloid Leukemia. Leukemia lymphoma 2016, 0,0, 1-14.
2. Cordeiro M.; Carlos F.F.; Pedrosa P.; Lopez A.; Baptista P.V. Gold Nanoparticles for Diagnostics: Advances Towards Point-of-Care. Diagnostics 2016, 6, 43.
3. Larguinho M.; Canto R.; Cordeiro M., Pedrosa P., Fortuna A., Vinhas R., Baptista P.V. Gold nanoprobe-based non-crosslinking hybridization for molecular diagnostics. Expert Rev. Mol.
Diagn. 2015, 15, 10,1355–1368.
4. Cordeiro M.; Vinhas R.; Carlos F.F.; Mendo S.; Fernandes A.R.; Figueiredo S.; Baptista P.V. Gold nanoparticle-based theranostics: disease diagnostics and treatment using a single nanomaterial,
3
Light
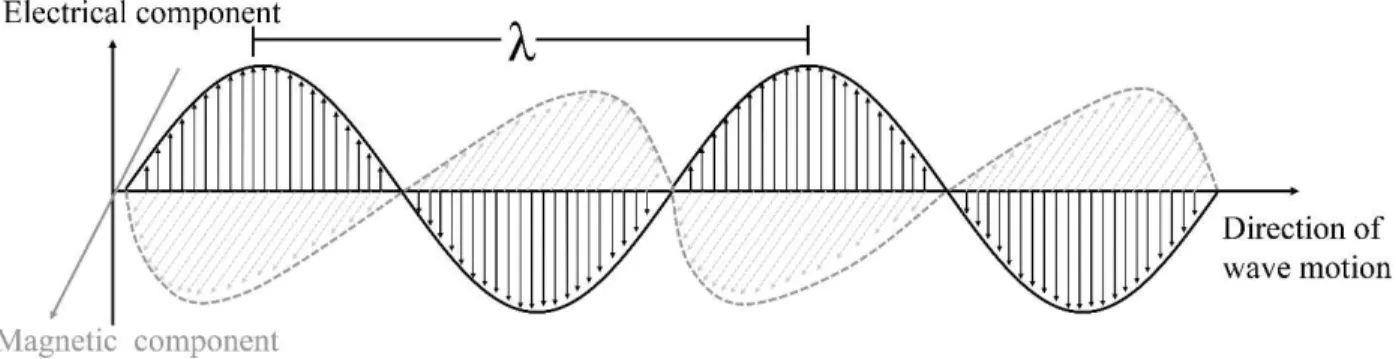
The electromagnetic radiation (ER) can be viewed as oscillating electric and magnetic field in perpendicular planes that radiates perpendicularly from the direction of the wave propagation – see Figure 1.1. These fields are generated by electric charges in non-uniform movement. This type of oscillations are self-perpetuating considering that the electric oscillation generates the magnetic moment which in turns regenerates the electric field ER (1).
The type of ER is defined by its wavelength (separation of consecutive maxima of one complete revolution - λ) and the full ER spectrum is comprised of distinct types of radiation (gamma ray, X-ray, ultraviolet light (UV), visible light (Vis), infra-red (IR), microwave and radio waves).
Figure 1. Representation of a monochromatic, plane polarized electromagnetic wave. Black arrows represent the electrical vector (electric component) and the gray arrows represent the magnetic vectors (magnetic component).
Considering a constant velocity for light propagation (c≈3.00×10⁸ m/s), the energy (E) of each type of radiation is inversely proportional to its frequency (ν) as shown in Equation 1.1 and 1.2, where ℎ denotes the Plank constant (6.626 × 10⁻³⁴ J.s) (1)
ν =
𝐶λ Equation 1.14
Light absorption
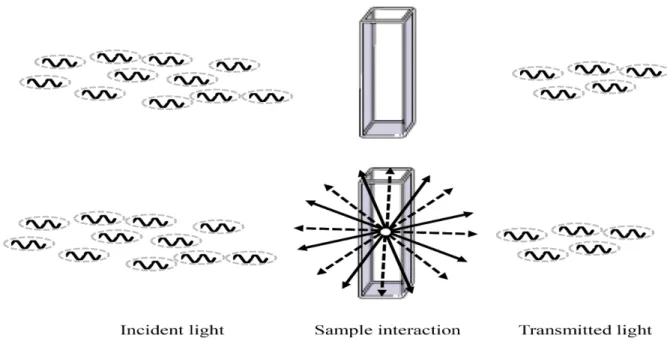
Photophysics and photochemistry is a result from the interaction of an electromagnetic field (light) and matter. This interaction can occur via different processes, each governed by specific laws and principles. When a light beam with a given, wavelength passes through a sample, the incident light can be absorbed, scattered or induce the emission of light by the sample (Photoluminescence) – see Figure 1.1. (2)
Figure 1.1. Schematic representation of the possible ways non-ionizing electromagnetic radiation interacts with matter. Top panel represents the absorption processes, where the incident light was more photons than the transmitted light, Solid arrows and dashed arrows in bottom panel represents the isotropic scattering and photoluminescent processes.
The absorbed light is converted into chemical energy, since the molecules that absorbed this light beam are promoted into higher levels of energy. The system can return to a basal energy level either by the occurrence of photochemistry (excited state chemistry), by the emission of this energy in the form of a photon or through non-radiative processes in the form of heat. Assuming a defined path in which light travels, the photoluminescence and scattering processes are always isotropic (i.e the same intensity in all directions) (3).
5 energy). In all situations, the energy that is required to promote a molecule from its ground state to its energized (excited) state must be equal to the energy separation between the two energy levels – Figure 1.2 represents the electronic transition of a given absorbing molecule. The absorption of UV-Vis radiation (200-800 nm), induces the electronic transition between the electronic ground state to an excited state. In the ground state, the orbitals of a given molecule are filled in order of increasing energy, respecting the Pauli principle of exclusion. This principle postulates that any given orbital can only contain two electrons with opposite spins. Upon absorption of a photon with this type of radiation, electrons from the highest occupied molecular orbital (HOMO) are promoted to a higher empty energy orbital. The organic molecules that absorb EM in this region (200-800 nm) contains electrons from π- or non-bonding orbitals (conjugated unsaturation, aromatic compounds, etc). The absorption of IR radiation is associated with the vibration of the molecular bonds (stretching, compression, scissoring, etc) and rotation of the overall molecule. The absorption of microwaves is associated with the rotational movement of the molecules (1). Considering that work within this thesis revolves around fluorescence, the process of the UV-Vis absorption and emission will be described in greater detail in the next section.
6 Figure 1.2. Schematic representation of vertical electronic transitions generated from absorption of photons with wavelengths in the UV-Vis range. Solid black line represents different electronic levels; Horizontal gray lines within each electronic level corresponds to vibrational levels; Vertical arrows represents the electronic transitions.
From a practical viewpoint, the absorption spectrum of a given solution is determined by the attenuation of a variable monochromatic light beam, after interaction with a given solution. This attenuation is determined by the fraction of the light beam that reaches an optical detector – Transmittance (%T) – Equation 1.3. The relationship between the transmittance and the absorbance is given by Equation 1.4. (2)
%𝑇 =
𝐼𝐼0
× 100
Equation 1.3𝐴𝑏𝑠 = − log(𝑇) = log(
𝐼07 Where I and I0 correspond to the monochromatic light that reaches the detector in the presence and absence of the absorbing species, respectively. This means that for any given wavelength that passes through the solution, containing the analyte of interest, with a given intensity (I), must be divided by the intensity of light of the same wavelength that passes through the same solution in the absence of the analyte (I0) – reference solution – in order to evaluate the attenuation of light imposed by the analyte. This allows the correction for the residual absorption of the solvent and possible interaction of the EM with the sample holder (i.e possible reflection and scattering events).
When the attenuation of the light beam follows a proportional relationship with the concentration of the absorbing species, the degree of the light attenuation is independent of the incident light intensity and each layer of the medium absorbs an equal fraction of the incident light, the absorbing species is said to follow the Lambert-Beer Law (2, 5). The degree of light attenuation dependents on 1) the number of absorbing molecules in solution - concentration (C - usually in molar (M) - moles per liter) -a higher number of absorbing molecules generates a higher absorption peak intensity in the absorption spectrum; 2) the length of the path that the beam of light has to travel (l - optical path usually in cm) – the increase of the optical path also increases intensity of absorption; 3) the molar absorptivity of the chemical under study ( – usually in M-1.cm-1). It is a constant for specific absorbing molecules and specific for a given wavelength and solvent. The relationship of these parameters and the absorbance of a chemical is given by Equation 1.5.
𝐴𝑏𝑠 = 𝜀 . 𝑙. 𝐶
Equation 1.58
Fluorescence
After the absorption of a photon that promotes a molecule to an electronic excited state, the decay to the ground state can occur through several pathways, such as 1) radiative decay, i.e. the emission of photons (via spin allowed fluorescence or spin forbidden phosphorescence pathways) or via non-radiate decay mechanism, such as: excited state energy transfer, vibration relaxation, solvent collision and others (5). For the radiative decay, when the electron in the excited state is paired (spin wise) with the ground state orbital, i.e. both electron present an opposite spin state, the return to the ground state is ‘spin allowed’ and occurs in rapidly through the emission of a photon (typically around 10-9 seconds) – Fluorescence. On the other hand, if the electron in the excited state orbital has the same spin orientation than the electron in the ground state, this transition is forbidden and the decay to the ground level occurs slowly (typically in the order of the 100 to 10-3 seconds) - Phosphorescence (3).
9 Figure 1.3. Jablonski diagram. Upward facing straight arrows represents the electronic excitation of electrons to higher energy orbitals. Downward facing straight arrows represents the electronic decay of an electron from high-energy orbital to the ground state orbitals. Curved arrows represent the vibrational relaxation within each electronic state. The horizontal line represents intersystem crossing. hνabs - Energy of the absorbed light. hνFluor - Energy of the
emitted light via fluorescence; hνPhos - Energy of the emitted light via phosphorescence.
10 is in its excited state and can reach lower energy levels by unpairing the excited electron spin with the partially occupied orbital in the ground level (3).
Figure 1.4. Absorption and emission spectra of 6-carboxyfluorescein with ~25 nm Stokes shift. Solid black line represents the normalized absorption spectrum and the dashed black line represents the normalized emission spectrum.
The decay to the ground state is accompanied by the emission of a photon with a frequency that corresponds to the energy gap between the lowest excited and the ground state (minus the energy loss by internal conversion), because the non-radiative relaxation of the higher excited states to the lowest excited state is usually faster than the radiative process. As such, the frequency of emission of a given fluorophore is independent of its excitation energy – Kashas Rule – given that the excitation occurs within the molecule absorption spectrum (3).The excitation at the absorption peak (that corresponds to the transition from the ground state to the lowest excited state) will populate this excited state more efficiently and, will ultimately lead to a higher emission intensity.
11
ɸ =
Absorbed PhotonsEmitted photons Equation 1.6As such, this parameter can be related to the emissive pathways (kr – decay to the ground state via fluorescence emission) and the non-emissive pathways (8) (knr – processes that depopulate the excited state of a given fluorophore without the emission of a photon, i.e. internal conversion, intersystem crossing, and energy transfer can be combined with a single parameter) using the relationship presented in Equation 1.7:
ɸ =
kr𝑘𝑟+𝑘𝑛𝑟 Equation 1.7
Due to the loss of energy via excited state internal conversion, the quantum yield will always be under 1. In fact, only perfect emitters will have a quantum yield of 1 (as well as perfect scatterers, however these are not technically fluorophores). Nonetheless, fluorophores that exhibit a ɸ near 1 will be brighter than the ones having a ɸ near 0. In this last case (ɸ=0), the absorbing species will not emit and will decay to the ground state exclusively by non-radiative means. Another important parameter for the characterization of a fluorophore is their fluorescence lifetime (τf). This parameter is defined as the inverse of the emissive rate in the absence of non-emissive pathways that depopulate the excited state – theoretical situation. In practice, it is usually measured the via the fluorescence decay time instead, which is defined by the inverse of the overall rate of excited state relaxation, as presented in Equation 1.8. The quantum yield and the fluorescence decay time can be used to calculate the fluorescence lifetime, which is the reciprocal of the radiative rate constant, kr.
𝜏 =
𝑘 1𝑟+𝑘𝑛𝑟 Equation 1.8
12
Steady-state and Time-resolved fluorescence
There are two main approaches for fluorescence measurements: steady-state and time-resolved measurements. In the steady state approach, the sample is continuously irradiated with a light beam, and the frequency and intensity of the light leaving the sample are measured. Due to the velocity of absorption and emission processes, the steady state is virtually reached instantaneously. Due to the nature of the measurement, the emission detection is usually detected at 90° or 173° to minimize the excitation light contamination in the recorded spectrum. For the time-resolved measurements, the sample is exposed to a flash of light whose duration should be below the fluorescence decay time of the fluorophore, otherwise, deconvolution methods must be used to retrieve the fluorophores decay from the convolution of the lamp flash and the fluorophore decay. This requires high-speed detection systems that can operate within the nanosecond and even picoseconds time scale to be useful in the determination of the fluorescence lifetime (9, 10). The steady-state measurements are an average of the time-resolved measurements, and some information is lost during the averaging process (for example, probes under different conformations or suffering different degrees of quenching will present different fluorescence decay times – one for each situation – while in a steady state approach all the mentioned situations would contribute to the same emission band, and the different populations would not be distinguishable). There are other types of information that are lost during the averaging processes, such as the mechanism behind fluorescence variation (energy transfer, diffusion, complex formation), the shape of macromolecules via anisotropy decay, among others (3). Although allowing a multitude of analysis that is impossible via steady-state approach, the time-resolved measurements require more complex and expensive instrumentation to be able to accumulate all the data necessary to unveil the mentioned details. These measurements also require a longer acquisition time and the lack of multi-sample analysis hinder the widespread use of these approaches, in comparison to steady state approaches.
Fluorescence intensity variation
14
Energy transfer systems
The emission of fluorophores can be modulated via the process of energy transfer. The energy transfer process is a bimolecular event, involving the transfer of energy from one donor fluorophore to an acceptor molecule. The Förster resonance energy transfer (FRET) is one of the most widely used energy transfer approaches in life sciences, to probe biomolecular interactions. It was first described by Theodore Förster in 1948 (26, 27). FRET is a non-radiative, distance dependent, energy transfer process between an excited donor to a suitable acceptor in the ground state. This means that the donor molecule returns to the ground state without the emission of a photon while promoting an acceptor to the excited state, via interaction of the transition dipoles of both molecules. The acceptor may be another fluorophore, and the energy transfer will make the acceptor fluorophore emit, or the acceptor can be a non-emissive molecule. In this last case, the acceptor will decay to the ground state via heat generation (3, 7). The occurrence and efficiency of this energy transfer is highly dependent on three factors: 1) the overlap between the emission spectra of the donor fluorophore and the acceptor fluorophore – Figure 1.5; 2) the transitional dipole moment of the donor emission should be correctly aligned with the transition dipole moment of absorption of the acceptor – this parameter can have a massive impact on the energy transfer efficiency, where a perpendicular orientation will hinder the energy transfer efficiency and a collinear orientation will maximize it; 3) the distance between the donor and the acceptor – Equation 1.9 (3), where R corresponds to the distance between the donor and the acceptor and R0 corresponds to the Förster critical radius. This R0 corresponds to the distance where the energy transfer is equal to 50 %, where half of the donor molecules decay via the non-radiative energy transfer and the other half decay via the average of the emissive and non-emissive pathways, that occur in the absence of energy transfer) – Figure 1.6 for visual representation of the distance-dependent energy transfer, and its association with R0. This parameter is used to evaluate if a given donor-acceptor pairs can be used to determine the occurrence of an interaction that occurs over a given distance. The R0 can be calculated based on the spectral properties of the donor-acceptor pair and their respective architecture – Equation 1.10 (3). Where R0 is determined in angstroms (Å), k2 is a geometrical factor describing the
relative orientation between the transition dipoles of the donor and acceptor, n represents the refractive
index of the medium, D is the quantum yield of the donor, ID() is the normalized donor emission
spectrum, A() the absorption spectra of the acceptor in molar absorptivity (M-1cm-1) and the integral
15 Figure 1.5. Schematic representation of the overlap between the donor emission spectrum and the acceptors absorption spectra. The dashed black line represents the donor absorption spectrum, Solid black line represents the emission spectrum of the donor; dashed gray line represents the acceptors absorption spectrum; solid gray line represents the acceptors emission.
Ф =
𝑅6𝑅+𝑅606 Equation 1.9
𝑅
0= 0.02 ∙ (
𝑘2Ф𝐷∫ 𝐼∞ 𝐷(𝜆)𝛴𝐴(𝜆)𝜆4𝑑𝜆
𝑛4
)
1 6
16 Figure 1.6. Graphical representation of the distance-dependent energy transfer efficiency and its relation to R0. The diameter of the blue and red circles represents the donor and acceptors emission, respectively. R0 is the Förster
distance, where the energy efficiency is equal to 50%. The length of the double-sided arrow represents the distance (R) separating the donor and acceptor molecule.
As shown in Equation 1.9, the Förster energy transfer efficiency depends on the inverse of the sixth power of the distance separating the donor and acceptor. As such, the energy transfer efficiency decreases as the distance between the donor and acceptor increases. As the distances approach R0, the energy transfer variation greatly increases and tends to zero (for distances greater than R0, or to 1 for distances below R0). This steep variation makes the energy transfer efficiency very susceptible to minute distance changes around R0. This, coupled with the fact that R0 for most donor-acceptor pair occurs between 10 and 100 Å, within the scale of biomolecular interaction, makes FRET a versatile phenomenon to be used for the study of these interactions (3, 28, 29). There is a wide range of applications where this phenomenon was used, from the development of several biosensors for nucleic acid, protein, and small molecule sensing(30, 31).
17 In the occurrence of FRET, the emission of the donor will decrease accompanied by the concomitant increase in the acceptor emission. The efficiency of energy transfer can be obtained from Equation 1.11.
Ф𝐸𝑇= 1 −𝐹𝐷𝐴
𝐹𝐷 Equation 1.11
Another energy transfer mechanism occurs at distances below 10 Å, a much shorter distance than that of the FRET process – Dexter Energy transfer. It was proposed by David Dexter in 1953, and the mechanism behind the energy transfer is based on electron transfer between the donor and acceptor molecules (32). The overlap between the donor emission spectrum and the acceptor absorption spectrum is also required for Dexter mechanism. Briefly, the electron that is in the acceptors highest occupied molecular orbital (HOMO) is transferred to the singly occupied HOMO of the excited donor, while the electron in the lowest unoccupied molecular orbital (LUMO) of the excited donor is transferred to the LUMO of the acceptor. The electrons transferred must be coupled spin wise as stated by the Pauli principle of exclusion (1, 3, 4). Upon this electron exchange, the previously excited donor is now at the ground level and the acceptor is electronically excited and may return to the ground state via emissive process. Due to the longer range of the FRET, this process usually is more preponderant than the Dexter mechanism at longer distances (above 10 Å). To be noted that the donor and acceptor fluorophore are unchanged after the energy transfer process.
Spectral codification
18 to the donor labeled oligonucleotides were labeled with 4 different acceptors fluorophores. The emission spectrum of each probe was addressed individually. The spectra for all the possible combinations of the donor and acceptor were tested (64 possible situations). The determination of sample composition was performed via the linear combination of the weighted emission spectrum of each flurophore, using the Equations 1.12 to 1.14.
𝐹𝑒𝑥1 = 𝑑 1 𝑒𝑥1. 𝑓
𝐷1𝑒𝑥1+ 𝑑2𝑒𝑥2. 𝑓𝐷2𝑒𝑥1+ 𝑑3𝑒𝑥1. 𝑓𝐷3𝑒𝑥1+𝑎1𝑒𝑥1. 𝑓𝐴1𝑒𝑥1+𝑎2𝑒𝑥1. 𝑓𝐴2𝑒𝑥1+𝑎3𝑒𝑥1. 𝑓𝐴3𝑒𝑥1+𝑎4𝑒𝑥1. 𝑓𝐴2𝑒𝑥1 Equation 1.12
𝐹𝑒𝑥2 = 𝑑 1 𝑒𝑥2. 𝑓
𝐷1 𝑒𝑥2+ 𝑑
2 𝑒𝑥2. 𝑓
𝐷2 𝑒𝑥2+ 𝑑
3𝑒𝑥2. 𝑓𝐷3 𝑒𝑥2+𝑎
1𝑒𝑥2. 𝑓𝐴1 𝑒𝑥2+𝑎
2𝑒𝑥2. 𝑓𝐴2 𝑒𝑥2+𝑎
3 𝑒𝑥2. 𝑓
𝐴3 𝑒𝑥2+𝑎
4 𝑒𝑥2. 𝑓
𝐴2
𝑒𝑥2 Equation 1.13
𝐹𝑒𝑥3 = 𝑑 1 𝑒𝑥3. 𝑓
𝐷1𝑒𝑥3+ 𝑑2𝑒𝑥3. 𝑓𝐷2𝑒𝑥3+ 𝑑3𝑒𝑥3. 𝑓𝐷3𝑒𝑥3+𝑎1𝑒𝑥3. 𝑓𝐴1𝑒𝑥3+𝑎2𝑒𝑥3. 𝑓𝐴2𝑒𝑥3+𝑎3𝑒𝑥3. 𝑓𝐴3𝑒𝑥3+𝑎4𝑒𝑥3. 𝑓𝐴2𝑒𝑥3 Equation 1.14
In Equation 1.12 to 1.14, the 𝑓𝐷
𝐽
𝑒𝑥∗ and 𝑓
𝐴𝑖
𝑒𝑥∗corresponds to the emission spectra of the donors (j - one to
three) and acceptors (i - one to four) in the absence of FRET at excitation wavelength * (maximum of absorption of donor one to three). The value of the coefficient 𝑑𝑗𝑒𝑥∗ and 𝑎
𝑖
𝑒𝑥∗, were iterated to minimize the
sum of the squared difference between the theoretical spectra derived from Equations 1.12 to 1.14 and the experimental spectra of the mixtures. These coefficients allow the determination of FRET through their variation. For the acceptors, they represent the degree of enhancement resulting from the donor direct excitation (FRET will result in values superior to 1). For the donors, the coefficient represents the degree of the quenching due to the energy transfer (FRET will result in coefficient values inferior to 1). The donor/acceptor coefficient values can be 0, when a given fluorophore is absence from solution, or 1 when no FRET occurs(33, 34).
In the presence of FRET, the acceptors coefficient can be decomposed in the ratio of the extinction coefficient of the donor and acceptor at the excitation wavelength multiplied by the FRET efficiency in the pair, and in the case of non-equimolar situation, the ratio of both concentration – Equation 1.15. Here, 𝑋𝐷𝑗/𝐴𝑖
corresponds to the molar fraction of the donor that is hybridized to the acceptor (1 for a equimolar reaction, 0 for an unhybridized pair), 𝜀𝐷𝑒𝑥𝑗𝜆 and 𝜀
𝐴𝑖
𝑒𝑥𝜆 are excitation coefficients of the donor j (one to three) and
acceptor i (one to four) at the excitation wavelength and Ф𝐸𝑇𝐷𝐽𝐴𝑖corresponds to the energy transfer
efficiency (or FRET quantum yield) within the considered donor-acceptor pair.
𝑎𝑖𝑒𝑥𝜆 = 𝑛 + 𝑋
𝐷1/𝐴𝑖.
𝜀𝐷1𝑒𝑥𝜆
𝜀𝐴𝑖𝑒𝑥𝜆. Ф𝐸𝑇𝐷1𝐴𝑖+ 𝑋𝐷2/𝐴𝑖.
𝜀𝐷2𝑒𝑥𝜆
𝜀𝐴𝑖𝑒𝑥𝜆. Ф𝐸𝑇𝐷2𝐴𝑖+ 𝑋𝐷3/𝐴𝑖.
𝜀𝐷3𝑒𝑥𝜆
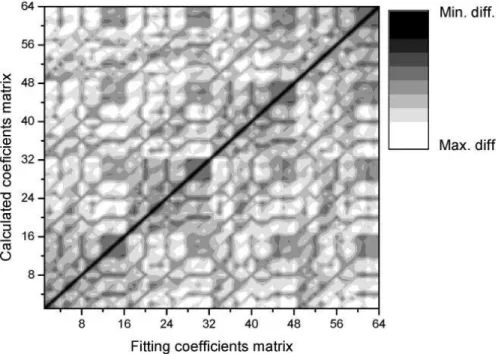
19 Considering that the coefficients can be mathematically estimated using the well-defined parameters, they can be compared to the ones obtained experimentally. Some difference exists between them, due to small differences between the real concentrations and the assumed concentrations, slight variations in the hybridization efficiencies and small variations in light intensity. The experimental coefficients and the theoretical coefficients can be organized into matrixes. When applying the minimal square difference between these matrixes, the surface plot, represented in Figure 1.7, arises.
Figure 1.7. Surface plot of the square difference between the theoretical and fitting coefficients for all the possible combination. Black corresponds to the minimal difference. White corresponds to the maximum difference. From (34)
The lowest difference between the theoretical and experimental coefficient is represented by the darker colors, and the absolute minimum can be observed in the diagonal of the plot due to the perfect match between the calculated and experimental coefficient. Note that the coefficients are not matched in absolute value but in minimal difference. The presence of dark and light gray regions denote that some sample compositions generate similar coefficients (local minimal regions). These local minima occur due to cross-excitation of the fluorophores, i.e. because all of them present a non-negligible absorption at the cross-excitation wavelength – Figure 1.8. This cross-excitation leads to excitation of other donor-acceptor pairs and therefore complicate the output signal, or by the increase of fluorescence due to direct excitation.
20 further polymerization). Each type of ddNTP was labeled with a different acceptor (i.e. different acceptors for the thymine, cytosine, guanine and uracil).
Figure 1.8. Representation of ideal direct excitation versus the occurrence of cross-excitation of the several fluorophores in solution at the excitation wavelengths. From (34)
acceptor-21 labeled ddNTP puts the acceptor and donor within a FRET compatible distance, allowing the identification of the incorporated ddNTP via FRET signals. In this study, the results demonstrated that the direct excitation of the donor upon SBE, allowed for the unequivocal identification of the incorporation of the four possible nucleotides, corresponding to 4 distinct allele variants to be detected in a single reaction. This SBE procedure coupled with FRET output signal was further modified to allow the use of the donor labeled in a universal approach, using a SBE primer with two portions: one for the hybridization to the sequence adjacent to the nucleobase to be questioned where an acceptor-labeled ddNTP is incorporated and the other portion of the primer that allows the hybridization of the donor labeled oligonucleotide. In this configuration, the same tag oligonucleotide can be used, theoretically, to any SBE reaction with a FRET output signal (35).
NanoBiotechnology
Nanotechnology has brought forth new materials suitable for application in biotechnology, and biomedicine, in particular, that greatly boost current methodologies for clinic diagnostics, including gene expression profiling, biomarker quantification and imaging (36–38). Amongst the plethora of nanoscale structures, devices and particulates, nanoparticles have been mostly studied and characterized for biotechnology use.
Nanoparticles are entities that contain at least one dimension below 100 nanometers. Nanoparticles can be synthesized in a multitude of shapes, such as spherical, rod, stars, triangles, among others. They can be composed by a wide variety of different materials, including: metals, such as noble metals (gold (39) silver (40–42), copper (43), platinum (44), palladium (45)), non-noble metals (iron (46), nickel (47), cadmium-selenium (48) and others (49, 50)), and nonmetallic such as carbon-based nanoparticles including pure carbon (51), polymer-based and lipids (such as liposomes(52)). The properties of the nanoparticles depend on their composition, size, shape and surface modification. Some examples of nanoscale properties include surface plasmon resonance (SPR) (53, 54) and quantum confinement in some types of metal nanoparticles (55), superparamagnetism in magnetic nanoparticles (46), alteration in conductivity in carbon nanotubes (56), among others.
22 AuNP can be fabricated essentially by two distinct concepts: top-down and bottom-up. Top-down approaches comprise techniques such as lithography and its variations (62), laser ablation (63, 64) and focused ion beam (65, 66), where the bulk material is removed (etched away) until achieving the desired shape and size for the nanomaterial. Despite having the potential to achieve narrow size dispersions, these methods tend to be slow and depend on the use of high-end, expensive equipment (49). On the other hand, bottom-up approaches have shown to be relatively simpler and faster. In bottom-up approaches, the nanomaterials are built from their precursors via self-assembly, depending on their molecular and atomic physicochemical properties, in a rather simple laboratory setup (67, 68). The reaction conditions must be thoroughly controlled to synthesize nanomaterials with a low dispersion of sizes and shape. Either top-down, bottom-up or a combination of the two concepts (69) has been used to produce nanomaterials with relatively narrow size dispersions, suitable for downstream biomedical applications.
Synthesis and functionalization
One of the most common methods for the production of spherical NPs with a narrow distribution of size in aqueous medium is the citrate reduction method developed and employed by Turkevich et al.(70) and later optimized by Frens (71) and Lee and Meisel (72). This method produces hydrophilic spherical AuNPs (10–30 nm) compatible with subsequent functionalization steps. For this synthesis approach, the citrate molecule acts as both a reducer and a capping agent.
23 particles with a diameter between 2 and 5 nm (78–80), which imposes some limits to subsequent applications: their diminished size renders the AuNP more difficult to be concentrated via centrifugation; decreases the loading of different molecule at the surface and their extinction coefficient can be two to three orders of magnitude lower in comparison to 12–15 nm (81) AuNPs. A different method for the chemical synthesis of AuNPs is the seeding growth method (82, 83), which is particularly relevant when a stricter control oversize distribution is required (84). This method relies on the formation of a seed, that acts as nucleation spots, upon which additional layers of metal are deposited. The reaction conditions are particularly important as they define the predominant sizes and shapes of the NPs that are obtained. This method has proven to be more cumbersome and time-consuming than the previously discussed methods and bears an increased risk of additional nucleation that may lead to the formation of undesired shapes during synthesis (82, 85). Considering all these, the citrate reduction method is a simpler and straightforward approach for the synthesis of hydrophilic AuNPs in large quantities, with relatively low size dispersion, for subsequent modification and use, for instance in, sensing application. Also, the surface of NPs produced by this method is easily modified due to the loose interaction between citrate and the AuNP, in comparison to the borohydride route that requires a phase transfer.
AuNPs in aqueous solution, synthesized via citrate reduction have negatively charged citrate ions adsorbed on their surface. This citrate adsorption stabilizes the colloidal suspensions by electrostatic repulsions. Such colloids may be stable for years, but they aggregate easily following radical changes to pH or an increase in ionic strength, i.e. the presence of salts. To improve its stability, ligand molecules on its surface can be exchanged with others that provide new functionalities (86). One of the most used protocols is thiol ligand exchange: thiol groups are considered to have a higher affinity to gold than citrate, thus promoting an exchange on its surface. This binding is often termed chemisorption or quasi-covalent bond (approximately 200 kJ/mol) (87) and renders the particles more stable against aggregation induced by an acidic pH or high salt concentrations (86). Early studies by Alivisatos et al.(88) and Mirkin et al (89). report the use of thiol-modified oligonucleotides functionalized to the surface of AuNPs, showing the potential of DNA hybridization in the macroscopic assembly of an AuNP– DNA network.
24 Figure 1.9. Schematic representation of the biomolecules that can be functionalized on the surface of AuNP. From (96).
The surface of an AuNP can also be modified via ionic coupling methods, in which the ligand exhibits an opposite charge to that of the AuNP or of the capping agent (97, 98). Ionic coupling procedures are quicker and do not require pre-activation of molecules. However, this originates more unstable constructs, and control over the biomolecule orientation is hindered (99). The widely-known biotin–streptavidin interaction can also be used for the surface modification of AuNPs. Although noncovalent, the functionalization of the AuNP with avidin or biotin usually requires a covalent immobilization of these molecules (either by direct functionalization using a thiolated molecule or through EDC coupling). Hydrophobic interactions, while not being covalent interactions, usually require a quasi-covalent attachment using a thiol coupling (100).
25 Table 1.1. Common covalent immobilization strategies for AuNP functionalization.
Coupling reaction
Functional group at AuNP surface
Functional group
on ligand Linkers/spacers Examples
Thiol Direct coupling Thiol - DNA 28,64
PEG116
Fluorophores
EDC/NHSa Carboxylic/phosphate
or amine carboxylic/ Amine or phosphate
Bifunctional PEG/DNA chain
harboring a thiol and a(n) amine/ carboxylic group
Proteins117
Antibodies14 Fluorophores118
Maleimide Thiol/maleimide Maleimide/thiol Homo-bifunctional thiolated PEG or hetero-bifunctional PEG harboring maleimide
Peptides119 DNA120
Chemotherapeutic agents121
a EDC, 1-ethyl-3-(3-dimethylaminopropyl)carbodiimide; NHS, N-hydroxysuccinimide;.
Optical properties
26 Figure 1.10. Schematic representation of metal nanoparticles in localized surface plasmon resonance (LSPR). Interaction of the electromagnetic waves with the metal nanoparticle (NP) surface electrons (e-) induces a surface plasmon resonance. From (108)
27
Interaction of AuNP with fluorophores
One of the first evidence that suggested that metallic surface could have an impact in the emission of fluorophore was proposed in 1970 by Karl-Heinz Drexhage (114). In this study, it was demonstrated that the fluorescence decay time varies due to the presence of an interface between two dielectrics of different refractive indices. Recently, metal nanoparticles such as gold and silver, have been used for the modulation of the emission of fluorophores that are in the vicinity of the nanoparticles. Although a lot of work has been presented on the quenching properties AuNP (115–119), some authors reported the enhancement. Parak et al (120) showed that the fluorescence of the fluorophore Cy5 emission decreases in close proximity to the AuNP and that the decrease in the observable emission was dependent on the decrease of the radiative decay rate. In this approach, the distance of the fluorophore from the surface of the AuNP was controlled using a fluorescently labeled thiolated DNA molecule in single strand (ssDNA). Anger et al (121) reported that AuNP can simultaneously lead to the suppression or enhancement of a fluorophore emission. This was executed, using a substrate immobilized fluorophore and an 80 nm AuNP that was immobilized in an atomic force microscopy (AFM) tip. The use of AFM allowed the precise positioning of the fluorophore in relation to the fluorophore while keeping the same transitional dipole orientation, ensuring that the observed effect is a solely dependent on the distance separating the AuNP and the fluorophore. Here, both enhancement and quenching could be observed depending on the separation distance. Kuhn et al (122) reported similar results using AuNPs of 100 nm and terylene molecules as emitters. Kang et al (123), reported the similar observation, but in a solution (where the transitional dipole orientation is not as stationary as in the AFM measurements), using smaller AuNPs (8 and 16 nm). The occurrence of either enhancement or quenching is dependent on degree of separation between the interacting parties as demonstrated by Anger et al (121), Kuhn et al (122), among others (124) , nanoparticle size (125), the electronic properties of nanoparticle, emission frequencies of the fluorophore and the excitation wavelength (126, 127).
28 the system (i.e. energy transfer to the nanoparticle). The mechanism by which the energy is transferred from the fluorophore is transferred to the AuNP can occur via FRET with an efficiency that is inversely proportional to the sixth power of the distance between them, or via nano surface energy transfer (NSET (128)), with an efficiency that is inversely proportional to the fourth power of the distance between them. The absorption rate can also be influenced due to the metal amplifying the incident field, concentrating the local excitation intensity, leading to a higher observable emission (129). Fluorophores that have high non-radiative decay rates (low quantum yields - ± 1%) are more prone to emission enhancement by AuNPs (127).
Other properties
As stated before, the LSPR of the AuNP can be separated into an absorption and scattering component. When an AuNP absorbs light, the excited electron must return to the ground level by either the emission of a photon or through the generation of heat. The non-emissive decay, i.e. heat generation, occur via a three-step process: 1) the excitation of the AuNP sample using a monochromatic, coherent and collimated light (laser) at the LSPR peak, generates the before mentioned oscillation of the conductive electrons; 2) The collision of the electron with the nanocrystal lattice leads to the increase of the overall vibration of the lattice, a ~1ps process that is denominated as electron-phonon relaxation; 3) This leads to the increase of temperature of the crystalline lattice, that is followed by the cooling of the crystalline structure via a vibrational transfer of the energy to the surrounding media (denominated as phonon-phonon interaction), taking around 100 ps (130, 131). This property, coupled to their lack of toxicity and ease of surface functionalization, has been used for the development of nanoparticle-mediated photothermal therapy strategies for malignant solid cancerous tumors (131).