Food Science and Technology
DO:
D https://doi.org/10.1590/fst.11617
OSSN 0101-2061 (Print) OSSN 1678-457X (Dnline)
1 Introduction
On Brazil’s primary energy matrix, renewable energy accounts for an important 46.9% share, which is larger than the share of renewable energy consumed in the world – 13.2% (Companhia Nacional de Abastecimento, 2018). On the Brazilian energy consumption, 17.5% evince from sugarcane, followed by 12.6% of hydroelectric energy and 8% of coal (Empresa de Pesquisa Energética, 2017).
The productive chain in the sugar and ethanol sector also plays a major role in the country’s development, accounting for 2% of the country’s Gross Domestic Product (GDP) (Confederação da Agricultura e Pecuária do Brasil, 2017), and Brazil is currently considered the largest producer of sugarcane and sugar in the world, and the second largest producer of ethanol (Food and Agriculture Drganization of the United Nations, 2017). With the economic downturn (Neves et al., 2016), the optimization of the productive process can be used as a strategy to overcome the difficulties encountered in the market and in the macroeconomic scenario.
The good performance of sugar and ethanol production depends not only on environmental, social and cultural aspects, but also on the company’s internal effort, modernizing and adapting to respond the competitive pressures and challenges (Manoel et al., 2016). On this sense, efficiency becomes an important competitive differential in the face of such an important and highly competitive market.
Considering the high productivity and the worldwide appeal for the sustainability of production, the industry has directed its efforts in this direction through measures such as reduction of water use in the mills and regular use of vinasse (Salgado et al., 2017).
The recognition of Brazil’s relevance in the sugar-energy sector is in studies conducted over several decades, deriving many contributions in the advance of science and technology, such as the research elaborated by Humbert (1963) and Jenkins (1966). However, occurs a small amount of studies that evaluate the efficiency under the productive optics of the sugar and ethanol chain.
Farrel (1957) conceptualizes efficiency as being the ratio between a quantity of products and a quantity of inputs, becoming one of the pioneers in the radial analysis of technical efficiency. According to Lemos et al. (2016), determining whether an enterprise is efficient (or inefficient) and identifying some of the reasons for such performance, contribute significantly to the definition of appropriate strategies for this sector.
On order to improve industrial efficiency, it is important to measure and control the processes, recommending studies that use mathematical modeling to identify points of intervention, explaining the variation of operational efficiency and, consequently, the overall efficiency of the power mills. On this way, this study proposes control stages for efficiency analysis in sugar and ethanol mills.
Ot is known that the production process of a sugar and ethanol mill can be divided into 3 distinct phases, a first phase common to both products, a second phase of sugar production, and a third phase of ethanol production (Dias et al., 2015). Throughout this manufacturing process, activities of analysis and measurement of process data occur, enabling the creation of performance indicators for the process, aiming at the decision-making of industrial managers (Duarte, 2017).
Analyzing the processes that occurred in the industry prior to the unloading of sugarcane, data are collected on the sucrose
Proposal of stages by controlling the efficiency analysis in sugar and ethanol mills
Alexandre DUARTE1, Stella Vannucci LEMDS1*, Alexandre SALGADD JUNODR1,
Marco Antonio SDUZA JUNODR1, Ricardo DDNEGÁ1
Received 25 Apr., 2017 Accepted 09 Sept., 2018
1Departamento de Administração, Universidade de São Paulo – USP, Ribeirão Preto, SP, Brasil
*Corresponding author: [email protected] Abstract
This study aimed to identify the main points of control in the efficiency of the productive process in sugarcane mills. Thus, a two-stage DEA approach applied for a sample of 121 mills, distributed among the seasons of 2010/2011 until 2014/2015. The first stage separated the efficient mills in transforming the total recovered sugar (TRS) of the processed sugarcane into sugar and ethanol, and the second stage identified significant production process variables in the efficiency with truncated regression. Besides, with the help of industry experts and statistical analysis, established 13 variables, which could control and increase the efficiency of the sugar and ethanol production processes, contributing to the overall efficiency of sugar and ethanol units. Keywords: Data Envelopment Analysis (DEA); energy; sugar and ethanol mills.
to a process of evaporation and, sequentially, directing it to the cooking process, causing crystallization of the sucrose – who called cooked mass – and then discharges in centrifuges, occurring molasses division from the crystals (centrifugal force), occurring after, final operations like drying, sorting, packaging and storage receive the resulting sugar (Andrade, 2017).
For the production of ethanol, mills that make sugar and ethanol use a mixture of molasses and juice for the preparation of the mud, which it is sent to the fermentation vats, transforming sugars into ethanol, sending to centrifuges to recover the yeast (Manochio et al., 2017). After this process, it sent to distillation columns where recovers the ethanol from the juice, and in addition to distillation, rectification and dehydration, occurs the obtainment of hydrated ethanol, which can be further dehydrated using a dehydrating agent, producing, finally, anhydrous ethanol (Dias et al., 2015).
2 Materials and methods
The database used in this research comprises information from 33 sugarcane mills, collected during the seasons from 2010/2011 to 2014/2015, stipulating for the chosen mills a frequency of at least 2 years of data.
The data refer to 171 indicators, which are the total amount of TRS (ton) obtained in ground sugarcane, total sugar production (ton) and total ethanol production (m3), followed by measurements of variables involved in the sugar and ethanol production process.
On the measurement of technical efficiency, used DEA tool, which is a non-parametric frontier technique, initially developed by Charnes et al. (1978). Ot allows the comparing inside homogeneous group of production units, called Decision Making Units (DMUs). DMUs represents the smallest unit in each analyzed period, receiving different efficiency scores ranging from 0 to 1 according to the level of productivity. The best levels of efficiency make up the frontier, receiving a score of 1 and called efficient. The other units receive a score relative to the distance of frontier, called inefficient, aiming to improve productivity in order to move to the frontier (Vasconcellos et al., 2006).
The proposed initial model received the CCR or CRS (constant returns to scale) nomenclature and has as characteristic the non-differentiation of scale gains of the DMUs (Charnes et al., 1978). Subsequently, Banker et al. (1984) proposed the BCC model, which has as main difference from the previous model the consideration of the gain of scale in the different levels of production. Another option of the DEA analysis consists of the
in order to maximize the production of sugar and ethanol for a given quantity of TRS. Model formula follows on Equation 1:
0 1
n
o i io
i
Max h v X v
=
=
∑
+ (1)Subject to restrictions (Equations 2 and 3):
1 1 m r ro r u Y = =
∑
(2)0
1 1
m n
r rj i ij
r i
u Y v X v
= =
≤ +
∑
∑
(3), 0
ur vi≥
1, ,
j= …s
1, ,
r= … m
1, ,
i= … n
where Yrj and Xij are the products and inputs of the jth DMU, ur and vi represent the weightings (weighting coefficients or relative importance of each variable) determined by the solution of the problem. The weightings ur and vi obtained correspond by current DMU. This process is repeated for each DMUs, yielding different values for ur and vi.
From the mathematical representation, the aim is maximize the outputs (1) for each DMU, given the constraints. On the constraints, (2) the sum of the inputs multiplied by their respective weightings must be equal to 1. This is necessary to solve the problem by linear programming. The second constraint (3) represents the outputs must be less or equal than the inputs. This problem seeks to optimize the product/input ratio of the DMU by freely assigning weightings to them with the constraint that, with the same weightings, DMUs do not present this ratio greater than 1.
Applying DEA technique orientated to output performed an operational efficiency ranking, which was possible to rank mills according to their efficiency in transforming TRS (ton) into sugar (ton) and ethanol (m3), presented on Figure 1.
Although DEA analysis is a widely used technique, mainly in operational research, it may present bias in its score due to small samples and the lack of need for statistical assumptions (Huang & Eling, 2013). On order to ease this situation, it used the Bootstrap method along with the frontier technique, based on the idea of repeated simulations with the intention to approximate the original distribution of the data (Efron, 1979).
Although, previously use with another frontier technique by Simar (1992), the combination of DEA and Bootstrap was first used by Simar & Wilson (1998). On order to correct the bias and create confidence intervals for the scores, this study used the Bootstrap model proposed by Simar & Wilson (2000). On addition to the aforementioned benefits, the model allowed the normalization of the efficiency distribution scores of the units, thus allowing the work to use a two-stage approach, the second stage being the application of truncated regression.
The selection of variables is a decisive point because, according to Thanassoulis (1996), changes in the set of selected variables can have a direct impact on the results and, consequently, on the analysis of the evaluation data. Mello et al. (2003) agree that the criteria and, fundamentally, the methods for selecting variables should be decision support tools, which will guide the results. Given this, specialists, managers and decision makers should use experience, common sense and detachment when choosing/selecting variables (Angulo-Meza et al., 2007).
On order to improve the quality of the analysis and the mathematical models used, the first step was to reduce the explanatory variables from 163 to 71, according to the researcher’s opinion, always pondering their relationship with the parameters selected in the technical analysis. Ot was verified that were absent data in the 71 chosen variables, however, not exceeding 10% of absence considering the total of variables.
Absence of data is a common problem in scientific research and has challenged researchers since the early days of field research, consisting of a challenge in planning and analysis to determine the predictors that contribute to predict the absence or presence of characteristics in a population (Schafer & Graham, 2002; Graham, 2009).
Faced the situation, the utilization of Missing Data Omputation was necessary, which is a statistical technique that allows to complete the missing data, whether quantitative, categorical, ordinal or nominal. Ot consists in a combination of results found by a statistical method in order to obtain the repeated imputation inference. On this way, it was possible to analyze all the individuals in the study (Pigott, 2001).
Employing the Statistical Package for Social Sciences (SPSS), version 22.0 software, the analysis started in order to qualify the database of randomness characteristics of the sample, as well as the pattern of absence, identifying the MCAR (Missing Completely at Random) type, non-monotonic absence pattern, and no repetition of absence pattern. Since the absence of the data is random and with no established pattern, the data were replaced using the Monte Carlo Model (Geweke, 1999; Jamasb & Pollitt, 2000).
Before calculating the truncated regression, the correlation between the independent variables was verified through the multicollinearity test (Wanke & Barros, 2014), which, interpreting the variable of statistical regression, the correlation between the independent variables must be considered. Odeally, independent variables are highly correlated with the dependent variable with small correlation with each other. Multicollinearity may affect the estimation of regression coefficients and their statistical significance (Hair et al., 2009) and the multicollinearity test resulted in 29 of the 71 original variables, observed in Table 1.
Figure 1. Production model. Source: The authors (2018).
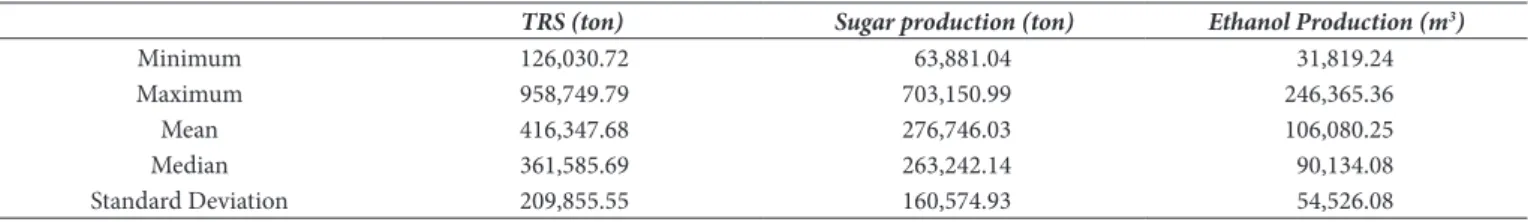
Table 1. Descriptive statistics: input and outputs.
TRS (ton) Sugar production (ton) Ethanol Production (m3)
Minimum 126,030.72 63,881.04 31,819.24
Maximum 958,749.79 703,150.99 246,365.36
Mean 416,347.68 276,746.03 106,080.25
Median 361,585.69 263,242.14 90,134.08
Standard Deviation 209,855.55 160,574.93 54,526.08
j a Zj j, j 1, , n
θ = + δ+ ∈ = … (4)
The constant, j is the noise, Zj is the vector of a specific observation of the DMUj, which expecting relation with the DMU efficiency score, θj. Simar & Wilson (2007) replace the DEA estimators (Equation 5) and the model becomes:
j a Zj j, j 1, , n,
θ ≈ + δ + = … (5)
Upon j ~ N 0,
( )
2ε θ
such that j 1≥ −a – Zjδ, j = 1,...,n, is estimated by the corresponding maximum likelihood function, considering
( )
, 2ε
δ θ and the data collected (Wijesiri et al., 2015).
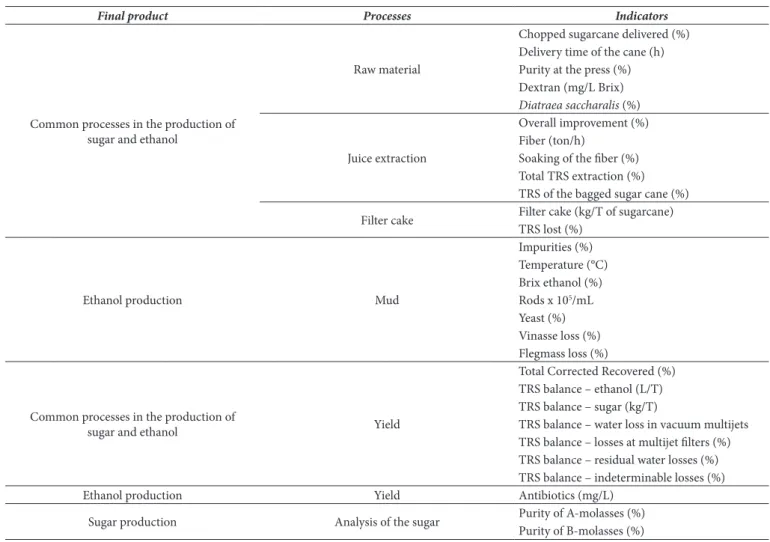
The control points of sugar energy mills (Table 2) used as regression variables to identify which stages of the production process are significant for industrial efficiency.
the DMU efficient or not. Figure 3 illustrates the production frontier generated by DEA, demonstrating the productivity for each output of the model.
Although the model used to measure efficiency utilizes three variables, a fact that increases the discrimination of the units, possible to notice that the observed sample does not have much disparity between the scores, varying in the range of 0.85 to 1.00. On this sense, the study corroborates with Higgins et al. (2010) accurate a high sector competitiveness and efficiency parity. This small dispersion observed accentuates the importance of identifying factors that contribute to the improvement of productive process.
Table 2. Ondicators of productive processes of sugar and ethanol industry.
Final product Processes Indicators
Common processes in the production of sugar and ethanol
Raw material
Chopped sugarcane delivered (%) Delivery time of the cane (h) Purity at the press (%) Dextran (mg/L Brix)
Diatraea saccharalis (%)
Juice extraction
Dverall improvement (%) Fiber (ton/h)
Soaking of the fiber (%) Total TRS extraction (%) TRS of the bagged sugar cane (%) Filter cake Filter cake (kg/T of sugarcane)
TRS lost (%)
Ethanol production Mud
Ompurities (%) Temperature (°C) Brix ethanol (%) Rods x 105/mL
Yeast (%) Vinasse loss (%) Flegmass loss (%)
Common processes in the production of
sugar and ethanol Yield
Total Corrected Recovered (%) TRS balance – ethanol (L/T) TRS balance – sugar (kg/T)
TRS balance – water loss in vacuum multijets TRS balance – losses at multijet filters (%) TRS balance – residual water losses (%) TRS balance – indeterminable losses (%)
Ethanol production Yield Antibiotics (mg/L)
Sugar production Analysis of the sugar Purity of A-molasses (%) Purity of B-molasses (%)
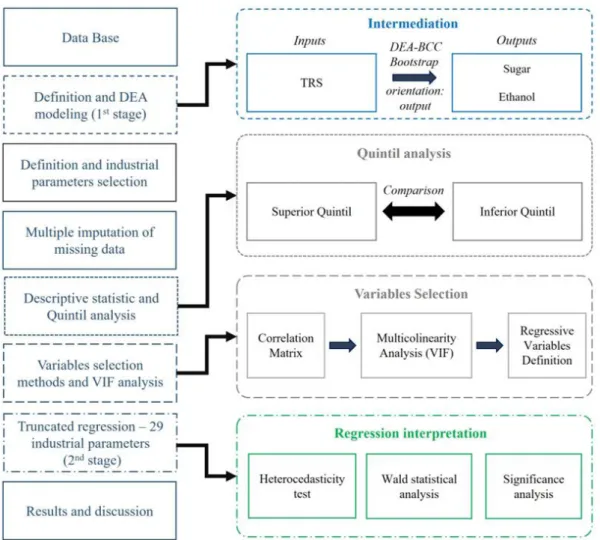
Figure 2. Research methodology. Source: The authors (2018).
α=5%, rejecting the null hypothesis, and incorporating them into the model, presenting Wald statistical significance of less than 5% and a standard error of 2.17, with a 95% confidence margin.
According to the regression, it is possible to determine control stages throughout the sugar and ethanol production process (Figure 4). At the beginning of the process, two variables belonging to the raw material process were important: chopped sugarcane delivered (1) and total TRS extraction (2). The importance can be related to the fact that transport operations of raw material withdrawn from the field to the industry, require a limit of hours and continuity of the same, and long periods of storage affect the quality, the profitability of sugarcane and the extraction of TRS (Kadwa & Bezuidenhout, 2015; Carvalho et al., 2016; Masoud et al., 2016).
On the agricultural process, the absence of rainfall and the transition to the mechanized harvesting system, increased the amount of mineral and vegetable impurities taken from the field to the industry, causing difficulties in maintaining the quality of the final product (Scheidl et al., 2015).
These impurities can interfere, due to bacterial contamination, resulting in losses of efficiency in the fermentation process.
Beyond the importance of juice quality (with the lowest amount of turbidity, color and lime content), this study highlights the variable related to yeast (4) and its control, avoiding solid (leaves, shards) and colloidal (waxes, proteins) impurities, which in great quantity affect the quality and efficiency of the process (Lopes et al., 2015; Bakir et al., 2016).
The sediment impurities in the juice treatment stage are filtrated, making essential the rational use of water for this process, since the highest percentages of water use are associated with this stage, using 36% of the total used in the mill (Cherubin, 2018). The objective of this step is to recover the sugar, producing filtered juice to return to the process, remaining as residue the filter cake, sent to the crop to use as a soil fertilizer (Duarte, 2017). Due to this observation, it is necessary to control the water used in this process, analyzed in this research as the TRS balance – residual water losses (12) – and the amount of produced filter cake (3) which can affect the production process.
Ot is possible to detect the loss of TRS in the analyzed samples of sugar and ethanol production processes, being a predictable evaluation, taking into account its level, since it has identified in
Table 3. Efficiency by period.
2010/2011 2011/2012 2012/2013 2013/2014 2014/2015 Minimum 0.8801 0.8491 0.8308 0.8482 0.8722
Mean score 0.9617 0.9415 0.9404 0.9420 0.9577
Bias 0.0066 0.0057 0.0055 0.0063 0.0052
Corrected score 0.9550 0.9358 0.9349 0.9358 0.9524
Maximum 1.0000 1.0000 1.0000 1.0000 1.0000
Source: The authors (2018).
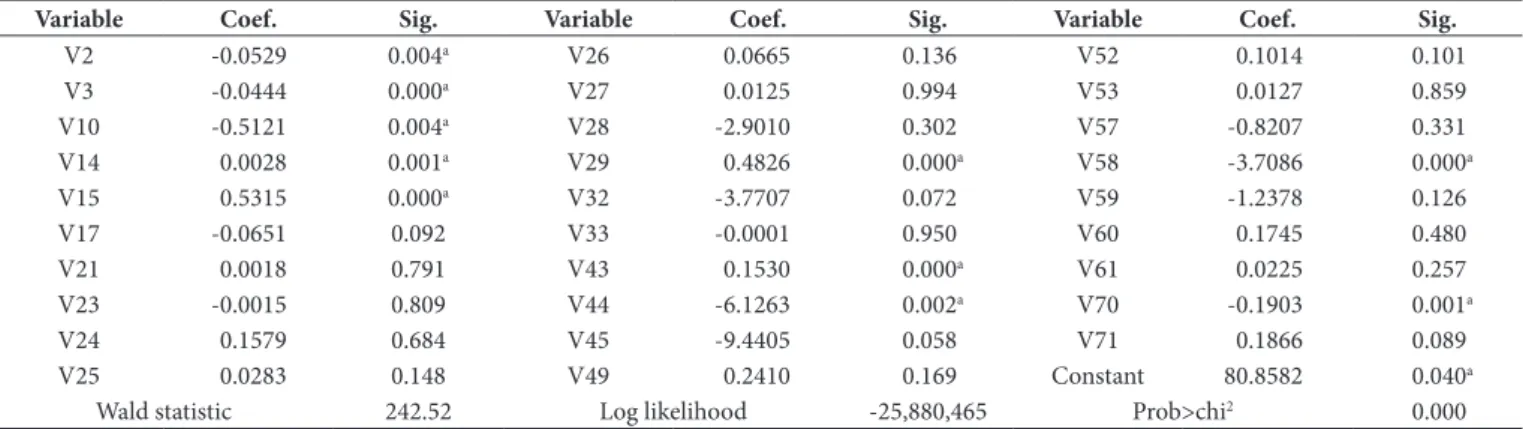
Table 4. Results of the truncated regression.
Variable Coef. Sig. Variable Coef. Sig. Variable Coef. Sig.
V2 -0.0529 0.004a V26 0.0665 0.136 V52 0.1014 0.101
V3 -0.0444 0.000a V27 0.0125 0.994 V53 0.0127 0.859
V10 -0.5121 0.004a V28 -2.9010 0.302 V57 -0.8207 0.331
V14 0.0028 0.001a V29 0.4826 0.000a V58 -3.7086 0.000a
V15 0.5315 0.000a V32 -3.7707 0.072 V59 -1.2378 0.126
V17 -0.0651 0.092 V33 -0.0001 0.950 V60 0.1745 0.480
V21 0.0018 0.791 V43 0.1530 0.000a V61 0.0225 0.257
V23 -0.0015 0.809 V44 -6.1263 0.002a V70 -0.1903 0.001a
V24 0.1579 0.684 V45 -9.4405 0.058 V71 0.1866 0.089
V25 0.0283 0.148 V49 0.2410 0.169 Constant 80.8582 0.040a
Wald statistic 242.52 Log likelihood -25,880,465 Prob>chi2 0.000
regression analysis as variable 13 – TRS indeterminable losses (Fernandes, 2011).
Substantial variables in fermentation process should be considered in order to increase the efficiency of sugar and ethanol obtaining. On addition to loss of sugar through contamination by rods as mentioned before, the measurement of variables such as vinasse loss (7) and flegmass loss (8) need to be carried out, since if they can increase their volume, consequently decrease ethanol production (Dias et al., 2015).
Fermentation represents a significant fraction of sugar loss in the sugarcane mills and a weakening of the distillation process, assuming that the verification of the treated yeast and the percentage of vinasse in the ethanol produced allow the increase of ethanol production, as well as the reduction of vinasse production (Borodin et al., 2016).
Vinasse is a byproduct of sugar and ethanol manufacturing processes, being used in fertirrigation, yeast production for industry, energy in the biogas production process and even as feed for livestock (Duarte, 2017).
On sugar and ethanol, productive process has a measure of total corrected recovered (variable 9) which serves to compare the yields obtained in the production of sugar and ethanol among the production units, with the purpose of industrial excellence (Fernandes, 2011).
Onside a mill, it is necessary to verify the production, made by the balance of TRS contained in the final products (Gilio &
Castro, 2016), therefore is important the continuous monitoring of variables 10 and 11 – TRS balance of ethanol and sugar – aiming the best quality of sugar and ethanol yield (Chandel et al., 2014).
4 Conclusion
On this study, it was possible, through quantitative analysis, to suggest stages for the control and improvement of industrial efficiency. On addition, within the limitation of this resource, indicates these stages may contribute to the overall efficiency of sugarcane mills.
On this way, this study becomes relevant to contribute to the increase of efficiency in the sugar and ethanol production processes, considering that the productive units are source of clean and sustainable energy.
Omprovements in the production process should continue in the field and in the sugarcane industry, in order to increase its competitiveness, allowing the integration of production along with prospects for the future of the sugarcane industry.
References
Andrade, M. C. (2017). Technological innovations in the sugar and alcohol industry: determinants, current stage and trends in the Brazilian context (2005-2014). Brazilian Journal of Management &
Innovation, 4(3), 89-106.
Angulo-Meza, L., Mello, J. C. C. B. S., Gomes, E. G., & Fernandes, A. J. S. (2007). Seleção de variáveis em DEA aplicada a uma análise do
world. Annual Review of Psychology, 60(1), 549-576. http://dx.doi. org/10.1146/annurev.psych.58.110405.085530. PMid:18652544. Hair, J. F., Anderson, R. E., Tatham, R. L., & Black, W. C. (2009). Análise
multivariada de dados. Porto Alegre: Bookman.
Higgins, A., Miller, C., Archer, A., Ton, T., Fletcher, C., & Mcallister, R. (2010). Challenges of operations research practice in agricultural value chains. The Journal of the Operational Research Society, 61(6), 964-973. http://dx.doi.org/10.1057/jors.2009.57.
Huang, W., & Eling, M. (2013). An efficiency comparison of the non-life insurance industry in the BROCs countries. European Journal of
Operational Research, 226(3), 577-591. http://dx.doi.org/10.1016/j.
ejor.2012.11.008.
Humbert, R. P. (1963). The growing of sugar cane. Amsterdam: Elsevier. Jamasb, T., & Pollitt, M. (2000). Benchmarking and regulation:
international electricity experience. Utilities Policy, 9(3), 107-130. http://dx.doi.org/10.1016/S0957-1787(01)00010-8.
Jenkins, G. H. (1966). Introduction to cane sugar technology. Amsterdam: Elsevier.
Junqueira, R. A. R., & Morabito, R. (2017). Dptimization approaches for sugarcane harvest front programming and scheduling. Gestão &
Produção, 24(2), 407-422. http://dx.doi.org/10.1590/0104-530x1882-16.
Kadwa, M., & Bezuidenhout, C. N. (2015). Modelling sugarcane supply consistency at a sugar mill. Computers and Electronics in Agriculture, 111, 107-111. http://dx.doi.org/10.1016/j.compag.2014.12.019. Lee, B. L., & Worthington, A. C. (2014). Technical efficiency of
mainstream airlines and low-cost carriers: new evidence using bootstrap data envelopment analysis truncated regression. Journal
of Air Transport Management, 38, 15-20. http://dx.doi.org/10.1016/j.
jairtraman.2013.12.013.
Lemos, S. V., Salgado, A. P. Jr., Duarte, A., Antunes, F. A., & Esteves, R. L. (2016). Análise comparativa entre produtividade agrícola e industrial do setor sucroenergético brasileiro nos últimos 10 anos.
Custos e @gronegócio Online, 12(4), 154-174.
Lisboa, L. A. M., Pascoaloto, O. M., Viana, R., Da, S., Lopes, P. R. M., & Figueiredo, P. A. M. (2015). Contaminações em caldo de cana-de-açúcar: uma avaliação temporal. Brazilian Journal of Biomedical
Engineering, 9(3), 279-288. Retrieved from http://seer.tupa.unesp.
br/index.php/BODENG/article/view/309/248
Lopes, M. L., Paulillo, S. C. L., Cherubin, R. A., Godoy, A., Amorim, H. B. No., & Amorim, H. V. (2015). Linhagens de leveduras personalizadas
para produção de etanol: seleção dirigida pelo processo. Piracicaba:
Fermentec Tecnologias em Açúcar e Álcool.
Manochio, C., Andrade, B. R., Rodriguez, R. P., & Moraes, B. S. (2017). Ethanol from biomass: a comparative overview. Renewable &
Sustainable Energy Reviews, 80, 743-755. http://dx.doi.org/10.1016/j.
rser.2017.05.063.
Manoel, A. A. S., Santos, D. F. L., & Moraes, M. B. C. (2016). Determinants of indebtedness in the Brazilian sugarcane industry: analysis based on Borodin, V., Bourtembourg, J., Hnaien, F., & Labadie, N. (2016).
Handling uncertainty in agricultural supply chain management: a state of the art. European Journal of Operational Research, 254(2), 348-359. http://dx.doi.org/10.1016/j.ejor.2016.03.057.
Carvalho, L., Antunes, C. H., & Freire, F. (2016). Economic-energy-environment analysis of prospective sugarcane bioethanol production in Brazil. Applied Energy, 181, 514-526. http://dx.doi.org/10.1016/j. apenergy.2016.07.122.
Chandel, A. K., Junqueira, T. L., Morais, E. R., Gouveia, V. L. R., Cavalett, D., Rivera, E. C., Geraldo, V. C., Bonomi, A., & Silva, S. S. (2014). Techno-economic analysis of second-generation etanol in Brazil: competitive, complementary aspects with first-generation ethanol. On S. S. Silva & A. K. Chandel (Eds.), Biofuels in Brazil (chap. 1, pp. 1-29). London: Springer.
Charnes, A., Cooper, W. W., & Rhodes, E. (1978). Measuring the efficiency of decision making units. European Journal of Operational Research, 2(6), 429-444. http://dx.doi.org/10.1016/0377-2217(78)90138-8. Cherubin, R. (2018). Estequiometria da fermentação: o rendimento
possível. Piracicaba: PortalFT.
Chowdhury, H., & Zelenyuk, V. (2016). Performance of hospital services in Dntario: DEA with truncated regression approach. Omega, 63, 111-122. http://dx.doi.org/10.1016/j.omega.2015.10.007.
Companhia Nacional de Abastecimento – CDNAB. (2018).
Acompanhamento da safra brasileira de cana-de-açúcar 2018/2019.
Brasília: CDNAB. Retrieved from http://www.conab.gov.br/DlalaCMS/ uploads/arquivos/18_01_08_09_08_38_cana_dezembro_novo.pdf Confederação da Agricultura e Pecuária do Brasil – CNA, Centro de
Estudos Avançados em Economia Aplicada – CEPEA. (2017). PIB
cadeias do agronegócio. Piracicaba: USP. Retrieved from https://www.
cepea.esalq.usp.br/upload/kceditor/files/Relatorio%20POBAGRD%20 Cadeias_1_sem_2017_.pdf
Dias, M. D. S., Maciel, R. Fo., Mantelatto, P. E., Cavalett, D., Rossell, C. E. V., Bonomi, A., & Leal, M. R. L. V. (2015). Sugarcane processing for ethanol and sugar in Brazil. Environmental Development, 15, 35-51. http://dx.doi.org/10.1016/j.envdev.2015.03.004.
Duarte, A. C. M. (2017). Proposta de boas práticas de operação que
colaborem para a eficiência técnica das usinas de açúcar e etanol (Tese
de doutorado). Universidade de São Paulo, São Paulo.
Efron, B. (1979). Bootstrapping methods: another look at the jacknife.
Annals of Statistics, 7(1), 243-267. http://dx.doi.org/10.1214/
aos/1176344552.
Empresa de Pesquisa Energética – EPE. (2017). Balanço Energético
Nacional 2017: ano base 2016. Rio de Janeiro: EPE. Retrieved from
https://ben.epe.gov.br/downloads/Relatorio_Final_BEN_2017.pdf Farrel, M. J. (1957). The measurement of productive efficiency. Journal
of the Royal Statistical Society. Series A (General), 120(3), 253-290.
http://dx.doi.org/10.2307/2343100.
process case. Environmental Progress & Sustainable Energy, 34(6), 1748-1755. http://dx.doi.org/10.1002/ep.12159.
Simar, L. (1992). Estimating efficiencies from frontier models with panel data: a comparison of parametric, non-parametric and semi-parametric methods with bootstrapping. Journal of Productivity
Analysis, 3(1), 171-203. http://dx.doi.org/10.1007/BF00158775.
Simar, L., & Wilson, P. W. (1998). Sensitivity analysis of efficiency score: how to bootstrap in nonparametric frontier models. Management
Science, 44(1), 49-61. http://dx.doi.org/10.1287/mnsc.44.1.49.
Simar, L., & Wilson, P. W. (2000). A general methodology for bootstrapping in non-parametric frontier models. Journal of Applied Statistics, 27(6), 49-61. http://dx.doi.org/10.1080/02664760050081951.
Simar, L., & Wilson, P. W. (2007). Estimation and inference in two-stage semi-parametric models of production processes. Journal
of Econometrics, 136(1), 31-64. http://dx.doi.org/10.1016/j.
jeconom.2005.07.009.
Stewart, C., Matousek, R., & Nguyen, T. N. (2016). Efficiency in the Vietnamese banking system: a DEA double bootstrap approach.
Research in International Business and Finance, 36, 96-111. http://
dx.doi.org/10.1016/j.ribaf.2015.09.006.
Thanassoulis, E. (1996). Assessing the efficiency of schools with pupils of different ability using data envelopment analysis. The Journal
of the Operational Research Society, 47(1), 84-97. http://dx.doi.
org/10.1057/jors.1996.8.
Vasconcellos, V. A., Canen, A. G., & Lins, M. P. E. (2006). Odentificando as melhores práticas operacionais através da associação benchmarking-DEA: o caso das refinarias de petróleo. Pesquisa Operacional, 26(1), 51-67. http://dx.doi.org/10.1590/S0101-74382006000100003. Wang, J., Zhao, T., & Zhang, X. (2016). Environmental assessment
and investment strategies of provincial industrial sector in China - analysis based on DEA model. Environmental Impact Assessment
Review, 60, 156-168. http://dx.doi.org/10.1016/j.eiar.2016.05.002.
Wanke, P., & Barros, C. (2014). Two stage DEA: an application to major Brazilian banks. Expert Systems with Applications, 41(5), 2337-2344. http://dx.doi.org/10.1016/j.eswa.2013.09.031.
Wijesiri, M., Viganò, L., & Meoli, M. (2015). Efficiency of microfinance institutions in Sri Lanka: a two-stage double bootstrap DEA approach. Economic Modelling, 47, 74-83. http://dx.doi.org/10.1016/j. econmod.2015.02.016.
theories of capital structure. Organizações Rurais & Agroindustriais, 18(2), 140-153.
Masoud, M., Kozan, E., Kent, G., & Liu, S. Q. (2016). An integrated approach to optimize sugarcane rail operations. Computers &
Industrial Engineering, 98, 211-220. http://dx.doi.org/10.1016/j.
cie.2016.06.002.
Mello, J. C. C. B. S., Meza, L. A., Gomes, E. G., Serapião, B. P., & Lins, M. P. E. (2003). Análise envoltória de dados no estudo da eficiência e dos benchmarks para companhias aéreas brasileiras. Pesquisa
Operacional, 23(2), 325-345.
http://dx.doi.org/10.1590/S0101-74382003000200005.
Moraes, M. A. F. D., Bacchi, M. R. P., & Caldarelli, C. E. (2016). Accelerated growth of the sugarcane, sugar, and etanol sectors in Brazil (2000-2008): effects on municipal gross domestic product per capita in the south-central region. Biomass and Bioenergy, 91, 116-125. http://dx.doi.org/10.1016/j.biombioe.2016.05.004. Neves, M. F., Kalaki, R. B., Trombin, V. G., & Rodrigues, J. M. (2016).
Sugarcane industry development analysis from the perspective of agro-industrial system quantification. Research in Agriculture, 1(2), 42. http://dx.doi.org/10.22158/ra.v1n2p42.
Pigott, T. D. (2001). A review of methods for missing data. Educational
Research and Evaluation, 7(4), 353-383. http://dx.doi.org/10.1076/
edre.7.4.353.8937.
Salgado, A. P. Jr., Carlucci, F. V., Bonacim, C. A. G., Novi, J. C., & Pacagnella, A. C. Jr. (2014). Onvestment potential for new sugarcane plants in Brazil based on assessment of operational efficiency. The
International Food and Agribusiness Management Review, 17(2), 41-64.
Retrieved from http://EconPapers.repec.org/RePEc:ags:ifaamr:167904 Salgado, A. P. Jr., Pimentel, L. A. S., Dliveira, M. M. B., & Novi, J. C.
(2017). D impacto nas variações das matrizes energéticas e uso da terra: estudo sobre a eficiência ambiental do G20. Revista Eletrônica
de Administração, 86, 306-332.
Schafer, J. L., & Graham, J. W. (2002). Missing data: our view of the state of the art. Psychological Methods, 7(2), 147-177. http://dx.doi. org/10.1037/1082-989X.7.2.147. PMid:12090408.