Working
Paper
403
On the Effects of Non-tariff Measures on
Brazilian Exports
Lucas P. do C. Ferraz
Marcel Ribeiro
Pedro Monasterio
CCGI - Nº05
Working Paper Series
Os artigos dos Textos para Discussão da Escola de Economia de São Paulo da Fundação Getulio Vargas são de inteira responsabilidade dos autores e não refletem necessariamente a opinião da
FGV-EESP. É permitida a reprodução total ou parcial dos artigos, desde que creditada a fonte.
Escola de Economia de São Paulo da Fundação Getulio Vargas FGV-EESP
On the Effects of Non-tariff Measures on Brazilian Exports
∗Lucas P. do C. Ferraz† Marcel Ribeiro‡ Pedro Monasterio§
June 2015
Abstract
This article proposes an alternative methodology for estimating the effects of non-tariff measures on trade flows, based on the recent literature on gravity models. A two-stage Heckman selection model is applied to the case of Brazilian exports, where the second stage gravity equation is theoretically grounded on the seminal Melitz model of heterogeneous firms. This extended gravity equation highlights the role played by zero trade flows as well as firm heterogeneity in explaining bilateral trade among countries, two factors usually omitted in traditional gravity specifications found in previous literature. Last, it also proposes a economic rationale for the effects of NTM on trade flows, helping to shed some light on its main operating channels under a rather simple Cournot’s duopolistic competition framework.
Keywords: Non-tariff Measures, SPS , TBT, extensive margin of exports, selection model, firm heterogeneity.
Jel Classification: C01, F13, L13.
1
Introduction
An important trend in trade policy in recent decades is the remarkable reduction of tariff barriers imposed on international trade. This pattern is both a result of several trade liberalization rounds at the GATT/ WTO level and, more recently, the consequence of the explosion of regional trade agreements worldwide. Just over the last twenty years, more than four hundred preferential trade agreements were notified at the WTO. Over the same period, however, the multilateral trade system has also witnessed a growing number of notifications of non-tariff measures such as TBT (Technical Barriers to Trade) and SPS (Sanitary and Phytosanitary measures) being submitted by its members, with their legal underpinnings claimed to be based on both the TBT and SPS agreements formalized at the Uruguay round.
Despite the fact that notifications of TBT and SPS measures are expected to be grounded in pre-existing international standards and scientific evidence, its widespread dissemination among WTO members raised concerns of a new wave of protectionism, now disguised under the umbrella of trade regulation on product standards and safety.
∗Lucas Ferraz gratefully acknowledges financial support from INMETRO. †Sao Paulo School of Economics – FGV.
Surprisingly, there is a scarce literature on the effects of such regulations on international trade, specially in the case of Brazil. Based on a comprehensive data set and addressing some recent criticisms on the correct specification of gravity models, this paper tries to fill this gap, bringing new evidence on the impacts of TBT and SPS measures over Brazilian exports. Moreover, it also proposes a simple economic rationale for the effects of those measures on trade flows, based on standard oligopoly theory.
2
Related Literature
According to the WTO (World Trade Organization), Sanitary and Phytosanitary (SPS) measures may be defined as any measures applied: (1) “to protect human or animal life from risks arising from additives, contaminants, toxins or disease-causing organisms in their food; (2) to protect human life from plant - or animal - carried diseases; (3) to protect animal or plant life from pests, diseases, or disease-causing organisms; (4) to prevent or limit other damage to a country from the entry, establishment or spread of pests”. By the same token, Technical Barriers to Trade (TBT) “cover all technical regulations, voluntary standards and the procedures to ensure that these are met, from car safety to energy-saving devices, to the shape of food cartons. TBT measures can still cover topics related to human health such as pharmaceutical restrictions or the labeling of cigarettes, nutrition claims and concerns, quality and packaging regulations”.
SPS and TBT measures are generally classified as non-tariff measures (NTM). Most of the empirical studies on the effects of NTM on bilateral trade flows are based on standard gravity models. Regardless of the real objectives of the imposition of non tariff measures such as TBT and SPS by importing countries, several of existing studies have pointed out their likely negative effects on trade (Leamer; 1990; Moenius; 2004; Disdier et al.; 2008; Kee et al.; 2009).
firms in gravity equations. Among this new generation of empirical studies addressing the impacts of NTM on trade flows are Disdier and Marette (2010) and Crivelli and Groschl (2012). Both studies take into consideration the possible existence of sample selection bias in their gravity equations but ignore the issue of firm heterogeneity.
According to the work by Helpman et al. (2008) if the probability to become an exporter is correlated to the decision on how much to export, the estimated impact of NTM on trade flows using standard gravity OLS regressions are likely to be downward biased. Regarding firm heterogeneity, the authors point out that standard gravity equations “confound the effects of trade barriers on firm-level trade with their effects on the proportion of exporting firms”. Accordingly, if firm heterogeneity is not somehow included as a explanatory variable in standard gravity equations, its absence may induce an upward bias on the estimated effects of NTM on trade flows.
The issue of sample selection bias in gravity models can be properly addressed through the Heckman’s selection model (Heckman; 1979). In this article, we use Heckman’s model on its two-stage version. The first stage specifies a Probit model which (ceteris paribus) estimates the impact of a NTM on the probability of a firm to become an exporter. The first stage also estimates the inverse Mills ratio (the so called Heckman’s lambda) that must be added as a additional explanatory variable in the (second stage) standard gravity equation. Its noteworthy that the second stage equation estimates the impact of a NTM on bilateral trade flows, conditional on the fact that firms are already exporters.
The issue of firm heterogeneity can be also addressed in the second stage gravity equation through the fraction of exporting firms in each sector. Based on the seminal model of heterogeneous firms by Melitz (2003), Helpman et al. (2008) show that the fraction of exporting firms in each exporting sector and bilateral trade flow can be estimated based on the inverse of the cdf of the unit-normal distribution applied to the estimated first stage probabilities of a firm to become an exporter. The estimated fraction of exporting firms in each sector for each bilateral trade flow can then be added as a regressor in the second stage standard gravity equation.
This article is organized in three more sections. The next section (section 3) explains in detail how the database for our panel estimates was built. Section 4 shows the results of our estimations and discusses the main issues involved. Section 5 concludes.
3
Sample and Non-tariff Measures Database
3.1 Sample
We could have used data at the HS06 disaggregated level, but the notifications are defined mostly in four digits or less. Tariff data used in this work are sectoral simple averages. The advantage of using simple averages - rather than the weighted averages by trade flows - is to circumvent possible endogeneity in the estimation procedure.
Tariff data has many missings which would decrease our sample four fold. In order to fill as many as possible missings with a simple but reasonable rule, we proceeded as follows. When there was missing information on applied tariffs for a product j, importer i at period t, we used the mean tariff over countries form the same product and year. When the missing data was from a country member (not member) from Mercosur, we used the mean from countries members (not members) of Mercosur. One can think of this procedure as representing the notion of the Most Favored Nation (MFN) clause, which is the usual treatment of tariffs in the GATT (General Agreement on Tariffs and Trade) legal framework. Strictly speaking, the MFN clause would input this importing country to replace its missing import tariff to a value equal to the minimum import tariff among countries which do not have a FTA or PTA with this particular country. Since this would change substantially the distribution of tariffs, we believed it would be more reasonable to input the mean. Most importantly, our results are robust to the exclusion of tariffs from the sample.
GDP data were obtained from the World Bank. We used GDP data in current dollars since the 4-digit export data is only available in current dollars as well. We also used sea transport costs associated with importing from the Trading Across Borders database (Doing business, World Bank). More specifically, we use the number of documents required to import as an excluded variable in our two-step Heckman selection model.
The information on non-tariff measures (TBT and SPS) applied to Brazilian exports was mostly sourced from World Trade Organization (WTO) database. It will be explained in detail in the next subsection.
Our sample consists of 179 importers (countries and territories), 1222 (HS04) products observed over eight years, from 2006 to 2013. The time span was limited by the availability of sea transport costs which starts at 2006 for most of countries.
3.2 Building a database on non-tariff measures applied to Brazilian exports
we used additional information available from other sources such as the Brazilian National Institute of Metrology, Quality and Technology (Inmetro) and the Centre for WTO Studies (CWS). While Inmetro provided us product codes for additional TBT notifications, the CWS provided the codes for the additional SPS notifications. Data from Inmetro start in 2001. Product codes were available at the HS04 level.
We defined a non-tariff measure as a specific criteria imposed by an importing country over the exports of its trade partners with respect to a specific product. Therefore, one notification may define several measures. Thus, our measure of NTM was constructed by the following steps. First, we assigned notifications to their respective HS04 products. The following criteria was used: i) notifications with regard to HS02 codes were assigned to all of its breakdowns of HS04 codes; ii) notifications with regard to HS06 codes were discarded since the export data are in HS04 level;1 iii) the notifications belonging to the European
Union were assigned to their respective members taking into account the date of entry for each country.
The literature usually usually treats the UE as a single country when it comes to member countries notifications of SPS and TBT measures. However, when working with panel data this may be misleading since the number of UE member countries increases over time in the sample. This is particularly important as the UE is one of the most active issuers of TBT and SPS notifications as well as one of Brazil’s main trade partners.
The construction of the dummy variable for measures, N T Mijt, followed the criteria below:
N T Mijt=
1 if t ≥τij
0 if t < τij
wheretdenotes year andτij is the first the year when the importing countryinotified a given TBT, SPS or both measures on productj. SP Sijt and T BTijt dummies are defined analo-gously but only using TBT or SPS measures. Implicitly, its was assumed that, once notified, measures do not expire. For instance, a SPS measure issued in 2002 will not only impose restrictions in that year but over all years afterwards. In principle, countries may withdraw their notifications, but the WTO database do not provide this information. In practice, however, we believe that new measures usually impose more restrictive requirements over pre-existing ones, so that authorities do not bother to withdraw the less restrictive measures. Figure 1 shows the number of new measures adopted from 1995 to 2013 for all countries in the sample, from the perspective of exporting firms in Brazil. It is clear that the number of measures have increased in the 2000’s. However, it is important to point out that we had limited information on the notifications of TBT measures before 2001, as the dataset sourced from INMETRO starts at this year. When it comes to SPS measures, our dataset
Figure 1: Adoption of new SPS and TBT by year
0
10,000
20,000
30,000
40,000
Number of measures
1995 1996 1997 1998 1999 2000 2001 2002 2003 2004 2005 2006 2007 2008 2009 2010 2011 2012 2013 2014
SPS TBT
from CWS starts in 1995.
Notwithstanding the fact that our sample starts in 2006, we used information from NTM issued from 1995 up to 2013, as they get accumulated through time.
It is important to acknowledge the distribution of measures among products. Figure 2 reveals this information at the two-digit classification of the harmonized system (HS02). While SPS measures are widespread over agricultural chapters, TBT measures tend to be concentrated in a few chapters related to manufacturing activities. 2
Moreover, chapters related to agribusiness are heavily affected by both types of measures. Therefore, it is important to distinguish the effects of these types of measures on producing firms in exporting countries, since they affect different sectors as well as are likely to impose distinct requirements on imports.
In this study, the dummy variables for TBT and SPS measures treat in a symmetric way the intrinsic potential for each of those measures to affect trade flows. Obviously, this could lead to misleading conclusions about their impacts on trade flows since their effects could be very different in terms of trade restrictiveness. To our knowledge, there is no paper in the literature that was able to classify each of these measures according to their potential to affect trade flows in a satisfactory way. The treatment of each SPS and TBT measures by their potential to affect trade flows would demand, to say the least, a very time consuming
2The most affected chapter by SPS measures is 02 (Meat). For TBT, the most affected chapters are 84 (Machinery and
Figure 2: Adoption of new SPS and TBT by product
0
10,000
20,000
30,000
40,000
Number of measures
01 02 03 04 05 06 07 08 09 10 11 12 13 14 15 16 17 18 19 20 21 22 23 24 25 26 27 28 29 30 31 32 33 34 35 36 37 38 39 40 41 42 43 44 45 46 47 48 49 50 51 52 53 54 55 56 57 58 59 60 61 62 63 64 65 66 67 68 69 70 71 72 73 74 75 76 78 79 80 81 82 83 84 85 86 87 88 89 90 91 92 93 94 95 96 97
SPS TBT
and deep technical examination of each existing measure, with quite uncertain and likely questionable results. Therefore, this issue is out of the scope of this work.
4
Empirical strategy
The literature quantifying the impacts of NTM on trade flows is scarce and generally uses linear regression models.3 One exception, for instance, is Crivelli and Groschl (2012) which
uses the same econometric framework as the one applied in this article but only for a limited number of sectors and for a specifc set of NTM related to specific trade concerns.
Helpman et al. (2008) shows that to measure barriers to trade properly it is essential to take into account the extensive margin decision, i.e., whether to export or not. Therefore, empirical works on gravity models should also take into consideration zero bilateral trade flows between countries in the sample, which usually account for a large share of the ob-servations. This point is even more pronounced in our sample since we use bilateral trade data at the HS04 level. Therefore, the probability of a particular product not being traded by a pair of countries is much larger than the probability of that pair not to trade at all. Therefore, the extensive margin is even more critical in our case.
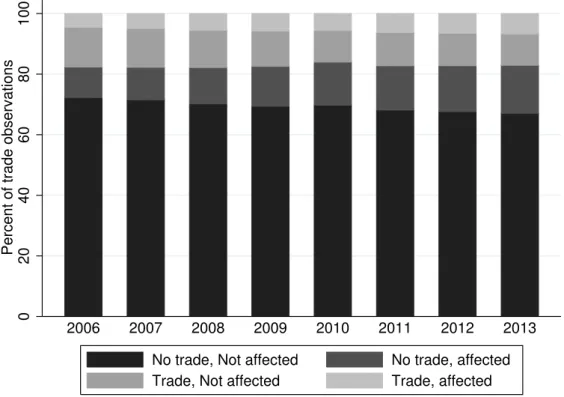
Figure 3 show the share of observations by year depending on whether bilateral trade flows are zero or positive as well as whether it is affected by measures or not. Some points
are noteworthy. First, around 80% of the observations in the sample correspond to zero trade flows, which would be neglected in the case of simple OLS regressions. Second, over 10-15% of the zero trade flows are affected by a NTM. If the absence of trade were induced by the presence of a NTM one would underestimate the effects of the NTM on trade if not taking this into account. Finally, the NTM coverage is broad once the majority of the Brazilian exporting products are affected by at least one NTM.
Figure 3: Trade and Non-tariff Measures
0
20
40
60
80
100
Percent of trade observations
2006 2007 2008 2009 2010 2011 2012 2013
No trade, Not affected No trade, affected Trade, Not affected Trade, affected
Note: Author’s calculations based on 179 importing countries and 1222 HS04 products.
Existing NTM are likely to impose higher fixed and/or variable costs for exporting firms in order to attend the required standards. This explain why a NTM is usually viewed as a trade barrier. Despite of that, there are alternative channels through which a NTM can actually induce higher exports from affected countries. For instance, it may be the case that compliance with a NTM could increase foreign demand for exporting firms, so long as importers associate complying behavior to higher quality producers. Another important channel that can lead to higher exports after a NTM is imposed is through its general equilibrium effects. Since NTM are multilateral in nature and exporting firms are hetero-geneous in productivity, the expected change in relative international production costs due to compliance with a given NTM tend to favor the most productive players in the export market.
that they operate as legal barriers to trade as its is assumed, for instance, in Kee et al. (2009). As a matter of fact, our results show that there are products which are affected positively by both TBT and SPS measures as well as products which are affected negatively by them. Most importantly, NTM may also affect the extensive margin of trade, which standard linear regression gravity models, by its very nature, are not able to capture.
Therefore, we follow the specification by Helpman et al. (2008) where the extensive margin decision of a exporting firm is represented by the following Probit model (first stage equation in Heckman’s two-stage model):
ρijt ≡P r(Tijt= 1|W∗) = Φ
β∗N T Mijt+Zijtθ∗+α∗i +γ
∗
j +η
∗
t
(1)
where Tijt is an indicator variable which is equal to one if there are positive Brazilian exports of product j to country i in period t. W∗ = N T Mijt Zijt α∗
i γj∗η∗t
denote the vec-tor of all observables. The intensive margin decision is given originally by the following specification (second stage equation):
yijt =βN T Mijt+βλλˆijt+log(βzexp(ˆzijt+ ˆλijt)−1) +Xijtθ+αi+γj +ηt+εijt (2)
with εijt ∼ N(0, σ2) that has correlation ρ with the structural error from first step. yist denote the (FOB) value of exports of a HS04 productjfrom Brazil, in periodt, to destination i. The parameters αi(α∗i), γj(γj∗) and ηt(ηt∗) are dummies of importers, products and years, respectively. Xijt is a vector for a standard set of gravity control variables and Zijt is the vector which includes Xijt as well as the excluding variable from the first stage equation.
The variables ˆzijt = Φ−1(ˆρijt) and ˆλijt ≡ λ(ˆzijt) = φ(ˆzijt)
Φ(ˆzijt) denote firm heterogeneity and the inverse Mills ratio (non-selection hazard) which are constructed based on the extensive margin estimation. The inverse Mills ratio control for the extensive margin decision from the first stage equation (possible selection bias due to existing zero trade flows). Following the specification by Helpman et al. (2008) and given that our data is disaggregated at the product level, the variable ˆzijt represents the within-product Brazilian firm heterogeneity.
Equation (2) is an extended gravity equation that can be derived from the Melitz model of heterogeneous firms (Melitz (2003)), as described in detail by Helpman et al. (2008). However, as discussed by Helpman et al. (2008), their findings on the relevance of sample selection bias and firm heterogeneity in gravity equations are robust to any other formula-tions, including linear versions of equation (2). Due to the large dimension of our sample, the non-linear gravity specification proved extremely time consuming, requiring several days for a single simulation. Therefore, we opted for the linear specification of equation (2), replacing the term in logs (on its right-hand side) by the single variable ˆzijt4.
4This same linear version of equation (2) is also tested in Helpman et al. (2008) showing outstanding robustness. In order
to avoid colinearity, the variables ˆzijt= Φ−1(ˆρijt) and ˆλijt≡λ(ˆzijt) = φ(ˆzijt)
Control variables includes importer’s GDP and applied tariffs. Since we are estimating the effects of non-tariff measures on Brazilian exports it is essential to include tariffs in the gravity equation, once NTM might be used as protectionist instruments replacing standard tariff barriers. Since Brazil is the only exporter in the sample, the importer country fixed effects controls for all time-invariant conventional gravity variables such as distance, common religion, language and legal origin, land border, colonial ties and so on.
For appropriate identification of Heckman’s second stage equation, we selected variables to be excluded from the second stage equation (where they must have no explanatory power) but to be included in the first stage. In this regard, Helpman et al. (2008) use information on the regulation costs of firm entry at the country pair level. More specifically, they build a country pair index on the number of documents and time required to start a business. This article uses regulation costs that are trade-specific and so we believe this must be a more appropriate instrument. Therefore, the number of documents required to import a standardized cargo by sea at the destination country was selected as the excluded variable in the first stage5. This information was sourced from the Trading Across Borders database
(Doing Business, World Bank).
Even though we controlled for product fixed effects, there are roughly two reasons for the effects of NTM to be different across sectors. First, Brazilian sectors differs in terms of competitiveness. Second, a NTM can specify very different requirements depending on the sector it applies. Therefore, in order to capture sector-specific effects of NTM on trade flows, a extended gravity specification was built where the dummy variables for SP Sijt and
T BTijt measures were allowed to interact with sectorial dummies. Since there were 1222 sectors at the HS04 level in the original sample, we took a more parsimonious approach and introduced a new set of sectorial dummy variables at the 2-digit classification level covering 96 chapters. In the final specification, therefore, we added 182(= 96×2) more regressors into the model, instead of 2444 as it would be the case if we decided to stick to the original specification. Last, the HS02 specific coefficients can capture variation over its HS04 sub-sectors which would not be possible with HS04 specific coefficients instead. Hence, we believe this final extended specification may allow more reliable estimates when it comes to sector-specific effects of NTM on trade.
5
Results
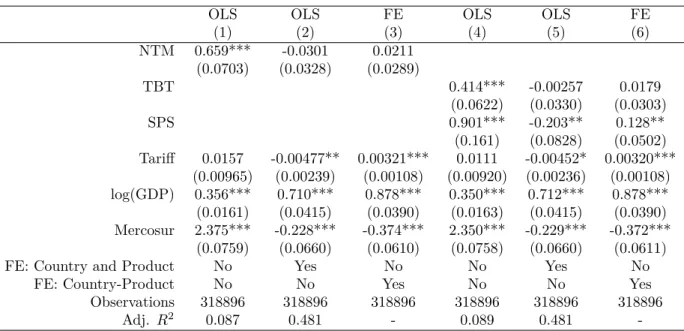
Table 1 reports the estimated effects of NTM on Brazilian exports applying rather traditional econometric approaches with gravity models, for the aggregated version of the gravity model (when the sector-level effects of NTM are not taken into consideration). The idea is to show
5Since Helpman et al. (2008) had limited information on country pair regulatory costs, they decided to work with “religion”
how misleading traditional approaches may be, when some of the issues raised in the recent literature on gravity models are ignored. While columns 1, 2 and 3 reports the effects of NTM (TBT + SPS) on Brazilian exports, columns 4, 5 and 6 split the NTM dummy variable into two distinct dummies: one to capture the effects of TBT measures and another one to capture the effects of SPS measures. As shown in column 1 for a pooled OLS regression, when no fixed effects are taken into consideration, the impacts of NTM on trade flows are positive and statistically significant at 1%. When both country-specific and product-specific fixed effects are added to the model (column 2), it turns out that the estimated coefficient on the NTM dummy variable becomes negative and statistically not different from zero. Column 3 shows the results now using a fixed panel specification where the estimated coefficient on the NTM dummy variable becomes positive but remains statistically not different from zero. When the NTM dummy variable is split into TBT and SPS dummies, the results are qualitatively similar, exception made to the coefficient on the SPS measure, that now becomes statistically different from zero through columns 4-6.
Table 1: Aggregate effect of NTMs on Brazilian exports: OLS and Fixed effects
OLS OLS FE OLS OLS FE
(1) (2) (3) (4) (5) (6)
NTM 0.659*** -0.0301 0.0211 (0.0703) (0.0328) (0.0289)
TBT 0.414*** -0.00257 0.0179
(0.0622) (0.0330) (0.0303)
SPS 0.901*** -0.203** 0.128**
(0.161) (0.0828) (0.0502) Tariff 0.0157 -0.00477** 0.00321*** 0.0111 -0.00452* 0.00320***
(0.00965) (0.00239) (0.00108) (0.00920) (0.00236) (0.00108) log(GDP) 0.356*** 0.710*** 0.878*** 0.350*** 0.712*** 0.878*** (0.0161) (0.0415) (0.0390) (0.0163) (0.0415) (0.0390) Mercosur 2.375*** -0.228*** -0.374*** 2.350*** -0.229*** -0.372***
(0.0759) (0.0660) (0.0610) (0.0758) (0.0660) (0.0611)
FE: Country and Product No Yes No No Yes No
FE: Country-Product No No Yes No No Yes
Observations 318896 318896 318896 318896 318896 318896
Adj. R2 0.087 0.481 - 0.089 0.481
-Note: Product cluster-robust standard errors in parenthesis. All regressions includes time fixed effects.
The simulations for the two-stage Heckman selection model are shown in Table 2. As in Table 1, the first columns in the table (columns 1-4) show the results for the effects of NTM on Brazilian exports, while the last columns (columns 5-8) show the results for the individual effects of both TBT and SPS measures.
sector-level extensive margin of Brazilian exports while the second stage equation explains the sector-level intensive margin decision of existing exporters. Results in Table 2 suggest that a NTM can affect both the sector-level extensive and intensive margins decisions.
Table 2: Aggregate effect of NTMs on Brazilian exports: Heckman and HMR(2008)
Probit OLS Heckman HMR Probit OLS Heckman HMR
(1) (2) (3) (4) (5) (6) (7) (8)
NTM -0.0558*** -0.0302 -0.147*** -0.0251 (0.0135) (0.0328) (0.0321) (0.0514)
TBT -0.0452*** -0.00258 -0.116*** 0.00167
(0.0125) (0.0330) (0.0320) (0.0456)
SPS -0.150*** -0.203** -0.397*** -0.189
(0.0353) (0.0828) (0.0844) (0.131) Tariff 0.00682*** -0.00477** 0.00993*** -0.00539 0.00703*** -0.00452* 0.0105*** -0.00518
(0.00179) (0.00239) (0.00259) (0.00527) (0.00176) (0.00236) (0.00252) (0.00530) log(GDP) 0.321*** 0.710*** 1.146*** 0.681*** 0.323*** 0.712*** 1.150*** 0.682***
(0.0159) (0.0416) (0.0461) (0.224) (0.0159) (0.0416) (0.0457) (0.220) Mercosur -0.157*** -0.228*** -0.393*** -0.214* -0.158*** -0.229*** -0.396*** -0.214* (0.0289) (0.0661) (0.0655) (0.126) (0.0289) (0.0661) (0.0655) (0.125)
log(Doc.) -0.0429*** -0.00390 -0.0438*** -0.00412
(0.0126) (0.0298) (0.0126) (0.0298)
Mills 2.829*** 2.836***
(0.125) (0.121)
Heterog. 0.0908 0.0941
(0.694) (0.680)
Obs. 1638279 318896 318873 318896 1638302 318896 318873 318896
Adj. R2 0.526 0.481 0.502 0.481 0.526 0.481 0.502 0.481
Note: Product cluster-robust standard errors in parenthesis. All regressions includes country, product and time fixed effects.
A qualitative assessment of the results reported in the first and second columns of Table 2 suggest that most of the variables that help to explain the extensive margin decision of Brazilian exporters (Probit estimation) also explain their intensive margin decisions (pooled OLS). The resulting correlation between residuals from the two equations highlights the importance of zero trade flows to be taken into account in gravity estimations, as it points out to the existence of sample selection bias. As a matter of fact, when the Mills ratio estimated in the first-stage is added to the second stage equations (columns 3 and 7) the results clearly suggest that ignoring sample selection bias in traditional gravity models (columns 2 and 6) may lead to a significant underestimation of the effects of NTM on trade flows (downward bias). When it comes to the effects of sector-specific firm heterogeneity on Brazilian exports, results in columns 4 and 8 suggest that they are not statistically different from zero. Moreover, controlling for sector-specific firm heterogeneity does not seem to alter significantly the coefficients from traditional gravity estimations using OLS (columns 2 and 6), even though it tends to slightly understate their effects on trade flows, as predicted by Helpman et al. (2008).
more important than controlling for firm heterogeneity when it comes to explaining the impacts of NTM on Brazilian sector-level exports. This result is in apparently in conflict with Helpman et al. (2008) predictions about the relative magnitude of these two effects, suggesting that the higher relevance of firm heterogeneity in explaining trade flows, as obtained by them using country-level bilateral trade flows, may be dependent on the existing level of aggregation in the database.
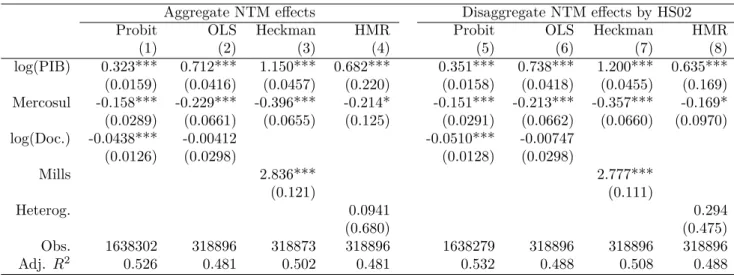
Table 3 reports the results for the extended model, when 96 (HS02) sector dummy vari-ables are allowed to interact with both TBT and SPS dummy varivari-ables, resulting in 192 new regressors. Results in columns 1 to 4 are the same as the ones reported in columns 5 to 7 of Table 2 for the group of controls and are represented again for the sake of comparison. As can be seen from columns 5 to 8 in Table 3, extending the model to capture the sector-level impacts of TBT and SPS measures slightly improves the fit without significantly changing the coefficients for the group of control variables, attesting the robustness of our results.
Table 3: Disaggregate effect vs aggregate specification
Aggregate NTM effects Disaggregate NTM effects by HS02
Probit OLS Heckman HMR Probit OLS Heckman HMR
(1) (2) (3) (4) (5) (6) (7) (8)
log(PIB) 0.323*** 0.712*** 1.150*** 0.682*** 0.351*** 0.738*** 1.200*** 0.635*** (0.0159) (0.0416) (0.0457) (0.220) (0.0158) (0.0418) (0.0455) (0.169) Mercosul -0.158*** -0.229*** -0.396*** -0.214* -0.151*** -0.213*** -0.357*** -0.169* (0.0289) (0.0661) (0.0655) (0.125) (0.0291) (0.0662) (0.0660) (0.0970)
log(Doc.) -0.0438*** -0.00412 -0.0510*** -0.00747
(0.0126) (0.0298) (0.0128) (0.0298)
Mills 2.836*** 2.777***
(0.121) (0.111)
Heterog. 0.0941 0.294
(0.680) (0.475)
Obs. 1638302 318896 318873 318896 1638279 318896 318896 318896
Adj. R2 0.526 0.481 0.502 0.481 0.532 0.488 0.508 0.488
Note: Product cluster-robust standard errors in parenthesis. All regressions includes country, product and time fixed effects.
It is important to notice that the estimated coefficients from the two-stage Heckman selection model do not coincide with the marginal effects. For instance, since our results suggest that firm heterogeneity does not play a role in explaining Brazilian sectoral exports, the marginal effects for the second stage equation can be calculated as: 6
me=β+βλ h
λ(β∗N T Mijt+Zijtθ∗ +α∗i +γ
∗
j +η
∗
t)−λ(Zijtθ∗+α∗i +γ
∗
j +η
∗
t) i
(3)
where, formally, me =E[yijt|W∗, N T Mijt = 1]−E[yijt|W∗, N T Mijt = 0]
5.1 Sectorial results and policy implications
Results from the two-stage Heckman selection model suggested that, on average, a NTM works as a trade barrier for both margins of Brazilian exports, extensive and intensive, harming the trade performance of both potential as well as current exporters in the country. As new production requirements are imposed to exporting firms, higher production costs are an obvious channel through which a NTM may affect exporters.
However, a sector-level analysis on the effects of NTM over Brazilian exports reveals that its effects on trade are not unambiguously negative. For instance, Figures 4 and 5 show the sector-level marginal effects of TBT and SPS on Brazilian exports, respectively, stemming from the first-stage equation of the (extended) Heckman selection model.
Figure 4: Marginal effect of SPS on sectoral Brazilian exports: Probit
23,68%
-15.00% -13.00% -11.00% -9.00% -7.00% -5.00% -3.00% -1.00% 1.00% 3.00% 5.00% 7.00% 9.00% 11.00% 13.00% 15.00%
1 2 3 4 6 7 8 10 12 13 16 17 19 20 21 26 28 29 30 31 32 36 38 39 40 41 43 4447 48 50 51 63 67 70 81 83 86 93 94 95 96
Agriculture Agribusiness Extrativism Industry
Note: Marginal effects of products with statistically significant coefficients at 5 %.
Figure 5: Marginal effect of TBT on sectoral Brazilian exports: Probit
-10.00% -9.00% -8.00% -7.00% -6.00% -5.00% -4.00% -3.00% -2.00% -1.00% 0.00% 1.00% 2.00% 3.00% 4.00% 5.00% 6.00% 7.00% 8.00% 9.00% 10.00%
1 2 3 5 6 8 9 14 15 16 17 18 19 20 21 22 23 24 25 26 29 31 32 33 36 37 38 40 41 43 45 51 53 54 55 56 57 58 59 60 61 62 63 64 65 67 68 69 70 71 72 81 82 83 84 86 87 89 91 93 94 95
Agriculture Agribusiness Extrativism Industry
Note: Marginal effects of products with statistically significant coefficients at 5 %.
firms, increasing fixed costs to export. Third, compliance with a NTM may positively af-fect consumer preferences in importing countries, shifting import demand and consequently bursting exports. Fourth, more efficient exporters tend to be more resilient to increasing costs of production then less efficient ones. Therefore, higher production costs are expected to be relatively more harmful to the exports of less efficient suppliers. In this case, depend-ing on the magnitude of relative effects, more efficient suppliers may be better off with the imposition of a NTM.
The four operating channels can be better clarified through the equilibrium equations of a rather simple Cournot model of duopolistic competition, where firm 1 is the domestic exporter and firm 2 is a foreign competitor. Assuming, for the sake of simplicity, that these two firms export a homogeneous good, with fixed and marginal costs given respectively by K1, c1, K2 c2, and that foreign demand is given by P = α−q1 −q2, the Cournot-Nash
equilibrium exporting volumes can be straightforwardly derived as:
q1 =
α−2c1+c2
3 ;q2 =
α−2c2+c1
3 (4)
π1 = (
α−2c1 +c2
3 )
2 −K
1;π2 = (
α−2c2+c1
3 )
2−K
2 (5)
From the equilibrium equations, it becomes clear how a NTM may affect the intensive and extensive margin decisions of exporting firms, according to equations (4) and (5), respec-tively. Through these equations, it is also clear how each of the four channels mentioned in previous paragraphs may influence firms decisions. Other things equal, (1) increasing marginal costsc1 and c2 lead to lower equilibrium exports; (2) increasing fixed costs K1 and
K2 may lead to zero equilibrium exports, in case profits become negative; (3) increasing
foreign demand α lead to higher equilibrium export volumes; (4) if firm 1 (2) marginal costs become sufficiently higher, firm 2 (1) will have incentives to raise its equilibrium ex-ports, while firm 1 (2) will lose market-share. Therefore, the net effect of a NTM on trade flows may be either positive or negative, depending on the relative magnitude and possible interactions among each of the four operating channels described.
Figure 6: Marginal effect of SPS on sectoral Brazilian exports: Heckman
325% 227% 210% 712% 1370%
-100.00% -85.00% -70.00% -55.00% -40.00% -25.00% -10.00% 5.00% 20.00% 35.00% 50.00% 65.00% 80.00% 95.00% 110.00% 125.00% 140.00% 155.00%
1 2 3 4 6 8 101112131516171819202224252627282930313334353940414243485063677073767881828386 879396
Agriculture Agribusiness Extrativism Industry
Note: Marginal effects of products with statistically significant coefficients at 5 %.
participation of SMEs (Small and Medium sized Enterprises) in the international market. Ignoring the sector specific additional costs demanded for compliance with existing TBT and SPS measures in importing countries may significantly undermine the expected benefits of those policies.
When it comes to the intensive margin decisions, Figures 6 and 7 show that, though predominantly negative, existing TBT and SPS measures can again contribute to burst exports in several sectors of the Brazilian economy. Comparing their effects across sectors, while the negative effects of SPS measures tend to be evenly distributed among sectors in Brazil, the negative effects of TBT measures tend to be relatively more concentrated in capital intensive sectors, as one would expect, given the relatively higher concentration of TBT measures imposed on manufacturing exports.
Figure 7: Marginal effect of TBT on sectoral Brazilian exports: Heckman
289% 187%
-100.00% -85.00% -70.00% -55.00% -40.00% -25.00% -10.00% 5.00% 20.00% 35.00% 50.00% 65.00% 80.00% 95.00% 110.00% 125.00% 140.00% 155.00%
1 2 3 4 5 6 7 8 9 11 12 13 14 16 17 18 19 21 22 23 24 25 26 28 29 31 32 33 35 36 37 38 39 40 41 43 48 52 54 55 56 57 58 59 60 62 63 64 65 66 69 70 71 72 74 76 78 81 82 84 86 87 89 90 92 93 94 95
Agriculture Agribusiness Extrativism Industry
Note: Marginal effects of products with statistically significant coefficients at 5 %.
6
Final remarks
importing countries, its widespread use has raised suspicions of a new wave of protectionism among WTO members.
Surprisingly, little evidence is available regarding the effects of those measures on trade flows, particularly in the case of Brazil. While not formally addressing the eventual oppor-tunistic use of NTM against Brazilian exports, this paper has shown that TBT and SPS measures can indeed work as significant trade barriers for exporting firms in Brazil, depend-ing on the sector where they are applied. In more extreme sector-level cases, existdepend-ing SPS and TBT measures can even block the export potential of Brazilian firms, as the magnitudes of their estimated effects have suggested when the two-stage Heckman selection model was applied.
This paper has also touched upon another set of relevant issues on the impacts of NTM on trade flows. Starting with a new econometric specification based on the previous work by Helpman et al. (2008), it has shown how mild gravity approaches on the effects of NTM over trade flows may be misleading. When it comes to the channels through which a NTM may affect trade flows, this paper has presented a quite simple although formal theoretical framework based on oligopoly theory, able to clarify the net effects of NTM on both the extensive and intensive margins decisions of exporting firms. This simple framework offers a clear-cut economic rationale for the fact that existing TBT and SPS measures may not only work as trade barriers, but also as instruments to promote exports.
References
Anderson, J. E. and van Wincoop, E. (2003). Gravity with gravitas: A solution to the border puzzle,American Economic Review 93(1): 170–192.
Crivelli, P. and Groschl, J. (2012). The impact of sanitary and phytosanitary measures on market entry and trade flows,Technical report, Ifo Working Paper Series.
Disdier, A.-C., Fontagné, L. and Mimouni, M. (2008). The impact of regulations on agricul-tural trade: Evidence from the sps and tbt agreements,American Journal of Agricultural Economics90(2): 336–350.
Disdier, A.-C. and Marette, S. (2010). The combination of gravity and welfare approaches for evaluating nontariff measures, American Journal of Agricultural Economics 92(3): 713– 726.
Fontagné, L., Mimouni, M. and Pasteels, J.-M. (2005). Estimating the impact of environ-mental sps and tbt on international trade, Integration and Trade Journal22: 7–37.
Helpman, E., Melitz, M. and Rubinstein, Y. (2008). Estimating trade flows: Trading part-ners and trading volumes, The Quarterly Journal of Economics123(2): 441–487.
Kee, H. L., Nicita, A. and Olarreaga, M. (2009). Estimating trade restrictiveness indices*,
The Economic Journal 119(534): 172–199.
URL: http://dx.doi.org/10.1111/j.1468-0297.2008.02209.x
Leamer, E. E. (1990). Latin america as a target of trade barriers erected by the major developed countries in 1983,Journal of Development Economics 32(2): 337–368.
Melitz, M. J. (2003). The impact of trade on intra-industry reallocations and aggregate industry productivity,Econometrica 71(6): 1695–1725.
Moenius, J. (2004). Information versus product adaptation: The role of standards in trade,
Technical report, Working Paper, International Business & Markets Research Center.