João Miguel Monteiro
Localization studies of the FemXAB protein
family in
Staphylococcus aureus
LISBOA
UNIVERSIDADE NOVA DE LISBOA
FACULDADE DE CIÊNCIAS E TECNOLOGIA
DEPARTAMENTO DE CIÊNCIAS DA VIDA
João Miguel Monteiro
Localization studies of the FemXAB protein
family in
Staphylococcus aureus
Dissertação apresentada para a obtenção do Grau de Mestre
em Genética Molecular e Biomedicina, pela Universidade
Nova de Lisboa, Faculdade de Ciências e Tecnologia
Orientador:
Doutora Mariana Gomes de Pinho (ITQB/UNL)
Co-orientadora:
Profª. Doutora Ana Madalena Ludovice (FCT/UNL)
LISBOA
Acknowledgements
Abstract
Sumário
Contents
Introduction ... 1
Methicillin resistant Staphylococcus aureus ... 1
Genetic mechanisms underlying bacterial resistance to -lactams ... 2
Peptidoglycan synthesis ... 4
Fem family of proteins ... 9
Structural studies of Fem proteins ... 13
Biochemical studies of the Fem proteins in vitro activity ... 17
Materials and Methods ... 18
Bacterial strains and plasmids ... 18
Molecular cloning methods ... 20
S. aureus transformation and transduction ... 22
Construction of derivatives of the FemXAB proteins ... 24
Mutagenesis of the femA gene ... 28
Cell wall analysis ... 29
Electrophoretic analysis of proteins by SDS-PAGE ... 31
Minimum inhibitory concentration assays ... 31
Fluorescence microscopy ... 32
Substrate depletion experiments ... 32
Results ... 33
Construction of fluorescent derivatives of FemXAB ... 33
Localization of the FemXAB family of proteins ... 41
Fem proteins co-localization ... 50
Inactivation of the femA gene ... 54
Substrate dependency of the FemXAB family of proteins for localization ... 56
Discussion ... 60
1
Introduction
Methicillin resistant
Staphylococcus aureus
Staphylococcus aureus is a Gram-positive coccus that is usually part of the human flora, mostly inhabiting the skin and the nasopharynx. However, it can also cause a wide range of infections, from skin and soft tissue infections to pneumonia, septicemia, infective endocarditis and osteomyelitis (Wenzel and Perl, 1995). Asymptomatic nasal carriers account for one third of the population (Gorwitz et al., 2008; Kluytmans et al., 1997) and are believed to be an important source of the strains that spread among individuals (Casewell and Hill, 1986; Noble et al., 1967). S. aureus is transmitted usually by skin-to-skin contact between individuals or by contact with contaminated objects or surfaces (Kazakova et al., 2005; Lowy, 1998; Miller and Diep, 2008; Muto et al., 2003).
2
USA300, responsible for particularly rapidly progressing fatal diseases and known for easy spreadability. Unlike HA-MRSA, CA-MRSA strains infect healthy individuals without predisposing risk factors and outside the hospital setting (Chambers, 2005; Kennedy et al., 2008; Moran et al., 2006).
Methicillin resistance has a broad spectrum, covering the entire -lactam class of antibiotics, including penicillins, cephalosporins and carbapenems. Of particular note is the strain COL which was isolated from a patient in Colindale, UK, in 1961 and became probably the most studied MRSA strain (Jevons et al., 1963). MRSA strains used to be reliably susceptible to the glycopeptide vancomycin, which is usually only employed as a last resort drug; however, the ever increasing spread of MRSA infections in hospital settings prompted a significant increase in its use. This intensive selective pressure resulted in the emergence of vancomycin-intermediate (VISA) (Hiramatsu et al., 1997) and vancomycin resistant (VRSA) (CDC, 2002) S. aureus strains, further confirming the extraordinary ability of this bacterium to adapt and develop resistance. As of now, there have been reports of S. aureus isolates resistant to the most recent antibiotics introduced in clinal practice for the treatment of staphylococcal infections, namely potent protein synthesis inhibitors such as minocycline and linezolid (Bishburg and Bishburg, 2009) or the membrane depolarization effect of daptomycin (Gales et al., 2006; Hirschwerk et al., 2006; Howden et al., 2004; Llarrull et al., 2009). The development of compounds that do not inhibit bacterial growth on their own but either act synergistically with a primary antibiotic, by impairing expression of resistance, or decrease the virulence of bacterial cells, facilitating their elimination by the host immune system, seems to be an attractive alternative.
Genetic mechanisms underlying bacterial resistance to -lactams
3
carried by an exogenous DNA element designated SCCmec (staphylococcal cassette chromosome mec) inserted in the chromosome of S. aureus. SCCmec integrates at a locus known as attBscc near the origin of replication (Holden et al., 2004; Katayama et al., 2003; Kuroda et al., 2001; Luong et al., 2002), a region that appears to be a common insertion point for acquired, foreign, DNA (Mongkolrattanothai et al., 2004; Noto et al., 2008). Integration and excision of the SCCmec mobile element is, in part, mediated by recombinases of the invertase/resolvase family, encoded by the included ccr gene complex. SCCmec seems to be a staphylococcal site-specific genomic island that serves as a vehicle of transfer for various genetic markers between staphylococcal species (Ito et al., 2001), as suggested by the existence of a structurally similar genetic element lacking mecA present in the chromosome of
Staphylococcus hominis strain GIFU12263 (Katayama et al., 2003). mecA is a highly conserved gene among MRSA isolates (Oliveira et al., 2000) and it is proposed to have been originated from Staphylococcus sciuri (Wu et al., 2001) due to the finding of a mecA putative evolutionary ancestor in all isolates of this species. It seems unlikely though, that S. aureus
acquired mecA directly from S. sciuri, as the two sequences lack the necessary identity level (Couto et al., 2003). mecA encodes for a 76 kDa penicillin-binding protein, PBP2a (also referred to as PBP2’), which was found in MRSA but not MSSA strains. PBP2a has lower affinity for -lactam antibiotics than the other four PBPs native to S. aureus, and thus maintains its activity at therapeutic levels of methicillin, allowing the survival and growth of the bacteria (Hartman and Tomasz, 1984). Adjacent to mecA in the staphylococcal chromosome are mecR1, that encodes a membrane bound signal transdution protein, and
mecI, encoding a tight transcriptional regulator (Sharma et al., 1998). The transcription of
mecA can also be regulated by the plasmid-encoded bla system and it has been shown that the
bla regulator is more effective at inducing mecA than the mec regulator. Most -lactam antibiotics do not efficiently activate mecR1, explaining the occurrence of mecA positive pre-MRSA isolates that are methicillin sensitive (Kobayashi et al., 1998). Again, selective pressure through antibiotic usage has resulted in isolates that either contain both regulation systems, in which -lactam induced upregulation of mecA by the bla system allows for the transcription of PBP2a, or that display mutations/deletions in the mecI or mecA promoter region, with the same effect (McKinney et al., 2001).
4
constructing a large library of Tn551 insertional mutants in COL, it was possible to isolate mutants where the high and homogeneous level of methicillin resistance was reduced, although an intact mecA gene was still present (Berger-Bächi, 1983; de Lencastre and Tomasz, 1994). Each of these determinants was termed fem (factor essential for methicillin resistance) or aux (auxiliary) gene and approximately 30 fem genes have been identified (De Lencastre et al., 1999). Even if a strain carries mecA, the inactivation of fem genes usually leads to a heterogeneous profile of oxacillin resistance and lower minimum inhibitory concentrations of this antibiotic, despite the fact that the fem gene in question may not be essential for bacterial viability. Most of these factors are housekeeping genes that are probably present in all S. aureus strains and cover a wide array of functions, encoding proteins that have a direct or indirect role in peptidoglycan biosynthesis and turnover (ex. PBP2, FemA, MurF), proteins with putative sensory/regulatory activities (kinases or ABC transporters), alternate transcription factors (SigB) and proteins of unknown function (Berger-Bächi and Rohrer, 2002; Berger-(Berger-Bächi et al., 1992; De Lencastre et al., 1999). Although the exact relatedness of most of the fem factors to oxacillin resistance is still unresolved, their identification led to formidable insights into the structure of bacterial peptidoglycan.
Peptidoglycan synthesis
5
6
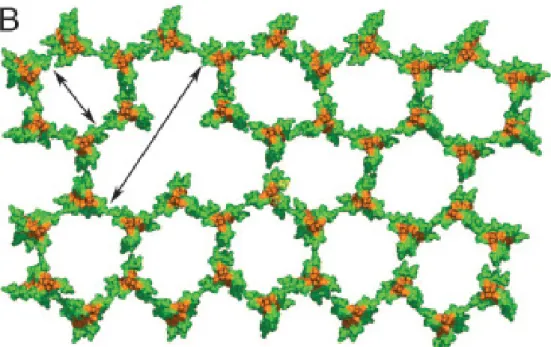
Figure 1 – Top view of the structure of the polymeric peptidoglycan segment showing the glycan strands in orange and the stem peptides in green, in agreement with the “scaffold model”. Adapted from Meroueh et al., 2006.
7
reaction, is made by the FemXAB family of transferases, adding directly and sequentially five glycines to the L-Lys residue of the stem peptide on lipid II (Kopp et al., 1996). It is postulated that the lipid II intermediate is then translocated from the inner side to the outer side of the membrane via a translocase/flippase specific activity of a yet uncharacterized protein. A homologue of the MurJ (MviN) protein identified in E. coli (Ruiz, 2008) could be a likely candidate for this function. However, it was very recently demonstrated that deletion of four homologues of murJ in Bacillus subtillis caused no defects in bacterial growth, indicating that the corresponding proteins most likely do not function as flippases in this organism (Fay and Dworkin, 2009).
Figure 2 – Membrane-bound stages of peptidoglycan biosynthesis in S. aureus. The formation of the pentaglycine interbridge, catalyzed by FemXAB proteins, precedes the translocation of the monomeric peptidoglycan unit across the cytoplasmic membrane, with subsequent polymerization via transglycosilation and transpeptidation reactions catalyzed by PBPs. UMP, uridine monophosphate; UDP, uridine diphosphate. Adapted from Schneider et al., 2004.
8
This event is mediated by the membrane anchored PBPs, localized at the extracellular surface of the cytoplasmic membrane. PBPs can catalyze both a transglycosylase activity (TGase)– elongation of the glycan strands, and a transpeptidase activity (TPase) – peptide crosslinking between glycan strands. While all S. aureus native PBPs have a TPase domain, only PBP2 is bifunctional, capable of both transpeptidation and transglycosylation reactions (Goffin and Ghuysen, 2002; Massova and Mobashery, 1998; van Heijenoort 2001). In PBP2, the TGase and TPase domains are spatially well separated (Fuda et al., 2005). The transglycosilation reaction probably occurs between the reducing end of the MurNAc present in the nascent lipid-linked PG strand, and the C-4 carbon of the glucosamine residue in the lipid-linked precursor, thus attaching the new subunit to the growing glycan chain. Transpeptidation and crosslinking are accomplished by cleavage of the D-Ala-D-Ala bond at the terminus of one stem peptide in the glycan chain, which drives energetically the subsequent reaction between the peptidyl moiety and an acceptor present on the subunit being incorporated. In S. aureus, the acceptor is the last glycine of the synthesized bridge, whereas in bacteria with direct crosslinking, transpeptidation occurs between D-Ala and the dibasic amino acid of the stem peptide being incorporated (van Heijenoort, 1998). Cell growth and division require not only the synthesis of new PG but also its breakage, remodeling and reinsertion. This is accomplished by specific hydrolases that cleave PG bonds and can be classified as muramidases, glucosaminidases, amidases, endopeptidases and carboxypeptidases. It has been proposed that the role of hydrolases in processes of cell wall turnover, cell separation and muropeptide recycling is of critical importance (Höltje and Heidrich, 2001; Shockman et al., 1996; Smith et al., 2000).
9
biosynthesis by forming a non-covalent but stable complex with D-Ala-D-Ala residues at the terminus of the stem peptides, thus blocking the access of PBPs to their substrates (Pootoolal
et al., 2002).
Fem family of proteins
Two closely linked fem factors, required for the full expression of methicillin resistance, that were identified after Tn551 insertions in the COL genome were termed femA
10
points to the hypothesis that each Fem factor may use dedicated gly-tRNAs (Kopp et al., 1996).
Figure 3– Pentaglycine side-chain formation of PG muropeptides in S. aureus. Glycines are added in a sequential fashion to L-Lysine, the third amino acid in the stem peptide. Each Fem protein has substrate specificity: FemX adds the first glycine; FemA adds the second and the third; FemB adds the fourth and fifth glycines. M, N-acetyl-muramic acid; G, N-acetyl-glucosamine. Adapted from Rohrer
et al., 1999.
11
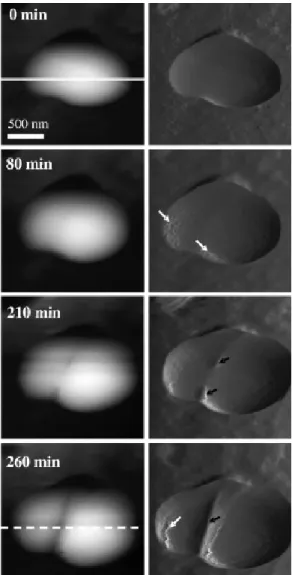
Figure 4 – Time-lapse imaging by atomic force microscopy of a single S. aureus cell prior to and after incubation with 16 µg/ml lysostaphin. Major structural changes occur, including cell swelling, splitting of the septum (black arrows) and nanoscale perforations (white arrows). Adapted from Francius et al., 2008.
Muropeptide analysis of femA mutants by HPLC techniques revealed an increase in the proportion of muropeptides with low crosslinking degree (monomers, dimers, trimers), relative to larger oligomers. Also, all pentaglycil substituted muropeptides were absent from the profile with concomitant accumulation of monomeric pentapeptides substituted with a single glycine residue and alternative muropeptides containing serine residues in the second position of the cross-bridge. Oligomers of single glycine substituted muropeptides may have been present in the muropeptide profile as well, although this was never verified. Overall, these conformational changes caused a reduction in the net degree of crosslinking by 10% in
12
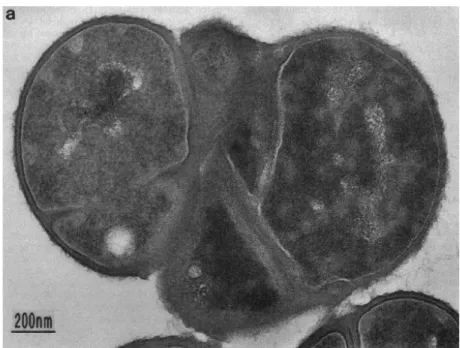
phase of di-glycine biosynthesis or addition of glycine to the stem peptide at the inner membrane (de Jonge et al., 1993). Studies on femB inactivation revealed very similar consequences on peptidoglycan composition, with shortening of the peptide interbridges to three glycines. In both cases, pleiotropic consequences were observed as, besides altered cell wall composition, cells were shown to have aberrant septum formation and retarded cell separation, the so called femA-like phenotype (Figure 5). This led to the assumption that femB
could be as important as femA, especially considering that femA and femB are transcribed in a polycistronic mRNA under the control of the same promoter (Henze et al., 1993).
Figure 5 – Thin section of S. aureus femA mutant, displaying cells with irregular septa and
defects in cell separation. Adapted from Henze et al., 1993.
13
postulated that, in order to achieve crosslinking with monoglycil bridges, a rearrangement of the whole cell wall structure seemed likely (Ling and Berger-Bächi, 1998; Sharif et al., 2009).
FemA and FemB have 39% identity and 70% similarity to each other, however, FemB cannot substitute for FemA. It is unusual for two nearly identical proteins to have such high substrate specificities and it is likely that the active sites lie near the C-terminus of the proteins, as that is the region where FemA and FemB differ the most (Ehlert et al., 1997).
femAB-like sequences have been identified not only in S. aureus but in other staphylococcal species as well (Alborn et al., 1996). Besides the aforementioned Lif factor in S. simulans, which was shown to complement a femB mutant (Tschierske et al., 1997), the epr gene in
Staphylococcus capitis also catalyses the addition of serines into the crossbridge, protecting its producer from End, a lysostaphin-like glycil-glycine endopeptidase. Crossbridges containing serine in S. aureus have been shown to be incompatible with high methicillin resistance, contrary to pentaglycil ones, so it seems that either PBP2a has strict substrate requirements or that a putative interaction of this protein with Fem-like factors is altered in the presence of serine (Sugai et al., 1997). The low frequencies of serine and alanine containing crossbridges observed in all the FemA, FemB and FemAB mutants hint at residual activities of FemAB-like proteins, with specificities to amino acids other than glycines. It seems that during S. aureus’ evolution, cells that would synthesize pentaglycil bridges could crosslink glycan strands more efficiently and, therefore, bear the osmotic pressure inside better (Berger-Bächi and Tschierske, 1998). The event that triggered this leap was probably sequence duplication of a putative ancestral fem sequence (Berger-Bächi et al., 1989).
Structural studies of Fem proteins
14
stem peptide of lipid II and coenzyme A, the latter serving as an intermediate acceptor between the glycil-tRNA and the peptidoglycan precursor. Further data didn’t support the binding of coenzyme A to FemA, indicating direct transfer from the charged tRNA to the peptide.
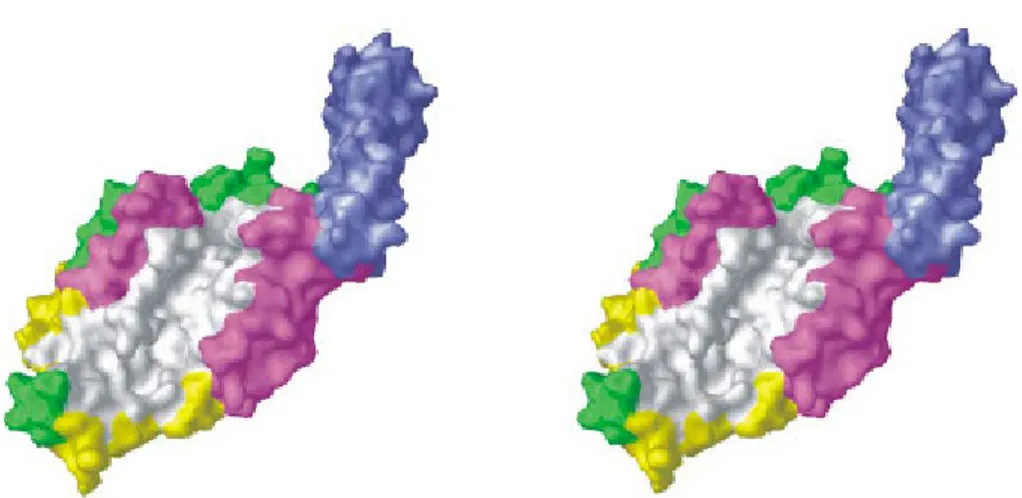
Figure 6 – Stereo view of the proposed structure of S. aureus FemA, depicting both the globular domain and the helical arms. White – deep L-shaped channel that can hold the stem peptide in an extended conformation; blue – antiparallel coiled-coil helical arms that could serve to hold an amino acid charged tRNA. Adapted from Benson et al., 2002.
15
FemA proteins interacting with each other near the substrate (Benson et al., 2002). Bacterial two hybrid studies showed homodimerization of FemA. Homodimerization was also found on FemB as well as heterodimerization between FemA and FemB, therefore it seems possible that both proteins function in a large complex attached to its substrate near the membrane. This data does not necessarily imply, however, that interaction contributes to the mechanism of glycine attachment. No interactions were found between FemX and the other Fem proteins nor between FemX monomers, suggesting that FemX is very likely a monomer in vivo, although physical interactions mediated by an auxiliary molecule cannot be ruled out (Rohrer and Berger-Bächi, 2003).
In contrast to S. aureus, Gram-negative Weissellaviridescens (basionym Lactobacillus viridescens) contains monoglycil substituted UDP-MurNAc-pentapeptide in the cytoplasm, suggesting that in these bacteria, FemX adds the glycine before the translocation to bactoprenol occurs (Hegde and Shrader, 2001). Structural analysis of the FemX protein from
Weissella viridescens (hereafter referred to as FemXwv) provided new insights into FemXAB
protein family folding. FemXwv, unlike S. aureus FemX, is active in the cytoplasm,
recognizing UDP-MurNAc-pentapeptide as a substrate and adding an alanyne. This enzyme contains one domain for UDP-MurNAc-pentapeptide binding and one for alanyl-tRNA binding (Biarrotte-Sorin et al., 2004). The overall structure of FemXwv is similar to S. aureus
FemA (Benson et al., 2002). However, the former lacks the coiled-coil arms described in the latter. This structural characteristic was proposed to divide the FemXAB family in two groups: group 1 proteins contain the helical arms and comprise FemA and most FemXAB-related sequences, including those from staphylococci, enterococci and streptococci; group 2 proteins lack the structural motif and, along with FemXwv, comprise Fem-like sequences from
Streptomyces coelicolor, Deinococcus radiodurans, Treponema pallidum and Borrelia burgdorferi (Biarrotte-Sorin et al., 2004). Streptococcus pneumoniae Fem subgroup I protein MurM incorporates either alanines or serines to the growing peptide chain. This was shown to be a consequence of allelic variability in a 35 amino acid sequence contained in the coiled-coil domain of the protein. This supports the notion that the species of aminoacyl-tRNA that is added to the peptide chain is dependent on specific interactions at the junction between the helical arms and the globular domain of Fem proteins (Filipe and Tomasz, 2000). FemXwv
16
differences observed between the complexed and the non-complexed versions of FemXwv are
minor, with noteworthy exceptions. For example, amino acid Lys36, equivalent to Lys33 of FemA, was reported to undergo a notable change in conformation, thus suggesting that it could be a critical residue for substrate binding. Domain II comprises a long channel with a global positive electrostatic surface potential that could complement the negatively charged phosphate backbone of tRNA. Interestingly, residue Tyr254 (equivalent to Tyr327 in FemA), strictly conserved across the FemXAB family, points inside the channel, presenting its side group to the entering tRNA. This orientation suggests a role in tRNA binding and recognition (Biarrotte-Sorin et al., 2004). Subsequent studies on FemXwv’s structure identified nine
residues located in the binding cavity for UDP-MurNAc-pentapeptide as possible essential factors for protein activity, six of which are depicted in Figure 7 (Maillard et al., 2005).
Figure 7 – Structure of the binding cavity of FemXwv superimposed with the UDP-MurNAc-pentapetide substrate (in magenta). Secondary structure of the protein is colored in dark blue. The FemXwv side chains of relevant residues are colored in yellow/orange for the apo wild type enzyme and in cyan for the complex. Adapted from Maillard et al., 2005.
17
bond network that connects the C-terminal D-Ala residues to the phosphate groups of UDP-MurNAc-pentapeptide and constrains the substrate in a conformation essential for transferase activity. By analogy, the corresponding residues Lys33 and Arg220 in S. aureus FemA should also be critical for the enzyme’s function, albeit in this case, the phosphate groups recognized in the lipid II are linked to bactoprenol (Maillard et al., 2005).
Biochemical studies of the Fem proteins
in vitro
activity
In vitro reconstitution of the inner-membrane bound steps of peptidoglycan synthesis, leading to the production of the lipid II-Gly5 precursor was achieved from purified lipid I,
lipid II, FemXAB proteins and glycil-tRNA synthetase. Lipid II was identified as the only substrate of the S. aureus peptidyltransferases and it was shown that these proteins were active individually and were highly substrate specific. As neither the soluble UDP-MurNAc-pentapetide nor lipid I were converted to glycine-labeled precursors, it is assumed that FemX protein and, by analogy, FemA and FemB, should recognize lipid II via the sugar moiety MurNAc-GlcNAc, which is in agreement with the aforementioned placement of the substrate in the L-shaped groove. Interestingly, when lipid II was incubated with FemXA, only lipid II-Gly3 was found. A scenario where both FemA and FemB function as homodimers, in a way
that each subunit is loaded with a Gly-tRNA to ensure sequential addition of both Gly to the growing interpeptide bridge seems likely. It is reasonable to assume that this is a tightly coordinated process interlinked with the other membrane associated steps of cell wall synthesis. Moreover, it is possible that Fem proteins are transiently associated with each other, as well as with other cell wall biosynthesis enzymes (Schneider et al., 2004).
18
Materials and Methods
Bacterial strains and plasmids
The bacterial strains and plasmids used in this study are described in Table 1.
Table 1- Strains and plasmids used in this work.
Strain/Plasmid Genotype/Description Origin/Reference
Strain
S. aureus RN4220 MSSA strain, restriction negative Rockefeller University
collection
S. aureus UK17 mecA+, femA- (Ehlert et al., 1997)
S. aureus COL Homogeneous MRSA (MIC 800 ug/ml) Rockefeller University
collection
E.coli DH5 Cloning strain, recA endA1 gyrA96 thi-1 hsdR17 supE44 relA1
ϕ80 lacZ M15
Gibco-BRL
RNpFemX-N RN4220 expressing FemX with an N-terminal GFP fusion, Ermr This work
RNpFemX-C RN4220 expressing FemX with a C-terminal GFP fusion, Ermr This work
RNFemA-C RN4220 expressing FemA with a C-terminal mCherry fusion This work
RNpFemB-C RN4220 expressing FemB with a C-terminal GFP fusion, Ermr This work
RN-FemXA RN4220 expressing FemX with an N-terminal GFP fusion and
FemA with a C-terminal mCherry, Ermr
This work
RN-FemAB RN4220 expressing FemB with a C-terminal GFP fusion and
FemA with a C-terminal mCherry fusion, Ermr
This work
COLpFemX-N COL expressing FemX with an N-terminal GFP fusion, Ermr This work
COLpFemX-C COL expressing FemX with a C-terminal GFP fusion, Ermr This work
COLFemA-C COL expressing FemA with a C-terminal mCherry fusion This work
COLpFemB-C COL expressing FemB with a C-terminal GFP fusion, Ermr This work
COL-FemXA COL expressing FemX with an N-terminal GFP fusion and FemA
with a C-terminal mCherry fusion, Ermr
This work
COL-FemAB COL expressing FemB with a C-terminal GFP fusion and FemA
with a C-terminal mCherry fusion, Ermr
19
Table 1 (cont.)
Strain/plasmid Genotype/description Origin/Reference
COLpPBP2-31 COL expressing PBP2 with anN-terminal GFP fusion, Ermr (Pinho and Errington,
2005)
Plasmid
pMAD E. coli-S. aureus shuttle vector with the bgaB gene encoding a
ß-galactosidase. Ampr/Ermr
(Arnaud et al., 2004)
pSG5082 Plasmid for C-terminal GFP fusions of proteins, Ampr/Ermr (Pinho and Errington,
2004)
pSG5086 Plasmid for N-terminal GFP fusions of proteins, Ampr/Ermr (Pinho and Errington,
2005)
pBCB4-CHERRY Plasmid for C-terminal mCherry fusions of proteins,
Ampr/Ermr
P. Pereira
(unpublished)
pFemA-C Derivative of pMAD containing femA-mCherry-femB This work
pFemB-C Derivative of pSG5082 containing femB upstream of gfpmut M. Santos
(unpublished)
pFemX-C Derivative of pSG5082 containing femX upstream of gfpmut M. Santos
(unpublished)
pFemX-N Derivative of pSG5086 containing femX downstream of gfpmut This work
pFemA-UK Derivative of pMAD containing a femA with a nonsense mutation This work
pFemA-Lys33 Derivative of pFemA-C containing a femA with a K33 A
substitution
This work
pFemA-Arg220 Derivative of pFemA-C containing a femA with an R220 A
substitution
This work
pFemA-Tyr327 Derivative of pFemA-C containing a femA with a Y327 Ala
substitution
This work
20
Molecular cloning methods
The oligonucleotide primers used in this study are described in Table 2, restriction sequences are underlined.
Table 2 – Oligonucleotide primers used in this study
Primer Name Nucleotide Sequence (5’ – 3’)
FEMAKP1 TTGGCCACTATGAGTTAGCGCTTGCTGAAGGTTATG FEMAKP2 CATAACCTTCAGCAAGCGCTAACTCATAGTGGCCAAC
FEMAKP3 TTGGCCACTATGAGTTAG
FEMAP1eco CCGGGAATTCGCAAATACGGAAATGAAATTAATTAACGAG FEMAP2 AGAACCAGCAGCGGAGCCAGCCGACTTAAAAATTCTGTCTTTAAC FEMAP3 TCCGCTGCTGGTTCTGGCGAGTTCATGATTGTGAGCAAGG FEMAP4 TTTGATAATTCCCTTCCTAGTACAGCTCGTCCATGCCACC FEMAP5 AAGGGAATTATCAAAACATGAAATTTACAGAGTTAACTGTTACCG FEMAP6bam GGCGCGCGGGATCCCTATTTCTTTAATTTTTTACGTAATTTATC
FEMARP1 AAAAGCTTTTGCTGATGCCGATGACAAAGCCTACTAC FEMARP2 TAGTAGGCTTTGTCATCGGCATCAGCAAAAGCTTTTG
FEMARP3 CAAAAGCTTTTGCTGATG
FEMAUP1bam GCTGCGGATCCGAGTTTGGTGCCTTTACAGATAG FEMAUP2eco GCAGCGAATTCGGCTCGATGTATCATACTC
FEMAUP3 ACAACTTGATGCAAATGAGT
FEMAUP4 GCTCGATGTATCATACTC
FEMAuutr CTATAAAAGTATACGCAATTAAAGCG
FEMAYP1 CAATCCATTTGAAGTTGTTGCCTATGCTGGTGGTACATC FEMAYP2 GATGTACCACCAGCATAGGCAACAACTTCAAATGGATTG
FEMAYP3 ATCCATTTGAAGTTGTTG
FEMBP1kpn GTTGGTACCGATTCCTTGAACGTGATGAG FEMBP2xho CCGTCTCGAGTTTCTTTAATTTTTTACGTAATTTATCC FEMXP1kpn GCAGGTACCTTCTTAACGCGTGATATTAG FEMXP2xho CCGACTCGAGTTTTCGTTTTAATTTACGAG FEMXP3xho AAAGGGCTCGAGATGGAAAAGATGCATATCAC FEMXP4eco CCCTTTGAATTCGATTTCAGTCGTTAATCTATTTTCG
gfpmutP1 TTTGTATAGTTCATCCATGCCATGTGTAATCC gfpmutP2 AGTAAAGGAGAAGAACTTTTCACTGGAGTTGTC
pMADII CGTCATCTACCTGCCTGGAC
21 DNA purification
For chromosomal DNA purification, cell cultures were grown to exponential phase. A 30 ml sample was collected at OD620nm of 1, pelleted and resuspended in 50mM EDTA. Cells
were then incubated at 37ºC with 5µl of lysostaphin (10 mg/ml, Sigma) and 10µl of RNAse (10mg/ml, Sigma) for 30min and, subsequently, incubated at 80ºC with Nuclei lysis solution (Promega) for 5min. Protein precipitation solution (Promega) was added and cells were incubated 10min on ice. DNA was then precipitated with isopropanol, washed with ethanol 70% and resuspended in sterile water.
Forthe screening of S. aureus mutants by PCR, genomic DNA was isolated from 1-ml cultures grown overnight using amodified alkaline wash protocol (Hall et al., 2003). Briefly, cells were pelleted,resuspended in 500 µl of alkaline wash solution (0.05M sodium citrate, 0.5 M NaOH), and incubated at room temperaturefor 20 min. Tubes were spun at 14.000 x g
for 1 min, pelletswere washed with 500 µl of 0.5 M Tris-HCl, pH 8.0, and subsequently resuspended in 100 µl of sterile water. Tubeswere placed in boiling water for 10 min and spun at 14.000 xg for 5 min. Five microliters of supernatant were used in each 50 µl PCR reaction.
Plasmid DNA from E. coli strain was extracted using Wizard SV Plus Miniprep kit (Promega). Ethanol precipitation was used for the concentration of DNA. Quantification of DNA was carried out by comparing the fluorescent intensities of the samples and DNA markers on 0.8% agarose gels stained with ethidium bromide
DNA manipulations
22
Transformation of E.coli
Competent cells were prepared according to the Rubidium chloride method (Sambrook et al., 1989). Briefly, early exponential cells (O.D.600nm = 0.3-0.4) were incubated on ice for 15min, centrifuged and resuspended in 1/3 of culture volume of RF1 buffer (RbCl 100mM; MnCl2 tetrahydrate 50mM; Potassium acetate pH 7,5 35mM; Calcium
chloride bihydrate 10mM; Glycerol 15%). Cells were incubated on ice for 15 minutes and pelleted. The pellet was resuspended in 1/2 volume of RF2 buffer (MOPS 10mM; RbCl 10mM; Calcium chloride bihydrate 75mM; Glycerol 15%) and stored at -80°C in 300 l aliquots. For the transformation, either plasmid or ligation mixtures were added to the competent cells and kept on ice for 10 min. Foreign DNA was introduced using a heat shock method (45 sec at 40°C). Cells were mixed with 1 ml LB medium and incubated at 37°C for 1h. Appropriate aliquots were spread on antibiotic selection plates.
S. aureus
transformation and transduction
Transformation of S. aureus
S. aureus competent cells were prepared essentially as previously described (Kraemer, 1990). Briefly, bacteria were grown to O.D.600nm = 0.4 and centrifuged. Cells were washed
23 Transduction with phage 80
Transduction was done as previously described (Oshida and Tomasz, 1992). For the preparation of transduction lysates, donor strains were grown in Tryptic Soy Agar (TSA, Difco) overnight at 37ºC. Cells were collected with 1ml of TSB and calcium chloride was added to a final concentration of 5 mM. Phage 80 lysate was diluted (10-2, 10-3 and 10-4) in phage buffer (1mM MgSO4, 4mM CaCl2, 50mM Tris-HCl pH 7.8, 5,9g/l NaCl and 1g/l
gelatin). The cell suspension (10µl) was mixed with 10µl of each of the phage dilutions and 3ml of phage top agar (casamino acids 3g/l, Difco; yeast extract 3g/l, Difco; sodium chloride 5,9g/l, Sigma; and agar 5g/l, Difco, pH 7.8), supplemented with 5mM of CaCl2, pre-warmed
for one hour at 45ºC. The mixture was poured onto phage bottom agar (identical to the top but with 15g/l of agar) with 5mM of CaCl2 and incubated over night at 30ºC. On the following
day, phage buffer (3ml) was added to plates showing confluent lysis. Plates were kept at 4ºC for one hour. The phage top agar and the phage buffer were then collected into a centrifuge tube and vigorously vortexed in order to disrupt the phage bottom agar. The tubes were kept for one hour inverted at 4ºC. The agar was centrifuged at 3500 rpm for 30min at 4ºC. The supernatant was collected and filtered through a 0.45 µm sterile filter. For the transduction, recipient strains were grown overnight in TSA at 37ºC. Cells were collected with 1ml TSB with CaCl2 5mM. Cell suspension (100µl) was added to the phage lysate (1µl and 10µl) and
24
Construction of derivatives of the FemXAB proteins
Construction of FemX-GFP fusions
A 650 bp fragment of the 3’ end of the femX gene was amplified from COL using primers FEMXP1kpn/FEMXP2xho, digested and cloned into Kpn/XhoI restriction sites of pSG5082, upstream and in frame with gfpmut resulting in pFemX-C. The entire femX gene was amplified from COL using primers FEMXP3xho/FEMXP4eco, digested and cloned into the XhoI/EcoRI restriction sites of pSG5086, downstream and in frame with gfpmut, resulting in pFemX-N. Both plasmids were electroporated into RN4220 competent cells and transduced to COL. Transformants were selected on Ery 10 µg/ml plates at 37ºC and successful integration of the plasmids into the chromosome was validated by PCR, with primer pairs FEMXP1kpn/GFPMUTP1 for the C-terminal fusion and GFPMUTP2/FEMXP4eco for the N-terminal fusion. C-N-terminal GFP mutants of FemX were termed RNpFemX-C and COLpFemX-C. N-terminal GFP mutants of FemX were termed RNpFemX-N and COLpFemX-N
Construction of a FemB-GFP fusion
A 660 bp fragment of the 3’ end of the femB gene was amplified from COL using primers FEMBP1kpn and FEMBP2xho, digested and cloned into KpnI/XhoI restriction sites of pSG5082, upstream and in frame with gfpmut, resulting in pFemB-C. The plasmid was then electroporated into RN4220 competent cells and transduced to COL. Transformants were selected on Ery 10 µg/ml plates at 37ºC and successful integration of the plasmid into the chromosome was validated by PCR with primer pair FEMBP1kpn/GFPMUTP1. In this way, mutants RNpFemB-C and COLpFemB-C were obtained.
Construction of FemA-mCherry fusions
25
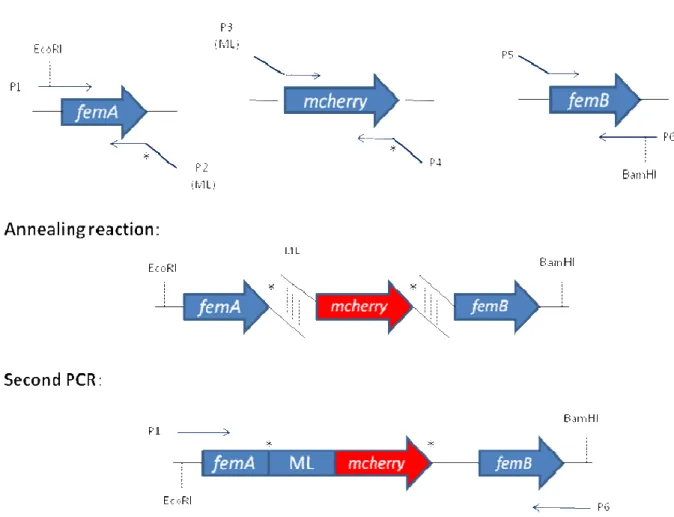
Figure 8 – Strategy for the construction of the fusion femA-mcherry-femB. ML = protein linker. P1-P6: primers FEMAP1eco, FEMAP2, FEMAP3, FEMAP4, FEMAP5 and FEMAP6bam, respectively.
26
FEMAP1eco and FEMAP6bam were used to amplify the fusion gene with the Phusion polymerase for 20 cycles of: denaturation at 98ºC for 10s, annealing at 74ºC for 20s, extension at 72ºC for 4m. The final PCR fragment was cut with EcoRI and BamHI and cloned into pMAD vector, generating plasmid pFemA-C. After extraction of the plasmid from E. coli
DH5 , restriction digest confirmation was performed with the same enzymes used for cloning and the plasmid insert was sequenced. pFemA-C was electroporated into RN4220 competent cells at 30ºC to keep the plasmid from integrating. Transformants were selected on an erythromycin 10 µg/ml plate. The plasmid was transduced from RN4220 background to COL and transductants were selected on erythromycin 10 µg/ml plates at 30ºC.
27
Figure 9 – Allelic replacement strategy using pMAD derived plasmid pFemA-C. Integration through
femA is shown but homologous recombination in the first step can also occur through the femB region. In the third step, the second recombination event and loss of the plasmid can yield a wild type strain (A) or a strain containing a femA-mcherry fusion in the femA native locus (B). Step 1 – homologous recombination between pFemA-C and the bacterial chromosome; Step 2 – integration; Step 3 – excision and loss of the plasmid.
Construction of strains encoding fluorescent derivatives of two Fem proteins
In order to generate a strain expressing simultaneously FemA-mCherry and FemB-GFP, plasmid pFemB-C was electroporated into RNFemA-C competent cells. Transformants were selected on Ery 10 µg/ml plates at 37ºC and named RN-FemAB. The fragment containing the femAB operon was transduced to COL, with selection on Ery 10 µg/ml plates at 37ºC. The resulting strain was named COL-FemAB. The presence of both fusion genes was confirmed by PCR with primers PFEMAP1eco and GFPMUTP1.
28
Transductants were selected on Ery10 µg/ml plates at 37ºC and named COL-FemXA. Integration of the plasmid was confirmed with primers GFPMUTP2 and FEMXP4eco.
Mutagenesis of the
femA
gene
A 1900 bp DNA fragment encompassing femA was amplified from strain UK17 using primers FEMAUP1 and FEMAUP2. This strain contains a nonsense mutation at position 985 of the femA gene. The PCR fragment was digested and cloned into the EcoRI/BamHI restriction sites of pMAD, generating plasmid pFemA-UK.
In order to construct mCherry-tagged femA defective mutants, the following residue replacements were performed in the femA region of the pFemA-C plasmid: Lys33 to Ala (resulting in plasmid pFemA-K33), Arg220 to Ala (resulting in plasmid pFemA-R220) and Tyr327 to Ala (resulting in plasmid pFemA-Y327). Site-directed mutagenesis was done using primer pairs FEMAKP1/FEMAKP2, FEMARP1/FEMARP2, FEMAYP1/FEMAYP2 for the Lys, Arg and Tyr mutations, respectively. Primers of each pair are complementary to each other and contain the desired mutations in the middle, to replace residues K33, R220 and Y327 with alanines. PCR reactions were done with Phusion polymerase following manufacturer’s instructions but using a template/primer concentration ratio of 2. PCR products were incubated at 37ºC for 1 hour with DpnI restriction enzyme, to digest the methylated pFemA-C template. The amplicons were ligated and transformed to DH5 competent cells. Following plasmid extraction, restriction confirmation was performed, using EcoRI and BamHI. Plasmids were sequenced to confirm the presence of the desired mutations.
29
PFEMARP3/PFEMAUP4, PFEMAYP3/PFEMAUP4 for the UK17, Lys33, Arg220 and Tyr327 mutations, respectively. Screening PCRs were done with GoTaq polymerase, following manufacturer’s instructions, but with annealing temperatures 2 ºC below the melting temperature of the primer pair, using wild-type RN4220 and the femA mutant UK17 strains as controls.
Method I – Regular methodology for excision of pMAD plasmid as described above, except
that mutants were plated at 37ºC instead of 43ºC.
Method II – Integrates were allowed to grow for 10, 15, 20 and 25 generations at 30ºC
without erythromycin, before being plated on TSA at 30ºC or 37ºC. As femA defective mutants are reported to have a fitness defect (Kusuma et al., 2007), this method aimed to isolate them before they were outcompeted by wild-type excisates in the culture.
Method III –. Integrates were allowed to grow for 10, 15, 20 and 25 generations at 30ºC
without erythromycin, before being plated on TSA supplemented with 5 µg/ml lysostaphin at 30ºC or 37ºC This method aimed at introducing selective pressure during excision, to isolate the desired mutants as soon as the second recombination event took place.
Cell wall analysis
Cell wall extract preparation
30
pH 7.2.) and 1.5 mL chloroform, were added and samples were vortexed at maximum speed for 60 s and were let to settle for 1 minute. If the sample is SDS free, the lower phase presents as clear as the control. SDS free cells were resuspended in 1 to 2 ml of water and broken with glass beads (Sigma-Aldrich) in a Bio101 Savant Apparatus (Thermo Electro Corporation). Non-broken cells and glass beads were removed by low speed centrifugation (500 x g) for 15 min. The collected broken cells were centrifuged (17.000 x g) for 15 min at 4ºC. The pellet was resuspended in 2 ml of 50 mM Tris-HCl (pH= 7) with 0.05% sodium azide and MgSO4 at final concentration of 20mM. DNase and RNase (Sigma) were added at a concentration of 10 g/ml and 50 g/ml, respectively, and the mixture was incubated for 2 h at 37ºC with agitation. The peptidoglycan associated proteins were removed by overnight incubation at 37ºC with 50 g/ml of trypsin (Whorthington) in the presence of 20 mM CaCl2. The insoluble
material was boiled again in 1% of SDS for 15 min, collected and washed with water, as described above, three times. The cell wall pellet was then treated with 8 mM LiCl for 15 min at 37ºC, collected by centrifugation (17.000 x g) for 15 min, resuspended in 100 mM EDTA (pH= 7) and again incubated for 15 min at 37ºC. The pellet was washed two times with water, resuspended in 10 ml of acetone, sonicated for 5 min and then washed again in water, lyophilized, and stored at 4ºC.
Preparation of highly purified peptidoglycan
Peptidoglycan was obtained from purified cell wall by degradation of teichoic acids with hydrofluoric acid. Lyophilized cell walls were resuspended in 2 ml of ice-cold hydrofluoric acid for 48 h at 4ºC. Peptidoglycan was recovered by centrifugation (48.000 x g) for 45 min at 4ºC. The pellet was washed twice with water, twice with 50mM Tris-HCl (pH=7) and finally again twice with water, after which samples were lyophilized.
Preparation of the muropeptides.
31 HPLC analysis of muropeptides profiles
The muropepetides profile was obtained by HPLC system analysis. The digested peptidoglycan was injected in a Chromolith column using a 3ml linear gradient from 0.05% of trifluoroacetic acid (TFA) to a 0.05 % TFA buffer with 10% acetonitrile for 26 min.
Electrophoretic analysis of proteins by SDS-PAGE
Cells were grown to exponential phase (20mL) and harvested by centrifugation (3000 x g, 4ºC). The pellet was then washed once with equal volume of PBS and resuspended in 1/20 of the original volume in PBS with 1 mM of PMSF (Sigma). The cells were disrupted with approximately 800µl of glass beads in a Bio101 Savant apparatus. Glass beads were removed by centrifugation at 500 × g for 5 min. 10µl of supernatant were mixed with an equal volume of SDS-PAGE sample buffer. Samples were applied to a 10% polyacrylamide (30% acrylamide/bis solution, 37.5:1) protein gel. The molecular weight marker used was the SDS-PAGE Molecular Weight Standards, low range(Biorad). The samples were run at 20mA for approximately 30 minutes.
Minimum inhibitory concentration assays
32
Fluorescence microscopy
S. aureus strains were grown for 16 hours on TSB, supplemented with erythromycin when needed, diluted 1:1000 in the same medium without erythromycin and allowed to grow to mid-exponential phase (O.D = 0.7). 1 ml of culture was centrifuged for 1 min at 13500 rpm at RT and resuspended in 50 µl of fresh TSB. 2 µl of culture were then placed on microscope slides with a thin film of 1% agarose prepared in PBS. When it was relevant to inspect bacterial membranes, cells were incubated with either Nile Red (Invitrogen) or FM1-43 (Invitrogen) fluorescent lipophillic dyes at 0.5-5 µg/ml for 5 minutes at room temperature with shaking, before being placed on the microscope slides. When it was relevant to inspect nucleoid shape, cells were incubated with DAPI (Invitrogen) fluorescent DNA-binding dye at 2 µg/ml for 10 minutes at room temperature with shaking, before being placed on microscope slides. Fluorescence microscopy visualizations were conducted in a Zeiss Axio Observer microscope equipped with a Photometrics CoolSNAP HQ2 camera (Roper Scientific), using Metamorph software. Analysis of fluorescent images was performed using ImageJ software.
Substrate depletion experiments
33
Results
Construction of fluorescent derivatives of FemXAB
In order to study the localization of the FemX, FemA and FemB proteins during the cell cycle, we constructed fluorescent derivatives of each protein and expressed them from their native chromosome loci in S. aureus. The FemX protein was fused either at its C-terminal (FemX-GFP) or N-C-terminal (GFP-FemX) to Green Fluorescent Protein (GFP). The FemA and FemB proteins were fused at their C-terminus to fluorescent protein mCherry (FemA-mCherry) or GFP (FemB-GFP), respectively. All fusions corresponded to the only copy of the specific fem gene present in the genome and were placed under the control of the native promoter of the respective fem genes, except gfp-femX, which was put under the control of the xylose promoter from B. subtilis (Pinho and Errington, 2005), that is contitutively expressed in S. aureus. Although each protein fusion was constructed both in RN4220 and COL backgrounds, the characterization of the mutant derivatives of the former were mostly excluded from this thesis, as RN4220 is a highly mutagenized strain and only suitable as a cloning intermediate.
34
the wt strain during the exponential phase (doubling time 50 minutes) than the wild-type strain. This suggests a growth defect of RNpFemX-C, probably because the FemX-GFP protein is only partially functional.
Figure 10 – Growth curves of MSSA strain RN4220, RN4220 expressing N-terminal (RNpFemX-N) and C-terminal (RNpFemX-C) GFP fusions to FemX and the femA-inactivated UK17 strain.
35
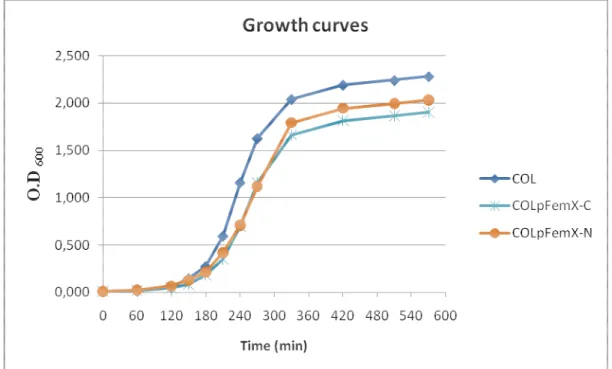
Figure 11 – Growth rates for parental MRSA strain COL and COL expressing N-terminal (COLpFemX-N) and C-terminal (COLpFemX-C) GFP fusions to FemX.
We have also determined the growth rates of strain COL expressing FemA-mCherry (doubling time 30 minutes) and FemB-GFP (doubling time 32 minutes) fusions (Figure 12), which we found to be identical to parental wild-type strain COL.
36
37
Table 3 –Minimum inhibitory concentrations of cell wall active compounds in relevant strains used in this study.
Strain
MIC (ug/ml)
Oxacillin Lysostaphin Tunicamycin Fosfomycin
RN4220 0.125 - 12 19.5
RNpFemX-N 0.125 - 12 19.5
RNpFemX-C 0.125 - 1.5 4.8
COL 800 0.016 50 1250
COLpFemX-N 800 - 50 1250
COLpFemX-C 100 - 12.5 625
COLFemA-C 800 0.016 50 1250
COLpFemB-C 800 - 50 1250
COL-FemAB 400 0.016 - -
COL-FemXA 800 - - -
UK17 (femA-) 0.19 32 - -
38
Figure 13 – A – muropeptide profiles of wild-type strain COL (in black) compared to the COL FemX-GFP (in red) derivative. The fusion of FemX-GFP to the C-terminus of FemX is shown to alter the cell wall composition significantly. Overall, a marked increase in the ratio of unsubstituted to pentaglycine-substituted muropeptides is visible in the profile of FemX-GFP. Peaks A, B, C and D are likely to be unsubstituted trimers, tetramers, pentamers and hexamers, respectively. Peaks X and Y are proposed to be alternative unsubstituted monomers (Rohrer et al., 1999). A decrease in the amount of crosslinking is also observed. B - proposed chemical structures of the peak compositions in muropeptide chromatographic analysis, according to de Jonge and Tomasz, 1992. Muropeptides are numbered according to their specific retention times. In this way, for example, a NAG-NAM-pentapeptide molecule (1) elutes first, while an octamer (21) elutes last. G= N-acetylglucosamine; M =
39
Figure 14 - Muropeptide profiles of wild-type strain COL (in black) compared to the COL FemX-GFP (in red) derivative, showing a massive increase of unsubstituted monomers (peak 1) in the cell wall composition of this mutant, relative to the parental strain. It is also shown that, unlike COL, unsubstituted muropeptides are the most prevalent species in the cell wall of COL FemX-GFP.
The same result was obtained for the FemX-GFP mutant constructed in the RN4220 background (data not shown). The most abundant peaks in the muropeptide profile of COL are 5, 11, 15, 16, 17 and 18. These correspond to monomers, dimers, trimers, etc. with at least one fully synthesized crossbridge that is not crosslinked to other muropeptide (see Figure 13, panel B). This indicates that there is a pool of muropeptides in the bacterial cell wall that are always readily available for crosslinking. In striking contrast, the muropeptide profile of the FemX-GFP mutant shows a massive accumulation of unsubstituted monomers (peak 1), with concomitant decrease of pentaglycine-containing ones (peak 5). Accordingly, there is also an increase in the ratio of unsubstituted (peak 9) to pentaglycil substituted (peak 11) dimers.
40
Taken together, the decreased growth rate of RNpFemX-C; the decreased MICs to cell wall active antibiotics of COLpFemX-C and the altered muropeptide profile of this strain, indicate a decreased function of the FemX protein due to the C-terminal GFP fusion. However, the protein has to be partially functional otherwise the cell would not be viable. It is noteworthy that COLpFemX-C can maintain nominal growth rates with a partial functioning FemX protein, unlike RNpFemX-C.
The fluorescent derivatives COLpFemX-N, COLFemA-C and COLpFemB-C were found to have muropeptide profiles similar to wild-type COL strain, as shown in Figure 15. Strain COLFemA-C seemed to display a slight reduction in the amount of crosslinking, when compared to the control, which was likely due to less material being injected into the column. These results, together with the normal growth rates and antimicrobial resistance profiles, indicate that the fusion proteins expressed in these strains are functional and therefore can be used in localization studies.
41
Localization of the FemXAB family of proteins
Staphylococcus aureus divides symmetrically by synthesizing a division septum midway through the cell. After the septum is complete, the daughter cells separate to undergo a second round of division, in which a new septum is synthesized perpendicularly to the first division plane (Tzagoloff and Novick, 1977). To characterize the localization of the Fem proteins during the cell cycle, live clonal populations derived from a single colony of the constructed strains expressing functional fluorescent derivatives of the Fem proteins were observed by fluorescence microscopy.
42
43
Figure 17 – Localization of the FemX protein with an N-terminal GFP fusion during the stages of the cell cycle in the RN4220 background. Class A –initial steps of septum synthesis, B – formation of a complete septum, C – separation of the daughter cells, D – end of division. The FemX protein is shown to localize generally to the membrane, accumulate at the tips of the new division site and along the septum. After division, FemX accumulates randomly at new membrane sites. For each class (A-D), two examples are shown. For each example: left – phase contrast image; right – GFP image.
44
Figure 18 – Localization of the FemX protein with a C-terminal GFP fusion during the stages of the cell cycle in both COL and RN4220 backgrounds. Class A – septum formation; B – separation of the daughter cells; C –end of division. The FemX protein is shown to be localized to the cytoplasm during all stages of the cell cycle. For each class (A-C), one example for the COL and one for the RN4220 background is shown. For each example: left – phase contrast image; right – GFP image.
45
Figure 19 – Blue laser light scanning of the protein extracts from the FemX-GFP mutants after SDS-PAGE separation. Lane 1 – COL expressing a GFP fusion; lane 2 – RN4220 expressing FemX-GFP fusion.
A band between 75 kDa and 100 kDa was observed in both backgrounds. This is consistent with the expected size of a FemX (~50 KDa) and GFP (~27 KDa) fusion protein, implying that GFP was not being cleaved by proteolitic activity. These results led us to believe that the GFP fusion to the C-terminal region of FemX resulted in the protein failing to localize correctly to the membrane and septum. This explains the loss of FemX activity detected on the analysis of the muropeptide profiles of these mutants and suggests that the C-terminal region may be important for proper localization.
46
Figure 20 – Localization of the FemA protein with a C-terminal mCherry fusion in the COL background during the stages of the cell cycle. Class A –initial steps of septum synthesis, B – formation of a complete septum, C – separation of the daughter cells, D – end of division. The FemA protein is shown to localize generally to the membrane, accumulate at the tips of the new division site and along the septum. After division, FemA accumulates randomly at new membrane sites. For each class (A-D), two examples are shown. For each example: left – phase contrast image; right – TX red image.
47
Figure 21 – Localization of the FemB protein with a C-terminal GFP fusion in the COL background during the stages of the cell cycle. Class A –initial steps of septum synthesis, B – formation of a complete septum, C – separation of the daughter cells, D – end of division. The FemB protein is shown to localize generally to the membrane, accumulate at the tips of the new division site and proceed along the septum. After division, FemB accumulates randomly at new membrane sites. For each class (A-D), two examples are shown. For each example: left – phase contrast image; right – GFP image.
48
during septum formation and division there is always a pool of Fem proteins localized to the “lateral” membrane.
49
Figure 22 – Quantification of septum vs. lateral membrane fluorescence ratios for COLpFemX-N, COLFemA-C, COLpFemB-C, COLpPBP2-31 (expressing a GFP-PBP2 fusion) and COL stained with membrane dye Nile Red (n=100 for each strain). All cells displayed closed septa. The average ratios calculated for each fluorescent signal are depicted as straight lines: FemX – 1.91; FemA – 1.98; FemB – 1.85; PBP2 – 3.97; Membrane – 2.02. Fem proteins are shown to be evenly distributed along the membrane, unlike PBP2, which accumulates at the septum.
50
Fem proteins co-localization
After having shown that Fem proteins did not accumulate at the septum before or during division, we wondered whether the apparently random membrane accumulations often observed during the cell cycle were coincident between proteins. Therefore, we decided to express pairs of two fluorescent proteins in the same cell. For this purpose, mutants COL-FemAB, expressing both FemA-mCherry and FemB-GFP fusions, and COL-FemXA, expressing both GFP-FemX and FemA-mCherry fusions were constructed. Table 4 summarizes the characterization of these mutants, which were found to have doubling times, MICs for oxacillin and lysostaphin, and muropeptide profiles similar to the parental strain COL.
Table 4 – Characterization of the parental MRSA strain COL and the derived FemAB and COL-FemXA strains
Strain Doubling time (min)
MIC (µg/ml)
Cell wall
analysis Oxacillin Lysostaphin
COL 29 800 0.016 COL
COL-FemAB 36 400 0.016 = COL
COL-FemXA 35 800 0.016 = COL
51
Figure 23 – Co-localization of FemA and FemB proteins during the cell cycle in COL-FemAB strain. Stage A – initial steps of septum synthesis; B – formation of a complete septum; C – separation of the daughter cells. Each stage: phase contrast image, TX red image, GFP image. Both proteins were found to be present in the same subcellular structures at the same time.
52
Figure 24 – Co-localization of FemX and FemA proteins during the cell cycle, as observed in the COL-FemXA strain. Stage A – septum formation; B – division/separation. Each stage – phase contrast image; TX Red contrast image; GFP contrast image. The proteins were found to co-localize during the end of division/separation in all cells observed. 36% of cells that displayed a division septum formed (n=300) were found to have FemX localized to it, while FemA was localized to distinct spots in the membrane. 64% of cells that displayed a division septum formed were found to have both proteins co-localized.
53
Figure 25 – Septum/membrane fluorescence ratios in 100 chosen cells of the COL strain expressing GFP-FemX and FemA-mCherry. These cells displayed green fluorescence at the septum and red fluorescence seemingly absent from it. An average 1.5 signal ratio was detected for the GFP signal, while an average 0.74 signal ratio was detected for mCherry. These results indicate that at this defined point in the cell cycle, there is localization of FemX at the septum while FemA is absent from it.
54
Inactivation of the
femA
gene
After having determined the localization of FemX, FemA and FemB, we wanted to assess if interactions between these proteins were important for localization. For this, we attempted to inactivate the femA gene, to see if the FemB protein would de-localize in the absence of FemA or in the presence of a FemA protein which had lost its activity (but not its correct folding). As femA is encoded in the policystronic femAB operon, we opted not to knockout the entire gene, to avoid interfering with the mRNA transcript. Instead, we attempted to promote the allelic replacement of femA using the thermosensitive plasmid pMAD (see Methods) by a copy of the femA gene from the UK17 strain, containing a premature stop codon. We have also tried to substitute putative key residues of FemA by alanines by site-directed mutagenesis. The selected residues had been proposed to have a role in substrate recognition (Lysine33 and Arginine220) or in tRNA-Gly stabilization (Tyr327) (Biarrotte-Sorin et al., 2004; Maillard et al., 2005).
Allellic replacement of wild-type copies of S. aureus femA by the desired mutant alleles proved to be unsuccessful in all attempts. The pMAD plasmid carrying the mutant
femA allele could integrate into the chromosome by homologous recombination. However, this always happened through the region downstream of the mutation and therefore we never obtained a mutant allele under the control of the native promoter. Furthermore, excision of the plasmid from the chromosome always generated wild-type strains and never strains containing the desired mutations. Figure 26 shows the attempted replacement of wild-type
55
Figure 26 – Strategy for allellic replacement of the wild-type femA gene in RN4220 by the femA allele from the UK17 strain, cloned into the pMAD plasmid. This allele contains a point mutation (depicted by an asterisk) leading to a premature stop codon and subsequent expression of a truncated FemA protein. Integration through homologous recombination always occurred downstream of the point mutation, despite the upstream region having the same length. The second recombination event and loss of the plasmid always yielded wild-type colonies. Step 1 – homologous recombination between pFemA-UK and the bacterial chromosome; step 2 – integration (blue colonies); step 3 – second recombination event and loss of the plasmid (white colonies). Flag – native promoter of the femAB
operon.
We modified the protocol for allelic replacement in several ways in order to maximize chances of isolating mutants:
56
ii) As the doubling time of UK17 is twice as long as RN4220, it could be expected that growth of mutants carrying an inactivated femA locus would quickly be overtaken by wild-type cells. To try to avoid this, the excision protocol was modified. Colonies with integrated pMAD plasmid carrying the femA mutant alleles were allowed to grow for only 10 generations, instead of 30 (see Methods) at the permissive temperature before being plated. This process aimed to provide enough time to ensure that the second recombination event would likely occur, but trying to circumvent the expected fitness deficit of femA mutants, by plating earlier. With 10 generations only, the number of white colonies obtained was only 1%. Again, 20 excisates for each mutation were screened and none found to contain the desired replacements.
iii) As femA mutants are lysostaphin resistant, we also tried to introduce a final plating step in a lysostaphin 5 µg/ml plate, to select only the allelic replacement mutants and inhibit growth of wild-type cells. Colonies grew on lysostaphin plate but none of them carried the desired mutations in the femA gene and were proposed to be spontaneous mutants.
Despite the repeated attempts and different modifications of the protocol, inactivation of
femA was always unsuccessful. These results suggest that femA may well be a lethal target and that the only reason that UK17 can cope with lack of FemA activity is by having compensatory mutations elsewhere in the chromosome.
Substrate dependency of the FemXAB family of proteins for localization
57
biosynthesis, therefore blocking peptidoglycan synthesis at the initial step in the cytoplasm (Kim et al., 1996). Cells were incubated for 30 minutes with 10 times the determined MICs for each antibiotic and each strain, before being visualized under the microscope. Figures 27-29 depict the effect of these compounds on the localization of FemX, FemA and FemB, respectively. Cells appeared more aggregated and smaller/larger, when compared to untreated cells. These variations in cell size seem to be random in the studied populations. Localization of the three proteins on the lateral membrane and septa was lost. FemXAB proteins were shown to delocalize randomly across the cell, forming patches or dense accumulations. There was no observed difference between the treatment with fosfomycin and tunicamycin. These results suggest that the presence of the substrate is required, directly or indirectly, to keep FemX, FemA and FemB in place.
58
59