Maria José Barros Araújo
Improvement of performance indicators
after Scrum re-implementation in software
development teams
Master Thesis
Master's in Engineering Project Management
Work done under the guidance of:
Professor Anabela Tereso
Professor Pedro Ribeiro
A
CKNOWLEDGEMENTS
I would first like to thank my thesis advisors, Anabela Tereso and Pedro Ribeiro, of the Engineer School at the University of Minho, who supported me throughout my path and always answered to all of my doubts.
I would also like to thank my mentor, Timothy Bishop, who held my hand through my learning path, watched me take little steps and then gave me the opportunity to walk alone, never leaving my side. To Eleanor Wilson, the person that grew worked and fought for Scrum, alongside me. I would also like to thank my Team members, who believed I was capable to be a good Scrum Master, always supporting and listening to me. Without you guys, this project would never have had existed.
To Martina, for all the patience, hard work, and for being by my side, through all my doubts, fears and insecurities. To all my Erasmus+ friends - Laura, Jeroen, and Martón - thanks for making me laugh, and for always encouraging me to never give up.
Finally, I must express my gratitude to my parents and to Beatriz and Helena for supporting me from far and for always giving me the courage to keep going on, even though not understanding anything about my research or about my job, they always kept me going and made me feel loved.
A
BSTRACT
The business world is more competitive than ever, and companies must adapt to a very fast passed consumer behaviour. Small and medium companies must be quick on their feet and have the ability to rapidly answer to the shifts in trends and products.
In order to do so, businesses have shifted from Traditional project management to an Agile project management. Even though Agile project management has become very trendy, implementing an Agile framework requires work and an adaption period.
Living Map adopted an Agile framework – Scrum – one year ago, but because they changed their Scrum Master, the process gradually broke and became problematic.
This research was proposed by the company, to re-implement Scrum and analyse the changes on the performance indicators of the Software Development teams. The main goal was to collect data after each Sprint completion and compare it to old data collected previously by the researcher whilst being an intern.
The first step was to re-define and re-implement Scrum within the two development teams. The researcher acted as the Scrum Master of both teams in order to be closer to them.
This dissertation describes the re-implementation of Scrum, the adaptive measurements that were made during a 5-iteration cycle and the changes on the performance indicators that originated from it.
In general, not only did every performance indicators had a significant growth but also, the understanding of Scrum increased, and the overall satisfaction of the Teams also improved. KEYWORDS: Agile; Scrum; Performance; Research and Development.
R
ESUMO
O mundo de negócios tem-se tornado mais competitivo do que nunca. As empresas têm de se adaptar às alterações rápidas do comportamento dos consumidores. Pequenas e médias empresas têm de ter a habilidade de responder rapidamente às mudanças das tendências e dos produtos.
De forma a conseguirem fazer isto, há uma mudança da gestão de projetos tradicional para gestão de projetos ágil. Porém, implementar uma mentalidade ágil requer esforço e um período de adaptação.
A empresa Living Map adotou um framework ágil - Scrum - há um ano atrás, mas por terem mudado de Scrum Master, o processo acabou por se deteriorar e tornar problemático.
A pesquisa de reimplementar o Scrum em duas equipas de desenvolvimento de software foi
proposta pela empresa, e o investigador desempenhou o papel de Scrum Master de ambas as
equipas. O objetivo principal foi recolher dados após o fim de cada Sprint e comparar os
mesmos com dados recolhidos de Sprints anteriores.
O primeiro passo foi redefinir e reimplementar Scrum em duas equipas de desenvolvimento de
software. Esta dissertação descreve a reimplementação de Scrum, as medidas adaptativas que
foram tomadas durante um ciclo de 5 iterações e as mudanças dos indicadores de performance que ocorreram.
Em geral, não só os indicadores de performance tiveram um crescimento significativo, mas o conhecimento sobre Scrum e a satisfação das equipas melhorou.
I
NDEX
Figure index ... xi
Table index ... xiii
Symbols and Acronyms ... xv
1. Introduction ... 1
1.1 Background ... 1
1.2 Living Map ... 2
1.3 Objectives and Motivation for the Research ... 3
1.4 Research Methodology ... 3 1.5 Structure ... 4 2. Literature Review ... 7 2.1 Traditional Methodologies ... 7 2.1.1 Waterfall ... 8 2.1.2 Spiral Model ... 9 2.2 Agile Methodologies ... 11 2.2.1 Extreme Programming ... 13 2.2.2 Kanban ... 14 2.2.3 Lean Development ... 16 2.2.4 Scrum ... 17
3. Case studied: Living map ... 29
3.1 Living Map ... 29 3.2 SWOT analysis ... 31 3.3 PEST Analysis ... 33 3.4 Competitors Analysis ... 35 3.4.1 Digital Mapping ... 35 3.4.2 Positioning System ... 35 3.5 Organisational Structure ... 36 3.6 Areas ... 37
3.6.1 Geographic Information System ... 37
3.6.2 User Centred Design ... 38
3.6.3 Software Development Process ... 39
3.7 Creating a map ... 43
3.8.1 Geographic Information System ... 44
3.8.2 Software Development ... 46
3.8.3 Design ... 49
4. Solution Proposed ... 51
4.1 Identifying the Problem ... 51
4.1.1 Scrum Flow ... 51 4.1.2 Scrum Ceremonies ... 53 4.1.3 Ticket Flow ... 53 4.2 Solution Proposed ... 54 4.2.1 Scrum Flow ... 54 4.2.2 Scrum Ceremonies ... 55 4.2.3 Ticket Flow ... 55 4.3 Summary ... 56 5. Results ... 59 5.1 Performance Indicators ... 59 5.2 Re-take Scrum ... 60 5.3 Past Results ... 61 5.3.1 Sprint A ... 61 5.3.2 Sprint B ... 62 5.3.3 Sprint C ... 64 5.4 New Results ... 65 5.4.1 Sprint I ... 65 5.4.2 Sprint II ... 66 5.4.3 Sprint III ... 67 5.4.4 Sprint IV ... 69 5.4.5 Sprint V ... 71 5.4.6 Sprint VI ... 72 5.5 Overall Performance ... 75
5.6 New Scrum Flow ... 82
6. Conclusions and Future Research ... 85
References ... 89
Appendix I - Data Collected Per Sprint ... 91
Appendix II - Complementary Spreadsheet ... 93
F
IGURE INDEX
Figure 1 - Waterfall Framework ... 9
Figure 2 - Spiral Model ... 10
Figure 3 - Kanban Board ... 15
Figure 4 - Burn Down Chart ... 24
Figure 5 - Scrum Flow ... 24
Figure 6 - Organisational Structure ... 36
Figure 7 - GIS Sprint Board ... 45
Figure 8 - GIS Ticket Workflow ... 45
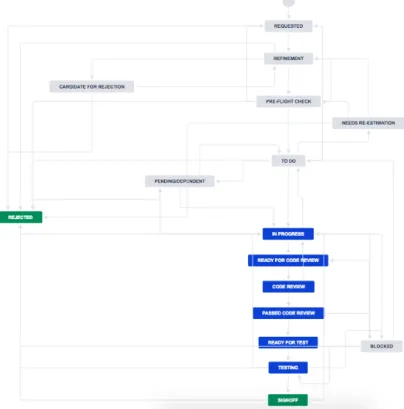
Figure 9 - Software Development Sprint Board ... 47
Figure 10 - Software Development Refinement Board ... 47
Figure 11 - Software Development Ticket Workflow ... 48
Figure 12 - Design Kanban Board ... 49
Figure 13 - Design Ticket Workflow ... 50
Figure 14 - Refinement Label ... 56
Figure 15 - Ticketing Label ... 56
Figure 16 - Backlog Label ... 56
Figure 17 - Team Capacity Calculator ... 60
Figure 18 - Burn Down Chart - Team A - Sprint A ... 62
Figure 19 - Burn Down Chart - Team B - Sprint A ... 62
Figure 20 - Burn Down Chart - Team A - Sprint B ... 63
Figure 21 - Burn Down Chart - Team B - Sprint B ... 63
Figure 22 - Burn Down Chart - Team A - Sprint C ... 64
Figure 23 - Burn Down Chart - Team B - Sprint C ... 64
Figure 24 - Burn Down Chart - Team A - Sprint I ... 65
Figure 25 - Burn Down Chart - Team B - Sprint I ... 66
Figure 26 - Burn Down Chart - Team A - Sprint II ... 66
Figure 27 - Burn Down Chart - Team B - Sprint II ... 67
Figure 28 - Burn Down Chart - Team A - Sprint III ... 68
Figure 29 - Burn Down Chart - Team A – Sprint III.2 ... 68
Figure 31 - Burn Down Chart - Team A - Sprint IV ... 70
Figure 32 - Burn Down Chart - Team A - Sprint IV.2 ... 70
Figure 33 - Burn Down Chart - Team B - Sprint IV ... 70
Figure 34 - Burn Down Chart - Team A - Sprint V ... 71
Figure 35 - Burn Down Chart - Team A - Sprint V.2 ... 72
Figure 36 - Burn Down Chart - Team B - Sprint V ... 72
Figure 37 - Burn Down Chart - Team A - Sprint VI ... 73
Figure 38 - Burn Down Chart - Team A - Sprint VI.2 ... 73
Figure 39 - Burn Down Chart - Team B - Sprint VI ... 74
Figure 40 - Points Planned and Achieved - Team A ... 75
Figure 41 - Points Person/Day Team A ... 76
Figure 42 - Sprint Goal Achievement Team A ... 76
Figure 43 - Points Planned and Achieved Team B ... 77
Figure 44 - Points Person/Day Team B ... 78
Figure 45 - Sprint Goal Achievement Team B ... 79
Figure 46 - Points Planned and Achieved Joined ... 79
Figure 47 - Points Person/Day Joined ... 80
Figure 48 - Sprint Goal Achievement Joined ... 81
T
ABLE INDEX
Table 1 - Living Map SWOT analysis ... 31
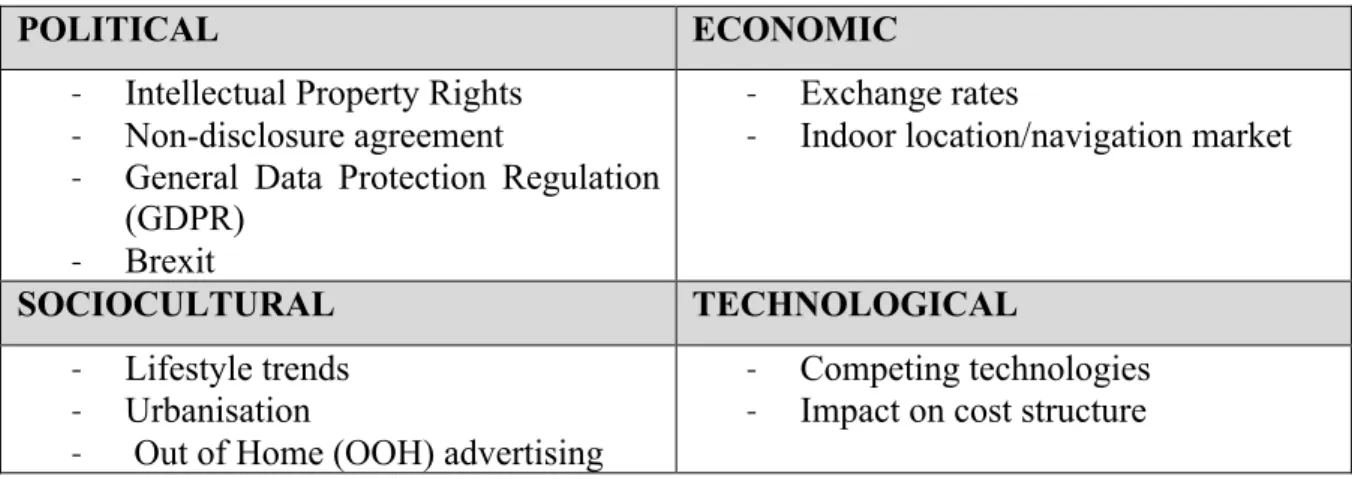
Table 2 - Living Map PEST analysis ... 33
Table 3 - Performance Indicators - Sprint A ... 61
Table 4 - Performance Indicators - Sprint B ... 62
Table 5 - Performance Indicators - Sprint C ... 64
Table 6 - Performance Indicators - Sprint I ... 65
Table 7 - Performance Indicators - Sprint II ... 66
Table 8 - Performance Indicators - Sprint III ... 67
Table 9 - Performance Indicators – Sprint IV ... 69
Table 10 - Performance Indicators – Sprint V ... 71
S
YMBOLS AND
A
CRONYMS
Symbol Description
CTO Chief Technology Officer
COO Chief Operation Officer
DEV TA TA
Development
GDPR General Data Protection Regulation
GIS PO
Geographic Information System
GPS Geographic Positioning System
IoT Internet of Things
IPS Information Position System
LM Living Map
OOH Out of Home
PO Product Owner
ROI Return on Investment
SAAS Software As A Service
SDK Software Development Kit
SM Scrum Master
TA Technical Architect
UCD User Centred Design
1. I
NTRODUCTION
The introduction is structured in five parts. Firstly, a brief background of the study will be presented, followed by the company’s description. In part three the objectives and motivation for the research are presented, and in part four there is an explanation of the research methodology adopted. Finally, in part five the structure of the document is shown.
1.1 Background
The business world operates in a global, chaotic and rapidly changing environment. In order to succeed in such a competitive market, companies need to be able to quickly respond to new opportunities, changing situations and emerging new products and new services (Sommerville et al., 2011).
It is crucial for organizations to practice better project management. Organizations should have a good knowledge about project management practices, and which ones are best fit to their sector of activity. A study about project management practices in private organizations refers that the 10 most used practices for the information and communication sector are: kick-off meeting; progress meetings; Gantt chart; activity list; baseline plan; progress report; change request; client acceptance form; project scope statement and requirements analysis (Tereso, Ribeiro, Fernandes, Loureiro, & Ferreira, 2018).
To embrace this hectic environment, software development practitioners attempt to keep up to speed to their surrounding with processes that not only respond to change but also embrace it as a market advantage (Cohen, Lindvall, & Costa, 2003).
Software is a component of basically everything we use. The high demand for newer and faster products makes the software development business very competitive. To be able to compete in this volatile market, rapid development and delivery are two crucial must-haves. Besides being fast, the business must not put aside the quality of the product.
Agile methods are born as a solution for software development needs by being incremental development methods. In Agile, customer releases are made in short iterations, with small increments. The customer is involved through the process in order to get constant and rapid feedback on requirements. Documentation is minimized by the use of informal communication (Sommerville et al., 2011).
Between 1980 and 1990 there was a common belief that the best way to achieve better software was through careful planning, documenting, inspecting and testing. This view came from developing software systems that were very big and had a long-life period. Such methods, with heavyweight, plan-driven development approach made sense because of all the variables in the game. Teams that were very big, dispersed geographically and most times were not allocated in the same company, but still, had to be coordinated.
Traditional methods began with a complete and exhaustive analysis of user requirements. After a long time of interaction with users, engineers would create a detailed list of features and requirements. This information had to be very well documented, so engineers could create the optimal architecture for the system, and then finally implement the design, test it and ship it (Beck, 1999).
However, these traditional methods did not apply to small and medium-sized business and were creating a general dissatisfaction within the business. The industry and technology moved too fast, requirements were changing at rates that did not allow traditional methods to keep up and clients did not know what they wanted in advance, having only a general idea of what their objective was.
Due to the market uncertainty, the use of traditional methods was frustrating to developers. A usual case was that developers would spend a year planning, documenting and studying the market and suddenly would have to change, based on new requirements or new product's launching. The Waterfall model was supposed to fix this problem by freezing requirements and not allowing any change. By doing this, the project completion could be a success, but the project scope and the client satisfaction could be a failure. This happened because there was no time to deal with feedback or a change in the requirements. Based on these needs, the Agile Manifesto was created in 2001. From there, a variety of Agile Methodologies was created.
1.2 Living Map
Living Map was founded in 2010 by Tim Fendley, as a sister company of Applied Wayfinding, that focuses in urban design, in order to serve as a research and development department. Right now it is a digital mapping and data platform that provides visual solutions to companies. Living Map technology can deliver a range of geographic-based digital solutions working from indoor and outdoor mapping and navigation, delivered on digital formats - signs, screens, websites, and mobiles or embedded into existing systems or apps.
It’s a small company, based in the United Kingdom, with a team composed of thirty-four specialists, experts across environmental graphic design, cartography, typography, product design, urban planning, project management, and implementation.
In order to better deliver projects and respond to customer needs, Living Map has implemented Scrum to their development teams.
1.3 Objectives and Motivation for the Research
Being Agile is a very trendy business word. Even though an increasing number of companies claim to be Agile, not many understand what that concept implies.
Living Map adopted Scrum, one of the most know agile frameworks, not only for their Software Development Team but also for their Geographic Information System (GIS) Team and for their Design Team. When the researcher joined Living Map as a business analyst, to help the current Scrum Master organize work, gather requirements and sort dependencies between teams, the teams had been doing Scrum for nine months and were still learning how to integrate the process with their reality.
After a month of joining the company, the Scrum Master at the time was promoted to Chief Technology Officer (CTO), and due to budget constraints, the new Scrum Master (SM) appointed was also the Technical Architect (TA).
After this change in job roles, some Scrum practices were still being followed but many others were being overlooked, which broke the process and created general discontent on the team and management level, leading to the leave of the Scrum Master/Technical Architect.
Together with the Management Team and the Development Team, it was proposed that the researcher would assume the role of Scrum Master, re-implement the process and evaluate the benefits that came with it.
1.4 Research Methodology
The methodology adopted for this dissertation was Action Research. This type of approach is known for being participative, taken by individuals that have the same purpose and context specific. The main goal of action research is to find ways to improve how something works, creating knowledge (Serie, 2010).
In order to know if a suggestion is actually working, Action Research can be used. This fits with the Agile view. If you need to test something, and you might fail, it's better to fail fast and fail with a full understanding.
There are five phases to Action Research - identify a question, action planning, implement a solution, determine if it works, and specify learnings - and this aligns with the Scrum and its Sprints.
In phase 1, the researcher states the aim and purpose of the research. This is done by adopting an outsider point of view. Later, the researcher will have a role in the research. Next, there is the action planning, phase 2, where the overall plan is drawn. These improvements or solutions can be created from scratch, but they can also be from existing ones.
In phase 3, the solutions planned in phase 2 are taken into action within a certain time frame, and the data originated in phase III is gathered in the next phase (phase 4), analyzed and compared to the initial data to understand the changes that occurred. In the last phase (phase 5), the new knowledge acquired is presented. An action research methodology can have various cycles where the phases are repeated.
For this research, the process was as it follows. In the beginning, the question was chosen: "Will Scrum re-implementation improve performance within the development Teams?". The second phase was to implement the right practices of the Scrum framework - this knowledge already existed, although it was adapted to fit the company and the team needs - during five iterations. In each iteration, feedback was taken from Retrospective, data was analysed, and when needed, actions were refined and taken into the next iteration.
After the five iterations, all data was gathered, and compared to the last three iterations prior to the solution was implemented. In the end, the conclusions were presented.
1.5 Structure
This document is structured in sixth parts. The first chapter is the introduction to the theme, where topics like the objectives, motivation and the research methodology are mentioned. In the second chapter, there is the Literature Review, where the knowledge about traditional methodologies and the agile methodologies is shown. In this chapter the focus is Scrum, an Agile framework.
In the third chapter, the case studied (Living Map) is presented including a SWOT and PEST analysis, a competitor’s analysis, the organisational structure, the working areas, the process of creating a map and the JIRA software used.
The next chapter (fourth) identifies the problem that this research aims to improve, and the solutions implementation are presented.
The fifth chapter gathers all the data collected from the results, and on the last chapter a conclusion is drawn.
2. L
ITERATURE
R
EVIEW
This chapter’s aim is to show the knowledge about the theme and to report on the existing literature on the theme.
This chapter is divided into two different types of methodologies of project management. Firstly, there will be a focus in traditional methodologies and some of the most relevant frameworks – Waterfall and the Spiral model.
The second part of this chapter focuses on Agile methodologies, and the relevant models – Extreme Programming, Kanban and Lean Development, and finally Scrum.
Since the research talks about the implementation of Scrum, this framework has a bigger emphasis in the chapter, focusing on topics like – Scrum Roles, Scrum Ceremonies, Scrum Artifacts and estimation.
2.1 Traditional Methodologies
In traditional methodologies, there are several steps one must take. The process starts with the documentation of requirements, studying and analysing a solution, developing, and testing. The requirements have to be well defined and fixed at the beginning of the development process, making the process frustrating to many developers due to the highly changing market that software development fits in (Awad, 2005).
Traditional methods create a disciplined process in order to make the software development process predictable and efficient, having the following characteristics:
• Predictive approach, where the work is first planned in high detail. A large amount of time is spent on drawing the system, understanding the requirements and coming up with a solution that fixes it efficiently. These drawings specify how the product should be built, the schedule it should follow and the resources that should be used;
• Comprehensive documentation, where all the client requirements are collected before the coding starts;
• Process oriented, since the goal of the traditional methodologies is to define a process that can be repeated and that works well;
• Tool oriented.
There are a few traditional methodologies such as the Spiral model, the V model and the Waterfall model.
2.1.1 Waterfall
The Waterfall model is a sequential software development process that involves five phases - analysis, design, implementation, testing, and maintenance. The progress is seen flowing downwards like a waterfall through all the listed phases. The phases must be executed by that order to achieve success in building software, meaning that one phase is dependent on the completion of the phase preceding it (Awad, 2005).
The stages description is as follows, and shown in Figure 1 (Bassil, 2012):
• Analysis, where a complete and comprehensive document describing how the software should behave is created. It has an analysis, both on the business and on the system, in order to fully identify the functional and non-functional requirements that the client expects. This document includes the objective of the project, the scope, the perspective, functions, attributes, user tasks, specifications, interface, and database requirements;
• Design, the software developers and designers work together to achieve the software solutions. Here are included tasks like algorithm design, software architecture, database schema, and user interface definition;
• Implementation, where the developer takes de requirement document and turns it into an executable product. This is when the code is written;
• Testing or verification and validation is the stage where the solution is checked to see if requirements and specifications were kept and that the solution meets its purpose;
• Maintenance, where the solution is modified after the delivery to refine the product, correct errors or improve general performance and quality.
Figure 1 - Waterfall Framework
(Murugaiyan, 2012)
When using the Waterfall model, all the requirements are clear before the development phase starts. If the client wants to change a requirement, the change will not be implemented in the development phase. This may result in project success but in client dissatisfaction. Each phase is completed in a specified period of time, and only after that phase is completed, it moves to the next phase. This means that if a phase gets delayed, all the project gets pushed back. The Waterfall model is very easy to implement and it requires minimal resources to be implemented (Murugaiyan, 2012).
2.1.2 Spiral Model
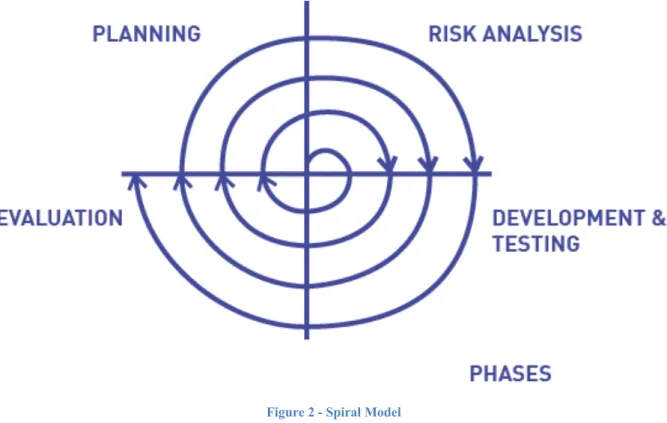
The spiral model is a traditional methodology that like the waterfall model is composed of phases - Planning, Risk Analysis, Engineering, and Evaluation. The software project continually passes through this stages in iterations (the Spirals) (Awad, 2005).
• Planning is where the objectives are identified and agreed upon;
• Risk Analysis where the risks are identified, analysed and information for risk mitigation is gathered;
• Engineering, where the software is produced;
• Evaluation allows clients to evaluate the output of the project to date before the project continues to the next spiral.
Figure 2 - Spiral Model
(Boehm, 1988)
The model shown in Figure 2, has the base concept that each cycle involves the same stages sequence, for each increment on the shippable product and for each of its level of production. Each spiral starts with the identification of the objectives of the increment that will be produced, the different ways to implement the product and the constraints imposed on the application of alternatives. Following this, there is the stage where the alternatives are going to be evaluated. Here, the areas that are uncertain and might cause a risk for the product development are identified. If these risks are identified, there will be an analysis of cost-effective strategies to mitigate the risks.
After identifying the risks, there will be phasing to implement and develop the software. Each level of software specification is followed by a test and validation phase.
Each cycle of the spiral is basically a review involving those interested in the product development. This review covers every product produced in previous spirals (Boehm, 1988). This model has some advantages like how a high amount of time allocated in risk analysis and that the software is produced early in the cycle, but it is a costly model to use since it requires very specific expertise and where the success of the project is mostly dependant on the risk analysis phase. The Spiral model is a good model for large and mission-critical projects but does not fit well in smaller projects.
2.2 Agile Methodologies
The Agile movement officially started in 2001, when seventeen software developers got together and identified what needed to be changed in the software development process. Their intention was not to create a unique way to work, but to establish their common ground with a set of values and principles. By the end of this gathering, the Agile Manifesto was created. In the manifesto, the participants underlined four common values (Fowler & Highsmith, 2001). They moved the focus from the process and the tools to the team relationships, work environment, and spirit. The individuals and the interactions overruled the processes and tools. The human role was the focus.
The main goal of the team was to deliver in a steady and frequent pace, software that worked. The code should be simple, clean and as advanced as possible in order to diminish the documentation and the paperwork. The working software should win over the comprehensive documentation.
The relation between the customer and the developers was more important than the contracts. It focused on delivering immediate business value as the project starts, reducing the risks of not fulfilling the contract.
The team that develops the software and the customer's representatives have to be well-informed and have the knowledge to consider and implement possible changes during the life-cycle of the project. The contracts are written in order to allow these enhancements. Responding to change has a greater focus than following a plan.
Described in the Agile Manifesto, there were 12 principles that developers should have in mind (Fowler & Highsmith, 2001):
• The highest priority is to satisfy the customer through early and continuous delivery of valuable software;
• Welcome changing requirements, even late in development. Agile processes harness change for the customer's competitive advantage;
• Deliver working software frequently, from a couple of weeks to a couple of months, with a preference to the shorter timescale;
• Business people and developers must work together daily throughout the project;
• Build projects around motivated individuals. Give them the environment and support they need and trust them to get the job done;
• The most efficient and effective method of conveying information to and within a development team is face-to-face conversation;
• Working software is the primary measure of progress;
• Agile processes promote sustainable development. The sponsors, developers, and users should be able to maintain a constant pace indefinitely;
• Continuous attention to technical excellence and good design enhances agility; • Simplicity – the art of maximizing the amount of work not done – is essential; • The best architectures, requirements, and designs emerge from self-organizing
teams;
• At regular intervals, the team reflects on how to become more effective, then tunes and adjusts its behaviour accordingly.
When compared to traditional methods, Agile brings a number of development techniques that add business value (Kelly, 2012):
• Enhanced responsiveness to the business and market needs – Agile methods are built around the premise that change in requirements should be embraced instead of ignored;
• Increased Return On Investment (ROI) because working software is deliverable and ready to be used earlier in the development cycle;
• Reduced risk – since Agile has frequent deliveries of software, the amount of feedback and interaction with the customer rises. By having more feedback, the Team can accommodate changes earlier in the development process, tackling the risk sooner with lower cost;
• Improved quality;
• Better project governance because the progress of projects is more transparent. By using the Agile “Toolkit”, and having daily meetings, visible and accessible work, everyone understands what is being done and where the process is at. From the Agile Manifesto a variety of Agile Methodologies were born such as Scrum, Extreme Programming, Lean Development Software and Kanban that will be discussed next.
2.2.1 Extreme Programming
Extreme programming was introduced by Beck in 1998 and is one of the most known and used Agile methods. It was named as it was because the approach pushes recognized good practices to an extreme level.
There are twelve rules on Extreme Programming and all of them are really precise (Beck, 1999). • The planning game – the customers decide the scope and the timing of the
releases. This is based on estimates provided by the developers;
• Small releases – the first version of the system is put into production only after a few iterations and new releases are made often;
• Metaphor – both customers and programmers decide on the shape of the system; • Simple design – only the necessary design is done so the system can communicate what the programmers intend to communicate with no duplicate code;
• Tests – developers write the acceptance tests before writing the code and customers write functional tests. At the end of each iteration, all of them should run;
• Refactoring – every time a developer finds an improvement that should be made into the code, he should do it immediately. This keeps the code simple and maintainable;
• Pair programming – every code is written by two people at one screen;
• Continuous integration – the new code is deployed to the current system after a few hours;
• Collective ownership – every developer can improve any code anywhere if they see the opportunity because the code is owned by the whole team;
• On-site customer – a customer works with the team during the development process. He is on site to answer questions and to perform acceptance tests; • 40-hour weeks – developers should not have to do overtime;
• Open workspace – the workspace is large, and the developers work in small cubicles.
It is said that the strength of XP does not come from the twelve practices by itself, but all of them combined (Cohen et al., 2003). XP embraces agile practices with the following practices (Sommerville et al., 2011):
• Incremental development – there are small and frequent releases. The requirements are based on simple customer stories that are the base of the decision on what functionality should be included in a system shippable increment;
• Customer involvement – since the client is present during all the development process;
• People over process – are supported by pair programming, collective ownership and only work 40-hours;
• Change – is embraced by having small and regular releases to the customer, test-first development, refactoring and continuous integration;
• Simplicity – is supported by regular refactoring and using simple designs.
2.2.2 Kanban
Kanban originated in the late 1940s when Toyota started optimizing its engineering processes based on the model supermarkets were using. Kanban is the subsystem of Toyota Production System, which was created for inventory control.
Kanban levels inventory with actual consumption, just like in a supermarket. A consumer goes to the supermarket and only buys the exact quantity needed at the required time.
The Kanban system worked following these steps (Sugimori, Kusunoki, Cho, & Uchikawa, 1977):
• A form order called Kanban is used. The form order can be a conveyance Kanban, when going from one process to the next process, or a production Kanban, if it is used to order production of the portion used by the process. All the Kanban cards are attached to the containers;
• When the content of a container starts being used, conveyance Kanban is removed from the container and taken to a stock point to pick up this part. The conveyance Kanban is attached to the container holding this part;
• The production Kanban in the container is removed and become a piece of dispatching information.
The Kanban system was implemented instead of other computerised system in order to: • Reduce cost of processing information;
• Limit surplus capacity.
Kanban gradually eliminates the usage of iterations and sprints by continuous delivering high priority features instead of planning work to fit into a rigid time-boxed iteration.
Agile teams are able to leverage the just-in-time production by matching the amount of work in progress (WIP) to the team's capacity. By doing so, the teams have more flexible planning options and more transparent through the development cycle.
The teams work with a board - used to visualize work and optimize the flow of work within the team - in order to maximize collaboration and accessibility from multiple locations. The board main goal is to ensure the team's work is visible, their workflow is standardized and that all blockers are immediately resolved. A basic board has three columns (Figure 3) - To Do, In Progress and Done. Work is represented with a card on the Kanban board to allow team members to trace the card's workflow in a visual manner.
Figure 3 - Kanban Board
(COHN,2005)
There are five core practices to Kanban implementation (Raju & Krishnegowda, 2013): • Visualise the workflow - the Kanban screen allows teams to visualize the
workflow of the work increasing transparency. By using the screen, team members can see what others are working on and offer help before starting a new task. It's also an easier way to let teams organize themselves, by identifying bottlenecks and take steps to resolve the flow;
• Limit work in progress - Kanban does not limit the time that a task might take but enforces a limit on WIP;
• Measure and manage flow - the cycle time is the time from when the work begins until it is delivered. It’s a way of measuring the process capability;
• Make all process policies explicit - within the teams, they are certain policies on how a work should be done. These policies should be explicit in order to control the flow of the work and help team members establish their knowledge on what needs to be done;
• Improve continuously - Kanban encourages improvement on the process.
2.2.3 Lean Development
Bob Charette creates Lean Development after the success of Lean Manufacturing in 1980, with the belief that in order to be truly agile, a company must change the way it works from the top down (Cohen et al., 2003).
Lean Development has twelve principles that mainly focus on management strategies (Highsmith, 2002):
• The company highest priority is satisfying the customer. The Team must have practices defined to determine customer priority and others to listen to their responses. If customer expectation is not met, then the project is a failure; • Always provide the best value for the money. Software should be a solution to
a problem or a new opportunity at a reasonable cost. The main goal is value and not perfection;
• Customer must actively participate in the process in order for successful development;
• Every project is a team effort where the key to innovative, fast cycle deployment is multi-disciplinary teams rather than isolated individuals;
• Everything can change;
• Domain, not point, solutions – one-of-a-kind system is too expensive and cannot be used for other situations. In order to increase usability, the system should be applicable across multiple domains;
• Complete, do not construct;
• An 80 percent solution today instead of 100 percent solution tomorrow because markets change so rapidly;
• Minimalism is essential – waste should be eliminated by minimizing documentation, having small teams co-located and keeping the product scope focused;
• Needs determine technology;
• Product growth is feature growth, not size growth; • Never push Lean Development beyond its limits.
2.2.4 Scrum
Scrum is a framework within which people can address complex adaptive problems, while productively and creatively delivering products of the highest possible value (Schwaber & Sutherland, 2017).
This term was borrowed from Rugby. A Scrum happens when players for both teams huddle close together in an attempt to advance down the playing field. The term was used to explain the benefits of self-organizing teams in product development.
Scrum is one of the more widely used Agile Methods, alongside XP. In 1996, Ken Schwaber said that Scrum accepts that the development process is unpredictable. After inspecting the process, scientists concluded that rather than being repeatable, defined and predictable, most of the processes were unpredictable and unrepeatable. From this, the difference between a defined process - one that is predictable due to the fact that performs the same every time - and an empirical process - one that is chaotic and in constant need of measurement and control. Schwaber's framework is iterative and incremental. By using Scrum, companies are allowing for an interaction with the environment, leading to changes in project scope, technology, cost, and schedule (Schwaber, 1996).
Scrum is based on empiricism – where it is assumed that knowledge comes from experience and decisions are made and based on what it is known. It has three steady pillars – transparency, inspection and adaption.
• Transparency – every piece of work has to be clearly defined and every part involved on the project has to know about it.
• Inspection – every piece of work must be inspected with the necessary frequency to ensure the best quality.
• Adaption – it represents the capacity to adapt the project to the business needs. These three values come to life when all Scrum values are respected – commitment, courage, focus, openness and respect (Schwaber & Sutherland, 2017).
• Small teams that maximize communication, enable knowledge sharing and minimize overhead;
• Adaptability to the environment, in order to ensure that the best product is produced;
• Frequent builds and releases, that can be inspected, adjusted, tested and documented;
• Breaking work into small pieces;
• Constant testing and documentation of a product at the same time as it is built; • Ability to declare a product “done” whenever it is required.
Scrum assumes that the software development environment is too complex and unpredictable to be planned with a great deal of detail in advance. The solution is to apply empirical process control to ensure that the three pillars mentioned above are steady.
When talking about Scrum, one must mention it's roles, ceremonies, artifacts, and rules. The next sections will cover all of them.
Scrum Roles
There are three Scrum roles - Product Owner, the Team and the Scrum Master. Scrum teams have and say and choose how to best accomplish their work because they are the experts on the subject. Furthermore, every member of the team should have the knowledge required to accomplish the work without having to depend on other members.
These roles are the people committed to the project. Within the business, there are external and internal parts interested in the project, but Scrum makes a very strong distinction between them. The framework makes sure that the ones responsible for the success of a project have more authority to do what is required and those who are not responsible cannot interfere (Schwaber, 2001).
- Product Owner
The Product Owner (PO) is responsible for representing the interests of all the parts with a stake in the project as well as maximizing the value of the work. The PO gathers all the initial requirements from the clients and creates the Product Backlog, that will later be used to ensure that the most valuable functionality is prioritized and built first (Schwaber, 2009).
To correctly manage the Product Backlog, the PO has to: • Order items to best achieve goals and missions; • Optimize the value of the work the Team performs;
• Make sure that the product backlog is visible, transparent and clear; • Ensure that the Team understands what is needed.
It is very important that the organization respects the PO decisions since he uses the backlog to give the highest priority to requirements that are of highest value to the business, and constantly adjusts the product in response to changing business conditions.
The Product Owner voices what the customer asks for – his responsibility is to communicate the vision to the team, and this is why he needs to work with the team on a daily basis.
- Scrum Master
The Scrum Master is the protector of the team and the process. He is the primary interface between the Product Owner and the Team. He has to make sure every member of the Team understands the framework and respects the agile values.
One of the most important responsibilities of the Scrum Master is making sure the development team can work without distractions, that can be internal (e.g. the Chief Executive Officer wanting a new piece of work done) or external (e.g. noisy background).
- Team
The Team is responsible for developing the features. They are characterized for being self-managing, self-organizing and cross-functional. The Team members are not only responsible for the success of each iteration but also for the project as a whole.
The Team can be formed by two until seven members. All of they are responsible to deliver the product. The Team comes up with the estimates, decide the user stories they accept to implement for the current sprint according to the priorities defined by the PO and report daily to each other. The Team is responsible for the "how" while the PO is responsible the "what". Teams characteristics are the following (Schwaber & Sutherland, 2017):
• Self-organizing; • Cross Functional;
• There are no titles for Team members, regardless if a work is done by a person; • There are no sub-teams in the Development Team;
• Individual members may be specialized in certain skills, but in the end, the accountability belongs to the Development Team as a whole.
The optimal size should be small enough to be adaptable but also large enough to complete the work within the Sprint. Small teams can encounter constraints, causing the Development Team
to be unable to deliver on time. Large teams create complexity that gets on the way of the process.
Scrum Ceremonies
Scrum has four main ceremonies during an iteration that are used to establish regularity. All of them are time-boxed, being that all of they have a maximum duration. Iterations in Scrum are called Sprints - these are also fixed and should not be shortened or carried over.
Sprints duration may change and be adapted depending on the project, but the length should always stick between two to four weeks. The duration of the Sprint is short in order to maximize the collaboration between the Team and the Client. Having small iterations allows having more frequent feedback, minimizing risk and maximizing success. The Sprint duration should never be extended. In case of un-finished work on Sprint completion, the Team and the Product Owner decide if the work rolls-over to the next sprint or is no longer relevant and should be dropped.
At the Sprint end, the Team should have produced a shippable feature that brings value to the business.
During a Sprint, some rules must be followed, being the most important ones the Sprint Goal and the Team Composition. Scrum creates a safe environment where a Team can have predictable and fixed goals for a certain period of time. By changing the Sprint Goal, uncertainty is being introduced in the iteration, maximizing risk.
Within a Sprint, there are four ceremonies: Sprint Planning, Sprint Review, Sprint Retrospective, and Scrum Daily Meetings. Every Sprint has one meeting of each, with the exception of Daily Meetings that are held daily.
- Sprint Planning
Every Sprint starts with a ceremony called Sprint Planning. Just as the name states, is within this meeting that the Team, alongside the Product Owner and the Scrum Master, plan the next iteration.
The Scrum Master is the owner of this meeting, but the Team is the one deciding on the amount of work that they will commit to deliver. The Team compromises with the Product Owner on taking the most relevant work and completing it by the end of the iteration.
In this meeting, the presence of the Product Owner is of extreme importance since he is the one that is aware of the business priorities and has ownership over the Product Backlog. The Product Owner presents the features he would like to see developed and the Team divides the feature
into small pieces (tickets) and estimates the amount of work they will take. This estimation can be made using story points or ideal days.
When discussing a ticket, the Team should define the "Acceptance Criteria" to determine what marks the completion of the task. Having a set of criteria that the feature must reproduce/have is the best way to ensure work is completed with quality.
In order to keep the Team focused, this meeting should only take four hours (when the Sprint has two weeks) being that the duration can increase or decrease depending on the Sprint length. By the end of Sprint Planning, the tickets selected and estimated are the Sprint Backlog, and this artifact is what the Team will focus on the next weeks.
Planning is crucial in the process of software development. Even though plans allow us to know critical information - "Who should be available to work on the project?", "Do we need more resources?", "Is this achievable?", "Is the project on track?" - planning is very difficult.
Planning is an attempt to find the solutions that optimize the product development. The team considers the features, the resources and the schedule they have. A good planning process will reduce risk and uncertainty, support better decision making and establish trust (Cohn, 2005).
- Scrum Daily Meeting
The Daily Scrum is a ceremony that occurs daily, always at the same place and hour, and should never be more than fifteen minutes. By keeping it short, the habit of having a quick meeting that does not affect the daily task is created, allowing for every member to understand the status of completion of the sprint.
During this ceremony, each team member answers to three simple questions. 1. What did I do yesterday to help with Sprint completion? 2. What will I do today to help with Sprint completion?
3. Is there anything blocking me from achieving Sprint completion?
The Daily Scrum is owned by the Scrum Master and it helps him understand how the Sprint is going and the velocity of the team. It is also a great way for the Team to be involved in everything that is going on and offering help in case of need.
- Sprint Review
The Sprint Review is held on the end of the Sprint. It is a place where the team can show the work done during the Sprint and get feedback from the Product Owner and from the shareholders.
The Sprint Review is an informal meeting, and the presentation of the deliverables is made with the purpose of creating feedback and enhancing collaboration. In this meeting various topics can be discussed, from future work that can be done, to bugs found that need to be fixed, and solutions to the implementation of new features.
The Scrum Master is the one making sure that this meeting is held and that the time box is respected.
- Sprint Retrospective
As the Sprint Review is for the product, Sprint Retrospective is for the process. In this meeting, the Team has the chance to inspect itself and suggest improvements for next Sprint.
The Scrum Master makes sure this meeting takes place and that it is productive. As it is stated on the Scrum Guide, the Sprint Retrospective has the following purposes (Schwaber & Sutherland, 2017):
• Annalise how the last Sprint went regarding people, relationships, process, and tools;
• Identify and order the major items that went well and what can be improved; • Create a plan for implementing improvements.
Scrum Artifacts
Scrum's artifacts are designed to maximize transparency on the communication of information so that everyone has the same understanding. An artifact is any metric that is able to show the progression of the product development.
- Product Backlog
The product backlog is a prioritized list of all the features needed in the product. This list has to be always available and ordered for the Team and the Stakeholders to use. This artifact is owned by the Product Owner that with the help of the Scrum Master keep it up to date. The product backlog has all the features, functions, requirements and bugs needed for future releases.
The product backlog is never complete, and it is in constant transformation. It evolves with the product and the environment it is surrounded by. The product backlog can be changed and re-prioritized at any moment because of its dynamic structure.
The Product Owner is responsible to collect all the requirements and features the client wants to have in his product. He takes the requirements and creates a list of features that need to be
developed, but since the PO is not a developer, he lacks the technical knowledge to turn the feature in actual work. Due to this, a backlog refinement is needed.
The process of backlog refinement is one to add details, estimate and break down features into user stories. A user story is a functionality that will be useful to the user and answers to three questions: who, what and why.
The user story goes through refinement in order to be polished and has all the necessary information, so any member of the team can just work on it. The Team is responsible to refine the user story and to estimate it.
Higher features in the product backlog mean that they are more important, are clearer and have more detail than the features on the bottom.
- Sprint Backlog
In Sprint Planning, the Team and the Product Owner go through a prioritized product backlog and decide on the piece of work that they can work on. At the end of sprint planning, the Team has a list of User Stories that they compromised to complete, called a sprint backlog.
The sprint backlog is owned by the Team, it is highly visible and should be a real-time picture of the work that the Team plans to accomplish during the Sprint.
- Velocity
The velocity is a measure of a Team's rate of progress. It is the sum of all story points that were completed in a Sprint. If a Team completes four user stories estimated with one, two, three and five-story points, their velocity is eleven.
If a product has all features listed in a Product Backlog and the Team estimates those features, the sum of the estimation is the size of the project. By using the Team's velocity, and by dividing the size by velocity we can reach a number of iterations necessary to deliver the product. The velocity of a Team is based on historical data. By gathering the number of story points completed in each Sprint, we can reach the Team's velocity in the first few Sprints.
- Burn-down Chart
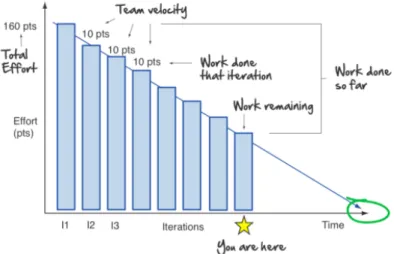
The burn-down chart is used to track the progress of the Sprint by plotting the number of days that are still remaining of the Iteration against the number of story points or ideal days still remaining (Agarwal & Majumdar, 2012).
Figure 4 - Burn-Down Chart
(Rasmusson, 2019)
Burn-down chart is a two-dimensional way to show work remaining over time Figure 4. The y-axis represents the days left on a sprint. During the Sprint, every time work gets moved into Done, the graph goes down, until, ideally it reaches zero (Sutton, 2018).
Through one chart we can see the total effort, the team’s velocity, the work done each iteration and the work that is still remaining.
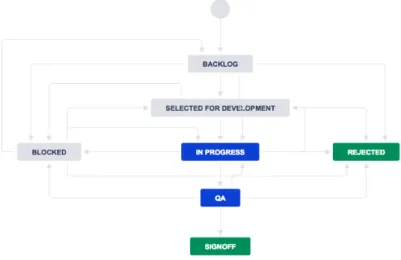
Scrum Flow
A Scrum project starts with a vision of the system to be developed. This vision can be from an external source like a client, or from an internal source.
Figure 5 - Scrum Flow
In Figure 5 we can see the different phases of the process. Firstly, the Product Owner proceeds to understand the vision and transforms it into a list of requirements this product must have. This list of features is the Product Backlog and the Product Owner is responsible for it. This backlog, when turned into functionality will reflect the vision of the product.
The product backlog is prioritized so that the items that are more urgent to create value are a top priority, whilst others are a lower priority. Changes in the Product Backlog reflect changing business requirements and also how quickly the team can deliver the specific feature.
All work is done in Sprints. Before the beginning of each Sprint, the Product Owner holds a meeting with the Team and the Scrum Master called Sprint Planning. In this meeting, the list of features desired is presented to the team and the concept of the project is explained. It should be noted how important it is for the Team to have a broad understanding of the project, in order to be able to create a product with quality and minimize technical debt for future works. After being presented with the prioritized Product Backlog, the Team discusses and makes a commitment with the Product Owner of delivering the next most important thing at the end of the Sprint.
In order to commit to a certain amount of work, the Team also discusses their capacity based on data from last Sprints (velocity, points delivered, person days) and based on the uncertainty and availability the Team Members will have for the next weeks. The Team is responsible for managing its own work. After Sprint Planning, the Sprint immediately starts, and the Team must do whatever is necessary to achieve Sprint Goal.
During the Sprint, the Team and the Scrum Master have Scrum Daily Meetings that last for fifteen minutes where each Team member answers three questions - "What did you do yesterday to help with Sprint completion?"; "What will you do today to help with Sprint completion"; "Is there anything blocking you from achieving Sprint Completion?" - to summarize the progress of the work.
At the end of the Sprint, the Team meets with the Product Owner, the Scrum Master, and the stakeholders to show what was developed during the Sprint. This is a way to let stakeholders understand the progress of the development process and to give feedback on the product being developed.
After Sprint Review and prior to Sprint Planning, the Scrum Master holds a Sprint Retrospective with the Team - the PO might also join this meeting when allowed by the Team - where the Team revises the Scrum framework and practices. In here, the Team talks about what went well, what went wrong and what can be changed in the future.
Scrum estimating
Estimating in Agile differentiates size and duration, and both are estimated using different metrics - story points or ideal time.
It is important to understand that an estimate is a guess. The more time spent talking about a certain user story or on refining tickets to meet the definition of ready, the more accurate the estimation will be.
- Story points
Story points are relative and represent effort, not time. They are a measurement unit for expressing the overall size of a user story, feature or piece of work that needs to be done. Based on a study of 443 unique results, story points were perceived to be the most used form of estimation (Usman, Mendes, Weidt, & Britto, 2014).
In story points estimations, a raw value is assigned to a certain piece of work. In the end, the raw value by itself is not really important but rather the relative values. A piece of work that is assigned with the value two is twice as much effort as a piece of work with one story point. The estimation takes into account the amount of effort involved in developing, the complexity of the implementation, the risk and also the dependencies a piece of work might have (Cohn, 2005).
In story points estimation, Teams use the Fibonacci sequence, in order to achieve more accurate estimations. The Fibonacci sequence is a series of numbers where a number is found by the sum of the numbers before it, starting by 0 and carrying on with 1,2,3,5,8,13 …
In the Fibonacci sequence, the gaps in the sequence become larger and larger as the numbers increase. This is helpful for estimating because as uncertainty on a user story increases, so does the inaccuracy of the estimation.
A user story should be broken into small tickets that can be refined and detailed enough to have small story points, in this way accuracy estimating increases and so does the predictability on the Team's velocity.
Agile teams are cross-functional meaning that they include all members required to build a product. When estimating in story points, teams learn how to better work cross-functionally, because they are to reach a single number to represent the whole team.
- Ideal days
On a software project the concept of ideal time - the planned time something should take - is different from elapsed time - the actual time something took - because of the overhead experienced every day.
In a working day is almost impossible to only do a certain task without being interrupted. Adding to the planned work one might answer to emails, making calls, interviewing candidates and be in meetings.
When estimating using ideal days, the Team assumes that the story being estimated is the only thing that a member will work on, that every single information needed is already provided and that there will be no distractions.
Estimating on ideal days is still a size estimation, although being less accurate than story points (Cohn, 2005).
- Planning Poker
In planning poker, the Team members are given a deck of cards that has written on it a validate estimate.
The moderator that can be the Product Owner, an Analyst or any team member, reads the user story or the details on a ticket that needs to be done. The Team asks questions, gathers all information necessary. After all, questions are answered, each Team member secretly chooses a card that reflects their estimation on it. The cards are only shown when every member has decided and picked one. After so, all cards are simultaneously turned over and shown so that everyone is aware of the estimation.
It is normal for estimations to be different. If that is the case, the Team member with the highest and the lowest estimation explain what their train of thought was and what made them choose that value. This discussion is important because it helps the team oversee some difficulties that they may have not thought about or simplify work that seemed to demand high effort.
The group proceeds to discuss their estimations for a couple of minutes, and after that proceeds to re-estimate based on the new information obtained. The process is identical to the one in the beginning. In most cases, estimates will converge in the second round but if so does not happen, the process is repeated until the Team reaches an agreement. The unanimous agreement is not always possible, so in the case of having a higher number of identical estimations over a lower number of different ones, the moderator asks if they are happy to go to the most common estimation (Cohn, 2005).
Planning poker brings together multiple expert opinions that form a cross-functional team. Team members need to be able to justify their estimation, improving accuracy and helping complete some information that might not have been thought about.
3. C
ASE STUDIED
:
L
IVING MAP
For the case study, there will be a full description of the company where this research was held and the use cases that are worked on the company. Following that, there is a SWOT, a PEST and a competitor analysis.
In order to better understand the company’s structure, it is presented an organisational diagram and a brief explanation of the three different areas within the company - User Centred Design, Geographic Information System and Software Development. The interaction between these three areas and the map creation is detailed after, as well as the structure used in JIRA and their workflow within the company’s system.
3.1 Living Map
Living Map is a SaaS (Software as a Service) solution that provides an integrated product for map management and delivery to consumers. This is achieved through browser-based digital maps as well as with native mobile app components.
Living Map is currently developing its own unique indoor positioning technology, to provide accurate location and navigation services in any environment. The positioning system that is being developed will eventually provide to third-party integrators as a Software Development Kit (SDK), uses sensor fusion technology and combines a variety of datasets taken from the device as well as external inputs such as Wi-Fi scanning, magnetic data, and a pedestrian dead reckoning algorithm.
Living Map bridges the information gap between people and places, creating better user experiences and increased operational efficiency. Maps are the perfect interface for understanding any environment, and digital map technology has emerged as the essential enabler of multiple consumer and business applications, from navigating cities to visualizing live asset data generated by the Internet of Things sensors.
Living Map works with many different use cases:
Cities: a city can be a challenging environment to navigate for both residents and visitors, who need a tool to support them during their journey and provide them an overview of what the destination has to offer. One of the latest trend spreading globally is about Smart Cities, meaning those places that use innovative technology to enhance the quality of life for the people.
Heritage: museums and art galleries do not usually have recurrent customers, so every day they are presented with the challenge of helping new people navigate their environment. Wayfinding around multiple rooms or buildings, and artworks location can be difficult for visitors, to provide people with the information they need to locate a specific asset and navigate there would save the venue a lot of time and efforts.
Venues: venues such as shopping centres, arenas, and stadiums are trying to meet user's needs by transforming their digital experience, and assuring them recommended accessibility standards, improving the customer service and make events more appealing. A seamless experience is becoming essential for customers, when either they're trying to find their seat, a specific retailer, or simply understanding food and drinks offer at the venue.
Transport: digital transformation is an essential strategy for any company operating in today's travel industry. Train stations, bus station, airport, and multimodal stations have recently been showing higher attention to customer service, passenger experience, and digital environment. Travelers are adapting to change to the new digital environment surrounding them, and this reflects also in their habits.
Healthcare: healthcare organizations make use of Internet of Things (IoT) technologies to improve their workflow and patient experience by trying to meet new patients’ demands, to capture and analyse data. A significant fraction of missed hospital appointments is due to navigation problems and hospital staff think that wayfinding apps could increase their efficiency, as they will not be required to act as tour guides to hospital visitors. The practice of medicine is being reinvented, and hospital navigation and asset management are part of it. DOOH: digital out-of-home advertising is that kind of advertising that reaches consumers while they’re outside of their homes. Dynamic media located in specific areas of a public space are not only a valid marketing opportunity for companies, but also an opportunity for cities or venues to share information with people. To make people look at those screens, kiosks and interactive media, they should contain interesting and attractive content that may be useful to them.
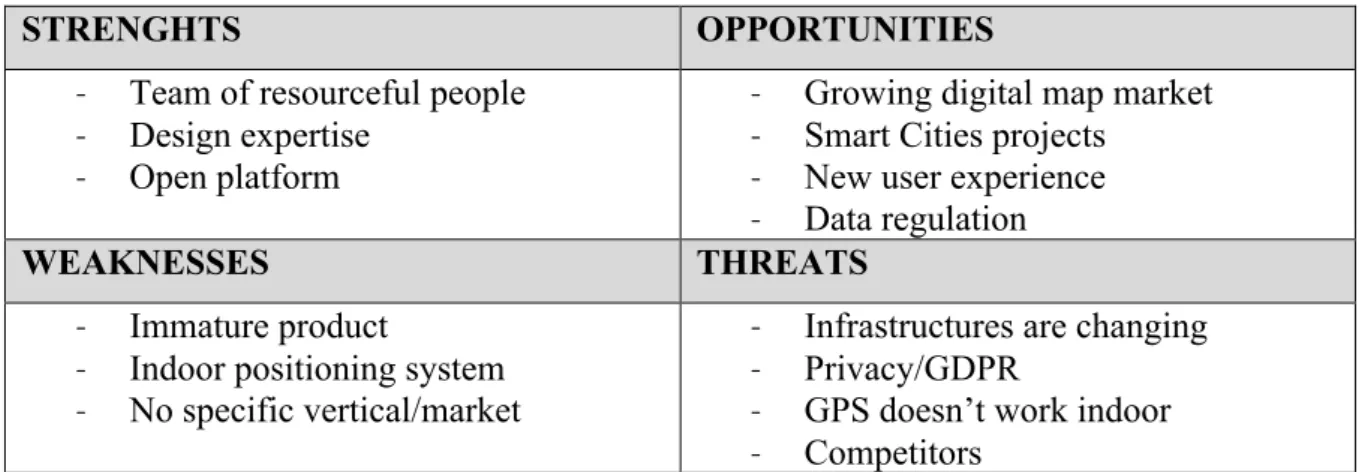
3.2 SWOT analysis
Table 1 - Living Map SWOT analysis
STRENGHTS OPPORTUNITIES
- Team of resourceful people - Design expertise
- Open platform
- Growing digital map market - Smart Cities projects
- New user experience - Data regulation
WEAKNESSES THREATS
- Immature product
- Indoor positioning system - No specific vertical/market
- Infrastructures are changing - Privacy/GDPR
- GPS doesn’t work indoor - Competitors
Living Map is a team of young and resourceful people, ready to work to meet client's needs and to provide them with the best solution possible. A unique blend of geospatial experts, cartographers, engineers, and designers combine to transform the way people experience the cities, buildings, and businesses around them.
Living Map is led by a team with rich experience in urban design and smart city technology. Understanding how people interact with a map and how they move in a complex place is an essential part of building a user-friendly design to ease people's experience.
Living Map is an open platform that can connect with third-party technology provider and IoT sensors, to create custom functionalities and retrieve real-time data for a more general and clearer overview of a site.
Despite the effort put in the company in 2017, the product is still immature and needs to be defined more clearly. Some of the features are now standard and can be delivered to every client, but there are some features that should have been developed by now, and still are not. Until those are ready, Living Map will not have a full and complete product to sell to clients, but it will be a project in development with them, over time.
Living Map Indoor Positioning System is still under development, and unfortunately, until it is ready, there will be something missing in the product offered to the clients. The ability for a user to see his accurate location reflected on the map is becoming essential to every service provided, so some effort needs to be put in the development of this technology, to be finally ready to meet customer's expectations in that field too.
Living Map still does not have a clear and specific target market. Living Map defines its target as every 'complex place' but the term is quite broad, so it needs to be refined to a smaller number of verticals to focus on.