L. Seabra Lopes et al. (Eds.): EPIA 2009, LNAI 5816, pp. 363–373, 2009. © Springer-Verlag Berlin Heidelberg 2009
Networks
Luís Cavique1, Armando B. Mendes2, and Jorge M.A. Santos3 1
University Aberta, R. Escola Politécnica 147, 1269-001 Lisboa, Portugal [email protected]
2 University of Azores, R. Mãe de Deus, 9501-801 Ponta Delgada, Portugal
3
University of Evora, Largo dos Colegiais 2, 7000 Evora, Portugal [email protected]
Abstract. In social network analysis, a clique is a relaxed clique, i.e., a
k-clique is a quasi-complete sub-graph. A k-k-clique in a graph is a sub-graph where the distance between any two vertices is no greater than k. The visualiza-tion of a small number of vertices can be easily performed in a graph. However, when the number of vertices and edges increases the visualization becomes in-comprehensible. In this paper, we propose a new graph mining approach based on k-cliques. The concept of relaxed clique is extended to the whole graph, to achieve a general view, by covering the network with k-cliques. The sequence of k-clique covers is presented, combining small world concepts with commu-nity structure components. Computational results and examples are presented.
Keywords: Data mining, graph mining, social networks.
1 Introduction
After the Tim Berners-Lee [2] communication in the International World Wide Web Conference WWW2006 about the three ages of the Web, there has been an explosion of interest in the social networks associated with Web 2.0 in an attempt to improve socializing and come up with a new model for knowledge management.
The term social network was coined by Barnes in 1954. However, the visualization using a graph, called sociogram, was presented by Moreno [18]. This scientific area of sociology tries to explain how diffusion of innovation works, why alliances and conflicts are generated in groups, how the leadership emerges and how the group structure affects the group efficacy.
A major development on the structure of social networks came from a remarkable experiment by the American psychologist Stanley Milgram [16]. Milgram’s experiment consisted in sending letters from people in Nebraska, in the Midwest, to de received in Boston, on the East Coast, where people were instructed to pass on the letters, by hand, to someone else they knew. The letters that reached the destination were passed by around six people. Milgram concluded that the experiment showed that, on average, Americans are no more than six steps away from each other. This experiment led to the concepts of the six degrees of separation and the notion of small-world.
An interesting example of a small-world is the “Erdos Number” [12]. Erdos is the most prolific mathematician, being author of more than 1500 papers with more than 500 co-authors. Erdos is the number zero and the researchers who worked with him are called Erdos number of 1. The co-authors of Erdos number of 1 are the Erdos number of 2, and so on, building one of the oldest small-world known. The work of Erdos and Renyi [8] presents interesting properties of random graphs. A brand new interest was revived with the Watts and Strogatz model, published in the Nature jour-nal [22], that studies graphs with small-world properties and power-law degree distri-bution.
The analysts of social networks need to survey each person about their friends, ask for their approval to publish the data and keep the trace of the population for years. On the other hand, the social networks like MySpace or LinkedIn provide the required data.
The visualization of a small number of vertices can be completely mapped. How-ever, when the number of vertices and edges increases the visualization becomes incomprehensible. The large amount of data extracted from the Internet is not com-patible with the complete drawing. There is a pressing need for new patterns recogni-tion tools and statistical methods to quantify large graphs and predict the behavior of network systems.
Graph mining can be defined as the science and the art of extracting useful knowl-edge like patterns and outliers provided respectively by repeated and sporadic data, from large graphs or complex networks [9], [6]. There are many differences between graphs; however, some patterns show up regularly and the main ones appear to be: the small worlds, the degree distribution and the connected components. The connected components have essentially been studied in two contexts: (a) the local neighbor-hoods, such as the clustering coefficient and (b) the node groups, such as the graph partitions and bipartite cores [6]. In this work the connected components are studied using the graph partition approach. The proposed Socratic query is the following: How many small world components (or k-cliques) are needed to cover (or to create partitions of) the whole graph?
In this paper, we propose new graph mining measures based on k-clique covering, to obtain a general view of the graph. In section 2 we review the social network con-cepts, detailing the cohesive subgroup structures. In section 3 we present the two-phase algorithm that looks first for cohesive subgroups and second to the minimum set of cohesive subgroups that cover all the vertices. In section 4 computational re-sults and examples are presented. Finally, in section 5 we draw some conclusions.
2 Network Concepts
Social Network Analysis is a very relevant technique, which has emerged in modern sociology and studies the interaction between individuals, organizations and other kinds of entities. See [19] and [21] for the theoretical basis and key techniques in social networks.
The representation of a social network was quite influenced by graph theory. In the social networks the set of vertices (or nodes) correspond to the “actors” (i.e. people, companies, social actors) and the set of edges corresponds to the “ties” (i.e. relation-ships, associations, links).
The sociologic applications of cohesive subgroups can include groups such as work groups, sport teams, political party, religious cults, or hidden structures like criminal gangs and terrorist cells. In this section we will detail some techniques for cohesive subgroups like the cliques and relaxed cliques, such as k-clique, k-club/k-clan and k-plex.
2.1 Clique
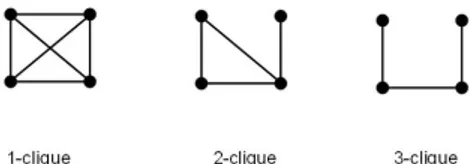
Given an undirected graph G= (V, E) where V denotes the set of vertices and E the set of edges, the graph G1= (V1, E1) is called a sub-graph of G if V1⊆V, E1⊆E and for every edge (vi, vj)∈ E1 the vertices vi,vj∈ V1. A sub-graph G1 is said to be complete if there is an edge for each pair of vertices. A complete sub-graph is also called a clique, see figure 1. A clique is maximal, if it is not contained in any other clique. The clique number of a graph is equal to the cardinality of the largest clique of G and it is obtained by solving the maximum clique NP-hard problem.
Fig. 1. Cliques with 1, 2, 3, 4, 5 and 6 vertices
The clique structure, where there must be an edge for each pair of vertices, shows many restrictions in real life modeling. So, alternative approaches were suggested in order to relax the clique concept, such as k-clique, k-clan/k-club and k-plex.
2.2 k-Clique
Luce [15] introduced the distance base model called k-clique, where k is the maxi-mum path length between each pair of vertices. A k-clique is a subset of vertices C such that, for every i, j∈ C, the distance d(i, j)≤ k. The 1-clique is identical to a clique, because the distance between the vertices is one edge. The 2-clique is the maximal complete sub-graph with a path length of one or two edges. The path distance two can be exemplified by the “friend of a friend” connection in social relationships. In social websites like the LinkedIn, each member can reach his own connections and also the two and three degrees away. The increase of the value k corresponds to a gradual relaxation of the criterion of clique membership. See figure 2.
2.3 k-Clan and k-Club
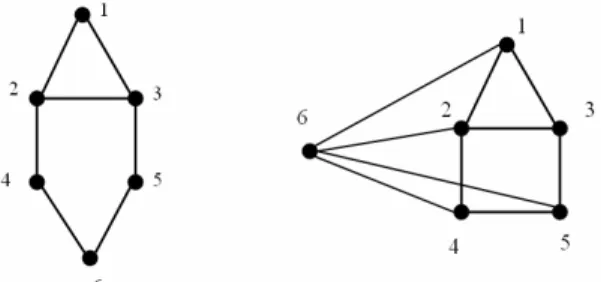
A limitation of the k-clique model is that some vertices may be distant from the group, i.e. the distance, between two nodes, may correspond to a path involving nodes that do not belong to the k-clique. To overcome this handicap Alba [1] and Mokken [17] introduced the diameter based models called k-club and k-clan. The length of the shortest path between vertices u and v in G is denoted by the distance d(u,v). The diameter of G is given by diam(G)= max d(u, v) for all u,v∈ V. To find all k-clan, firstly all the k-cliques Si must be found and then the restriction diam(G[S])≤ k ap-plied to remove the undesired k-cliques. In figure 3, on the left, the 2-clique {1,2,3,4,5} was removed because the d(4,5)=3. Another approach to the diameter models is the k-club which is defined as a subset of vertices S such that diam(G[S])≤ k. In the following figure two 2-cliques: {1,2,3,4,5} and {2,3,4,5,6}, one 2-clan: {2,3,4,5,6} and three 2-clubs: {1,2,3,4}, {1,2,3,5} and {2,3,4,5,6} can be found.
Fig. 3. 2-clans, 2-clubs (left) and 3-plex (right)
2.4 k-Plex
An alternative way of relaxing a clique is the k-plex concept which takes into account the vertices degree. The degree of a vertex of a graph is the number of edges incident on the vertex, and is denoted deg(v). The maximum degree of a graph G is the maxi-mum degree of its vertices and is denoted by Δ(G). On the other hand, the minimaxi-mum degree is the minimum degree of its vertices and is denoted by δ(G). A subset of vertices S is said to be a k-plex if the minimum degree in the induced sub-graph δ(G[S])≥ |S|− k. In figure 3, on the right, the graph with 6 vertices, |S|=6, and the degree of vertices 1, 3, 4 and 5 does not exceed the value 3. So, the minimum degree in the induced sub-graph δ(G[S]) is 3. For |S|=6, k=3 is obtained.
3 The Two Phase Algorithm
Complex network and graph mining measures are essentially based on low complex-ity computational procedures like the diameter of the graph, the degree distribution of the nodes and connectivity checking, underestimating the knowledge of the graph structure components. In this paper we propose a graph mining measure based on k-clique cover, to understand the structure of the graph better, by combining small worlds with the cohesive subgroup analysis.
In order to find the k-cliques minimum cover a two-phase algorithm is proposed. First, all the maximal k-cliques in the graph are found. Second, the minimum subset of the k-cliques is chosen to cover all the vertices of the graph.
To find all the maximal k-cliques in the graph, we use a simple transformation of the graph, in such a way that we can reuse an already studied algorithm, the maximum clique algorithm.
Procedure 1. A two-phase algorithm to find the k-clique cover
Input: distance k and graph G Output: k-clique cover
1. Find all maximal k-cliques in graph G 1.1. Graph transformation into a k-G (Proc. 2) 1.2. Apply maximum clique algorithm (Proc. 3) 2. Find the minimum cover of G with k-cliques 2.1. Apply set covering algorithm (Proc. 4)
3.1 Maximal k-Cliques in Graph G
This section details in graph transformation procedure and the generation of the maximal k-cliques.
3.1.1 Graph Transformation
The transformation of a graph G(V,E) into a graph such that for every i,j∈V, the dis-tance d(i, j) ≤ k, we denote graph k-G(V,E).
To create a graph k-G(V,E), the Floyd Algorithm [10] that finds all the shortest paths in a graph is reused; and then for each edge less or equal to k, an edge is created in the new graph.
Procedure 2. Graph transformation
Input: k, M[n,n] the adjacent matrix of graph G
Output: D[n,n] the k-distance matrix of graph G (or k-Graph) 1. D=M
2. For each (h,i,j) D[i,j] = min(D[i,j], D[i,h]+D[h,j]) 3. For each (i,j) if (D[i,j] <=k) D[i,j]=1 else D[i,j]=0 4. Return D;
3.1.2 Maximum Clique Algorithm
The Maximum Clique is a NP-hard problem that aims to find the largest complete sub-graph in a given graph. In this approach we intend to find a lower bound for the maximization problem, based in the heuristics proposed by Johnson [13] and in the meta-heuristic that uses Tabu Search developed by Soriano and Gendreau [20]. Part of the described work in this section can also be found in [4] and [3].
We define A(S) as the set of vertices which are adjacent to vertices of a current so-lution S. Let n=|S| be the cardinality of a clique S and Ak(S) the subset of vertices with k arcs incident in S. A(S) can be divided into subgroups A(S) = ∪Ak(S), k=1,..,n. The cardinality of the vertex set |V| is equal to the sum of the adjacent verti-ces A(S) and the non-adjacent ones A0(S), plus |S|, resulting in |V|= Σ|Ak(S)|+n, k= 0,.., n. For a given solution S, we define a neighborhood N(S) if it generates a feasible solution S’. In this work we are going to use three neighborhood structures.
We consider the following notation: N+ (S) = {S´: S´= S ∪{vi}, vi∈An(S)} N– (S) = {S´: S´= S \{vi}, vi∈S}
N0 (S) = {S´: S´= S ∪{vi}\{vk}, vi∈ An-1(S), vk∈S} S – the current solution
S*– the highest cardinality maximal clique found so far T– the tabu list
N(S) – neighborhood structures
Procedure 3. Tabu Heuristic for the Maximum Clique Problem
Input: k-Graph, complete sub-graph S Output: clique S*
1. T=∅; S*=S;
2. while not end condition
2.1. if (N+(S)\T ≠ null) choose the maximum S’
2.2. else if (N0(S)\T ≠ null) choose the maximum S’; update T 2.2.1. else choose the maximum S’ in N–(S); update T 2.3. update S=S’
2.4. if (|S|>|S*|) S*=S; 3. end while;
4. return S*;
Finding a maximal clique in a k-graph is the same as finding a maximal k-clique in a graph. To generate a large set of maximal k-cliques, a multi-start algorithm is used, which calls the Tabu Heuristic for Maximum Clique Problem.
3.2 Minimum k-Cliques Cover
The input for the k-clique cover is a matrix where the lines correspond to the vertices of the graph and each column is a k-clique that covers a certain number of vertices. The Clique Cover heuristic proposed by Kellerman [14] and improved by Chvatal [5] is described in the following pseudo-code.
We consider the following notation:
M[line, column] or M[vertex, k-clique] – input matrix C – vector of the cost of each column
V – vertex set of G(V,E) S – the set covering solution
Procedure 4. Heuristic for the k-clique covering
Input: M [line, column], C, V Output: the cover S
1. Initialize R=M, S=∅, 2. While R ≠ ∅ do
2.1. Choose the best line i*∈R such as |M(i*,j)|=min |M(i,j)| ∀j 2.2. Choose the best column j* that covers line i*
2.3. Update R and S, R=R\M(i,j*) ∀i, S=S∪{j*} 3. End while
4. Sort the cover S by descending order of costs 5. For each Si do if (S\Si is still a cover) then S=S\Si 6. Return S
In the constructive heuristic, for each iteration, choose a line to be covered, the best column that covers the line and update the solution S and the remaining vertex R. The chosen line is usually the line that is more difficult to cover, i.e. the line which corre-sponds to fewer columns. After reaching the cover set, the second step is to remove redundancy, by sorting the cover in descending order of cost and checking if each k-clique is really essential.
This constructive heuristic can be improved using a Tabu Search heuristic that re-moves the most expensive columns and re-builds a new solution as presented in [11].
The set partition problem is very similar to the set covering one. The partition of a set is a division into non-overlapping parts that cover all the set. On the other hand, the set covering problem allows overlapping called over-covered elements. In both problems less-covered elements are not allowed.
3.3 Numeric Example
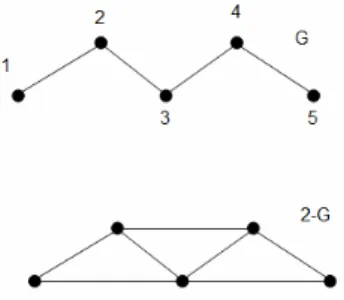
Given a graph with 5 vertices and 4 edges with E={(1,2), (2,3), (3,4) ,(4,5)} in figure 4, applying the graph transformation, Procedure 2, with k=2, a new graph with 5 vertices and 7 edges is obtained with k-E={(1,2), (1,3), (2,3), (2,4), (3,4) ,(3,5),(4,5)}.
Fig. 4. Example of a graph G and its transformation into a 2-G (Proc. 2)
Running a multi-start algorithm, Procedure 3, with the maximum clique problem, three maximal cliques of size 3 can be easily identified: (1,2,3), (2,3,4) and (3,4,5).
Fig. 5. k-clique generation (Proc. 3)
Finally, running the k-cliques cover, Procedure 4, two subgroups are found that cover all the vertices. The 2-clique cover is equal to two. Notice that the vertex num-ber 3 appears in the two sets. In social network analysis this is called a “bridge”. In-deed, vertex 3, with distance 2 can reach any other vertex.
Fig. 6. Two 2-cliques cover the whole graph (Proc. 4)
Figure 6 presents the two subsets solution using a matrix representation and a graph. For large graphs and a large number of subsets the visualization gets worse. To get a better general view of the data we suggest the matrix representation, which is the output of the set covering heuristic.
4 Computational Results
To implement the computational results of this algorithm some choices must be made such as the computational environment, the datasets and the graph mining measures.
The computer programs were written in C language and the Dev-C++ compiler was used. The computational results were obtained from a 2.53GHz Intel Core-2Duo proces-sor with 4.00 GB of main memory running under the Windows Vista operating system.
To validate the two-phase algorithm two groups of datasets were used, the Erdos graphs and some clique DIMACS [7] benchmark instances. In Erdos graphs each node corresponds to a researcher, and two nodes are adjacent if the researchers pub-lished together. The graphs are named “ERDOS-x-y”, where “x” represents the last
Table 1. Sequence of k-clique cover
cardinality of the k-clique cover graph nr nodes longest path k=1 k=2 k=3 k=4 k=5 k=6 k=7 k=9 k=18 k=40 Test 18 6 7 4 3 2 2 1 -- -- -- -- Erdos-97-1 472 6 9 8 7 7 4 1 -- -- -- -- Erdos-98-1 485 7 8 8 7 5 1 1 1 -- -- -- Erdos-99-1 492 7 8 8 7 7 1 1 1 -- -- -- brock200_1 200 2 24 1 -- -- -- -- -- -- -- -- brock200_2 200 2 26 1 -- -- -- -- -- -- -- -- brock400_1 400 2 26 1 -- -- -- -- -- -- -- -- brock400_2 400 2 23 1 -- -- -- -- -- -- -- -- c-fat200-1 200 18 16 11 9 8 7 7 6 5 1 -- c-fat200-2 200 9 9 7 5 4 3 3 3 1 -- -- c-fat500-1 500 40 16 12 9 7 7 6 6 4 3 1
two digits of the year that the graphs was create, and “y” the maximum distance from Erdos to each vertex in the graph. The second group of graphs contains some clique instances from the second DIMACS challenge. These include the “brock” graphs, which contain cliques “hidden” within much smaller cliques, getting hard to discover cliques in these graphs. The “c-fat” graphs are a result of fault diagnosis data.
In this paper we propose a graph mining measure based on k-cliques, to understand the structure of the graph better, by combining small worlds with the cohesive sub-group analysis. The measure for small worlds can be obtained using the diameter of the graph, i.e. the longest shortest path in the graph, as already stated. For the cohe-sive subgroups study, we use the concept of k-clique.
For the analysis of each graph, we consider the number of nodes, the longest path, the average path and the cardinality of the set of k-cliques that cover all the nodes, varying k from 1 to the longest path.
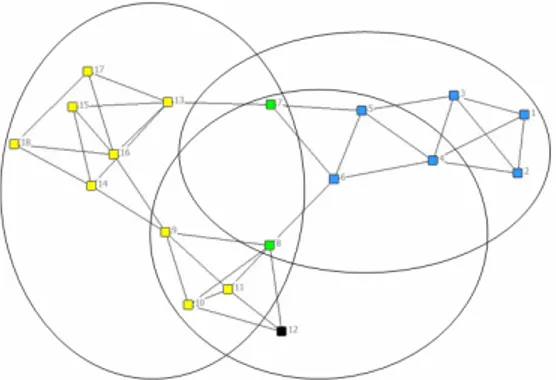
The “test” graph with 18 nodes, has the longest path equal to 6. To cover the graph seven 1-clique are needed, or four 2-cliques are needed, and so on, until one 6-clique is needed. Figure 7 shows the 3-clique cover.
For the Erdos-98-1 and Erdos-99-1, with the longest path of 7, the graphs are cov-ered with only one 5-clique. These values exemplify the difference between k-cliques and k-clans, these graphs are 5-cliques but not 5-clans because the diameter is equal to seven.
The “brock” graphs, known as hiding cliques, have a short longest path, equal to 2, and to cover the graph one 2-clique is enough. Most of the DIMACS instances present this profile. On the other hand, the “c-fat” graphs, have the shortest path larger than 7, generating long sequences of k-clique cover.
In the proposed measure, the sequence of k-clique covers, identifies families of graphs, and seems to be very promising.
Fig. 7. Three 3-clique are needed to cover the Test graph
5 Conclusions
The popular saying that establishes that "to be right is not enough, someone needs to say you are right" agrees with the relevance of social networks in the area of artificial intelligence. The model of artificial intelligence focused on a single entity tends to
soon become soon outdated. On the other hand, models based on the agents’ interac-tion are emerging, strengthening the concept of social networks.
Given the large amount of data, provided by the Web 2.0, there is a pressing need to obtain new measures to better understand the networks’ structure; how their com-ponents are organized and the way they evolve over time.
Complex network measures are essentially based on low complexity computational procedures like the diameter of the graph, the degree distribution of the nodes and connectivity checking, while underestimating the knowledge of the graph structure components.
In this paper the concept of relaxed clique is extended to the whole the graph, to achieve a general view, by covering the network with cliques. The sequence of k-clique covers is presented, combining small world concept with community structure components. The analysis of the sequences shows that different graph families have different structures.
Additional, non-mentioned features in this paper, like the over-covered nodes, the k-cliques cardinality and the k-clique composition can be obtained.
Social networks do not exceed a hundred nodes. In this work the proposed two-phase algorithm deals with graphs with hundreds of nodes, with a running time per-formance of a few seconds. In future work, we would like to extend this approach to larger datasets, with thousands of nodes.
References
1. Alba, R.D.: A graph-theoretic definition of a sociometric clique. Journal of Mathematical Sociology 3, 113–126 (1973)
2. Berners-Lee, T.: The Next Wave of the Web: Plenary Panel. In: 15th International World Wide Web Conference, WWW2006, Edinburgh, Scotland (2006)
3. Cavique, L., Luz, C.: A Heuristic for the Stability Number of a Graph based on Convex Quadratic Programming and Tabu Search, special issue of the Journal of Mathematical Sciences, Aveiro Seminar on Control Optimization and Graph Theory, Second Series (to appear, 2009)
4. Cavique, L., Rego, C., Themido, I.: A Scatter Search Algorithm for the Maximum Clique Problem. In: Ribeiro, C., Hansen, P. (eds.) Essays and Surveys in Metaheuristics, pp. 227– 244. Kluwer Academic Publishers, Dordrecht (2002)
5. Chvatal, V.: A greedy heuristic for the set-covering problem. Math. Oper. Res. 4, 233–235 (1979)
6. Cook, D.J., Holder, L.B. (eds.): Mining Graph Data. John Wiley & Sons, New Jersey (2007)
7. DIMACS: Maximum clique, graph coloring, and satisfiability, Second DIMACS implemen-tation challenge (1995), http://dimacs.rutgers.edu/Challenges/ (accessed April 2009)
8. Erdos, P., Renyi, A.: On Random Graphs. I. Publicationes Mathematicae 6, 290–297 (1959)
9. Faloutsos, M., Faloutsos, P., Faloutsos, C.: On power-law relationships of the Internet to-pology. In: SIGCOMM, pp. 251–262 (1999)
11. Gomes, M., Cavique, L., Themido, I.: The Crew Time Tabling Problem: an extension of the Crew Scheduling Problem. Annals of Operations Research, volume Optimization in transportation 144(1), 111–132 (2006)
12. Grossman, J., Ion, P., Castro, R.D.: The Erdos number Project (2007), http://www.oakland.edu/enp/ (accessed April 2009)
13. Johnson, D.S.: Approximation algorithms for combinatorial problems. Journal of Com-puter and System Science 9, 256–278 (1974)
14. Kellerman, E.: Determination of keyword conflict. IBM Technical Disclosure Bulle-tin 16(2), 544–546 (1973)
15. Luce, R.D.: Connectivity and generalized cliques in sociometric group structure. Psycho-metrika 15, 159–190 (1950)
16. Milgram, S.: The Small World Problem. Psychology Today 1(1), 60–67 (1967) 17. Mokken, R.J.: Cliques, clubs and clans. Quality and Quantity 13, 161–173 (1979)
18. Moreno, J.L.: Who Shall Survive? Nervous and Mental Disease Publishing Company, Washington DC (1934)
19. Scott, J.: Social Network Analysis - A Handbook. Sage Publications, London (2000) 20. Soriano, P., Gendreau, M.: Tabu search algorithms for the maximum clique. In: Johnson,
D.S., Trick, M.A. (eds.) Clique, Coloring and Satisfiability, Second Implementation Chal-lenge DIMACS, pp. 221–242 (1996)
21. Wasserman, S., Faust, K.: Social Network Analysis: Methods and Applications. Cam-bridge University Press, CamCam-bridge (1994)
22. Watts, D.J., Strogatz, S.H.: Collective dynamics of small-world networks. Nature 393(6684), 409–410 (1998)