Evolutionary Method of Population Classification
According to Level of Social Resilience
Coulibaly Kpinna Tiekoura
Research Laboratory in Computer Science andTelecommunications (LARIT)
National Polytechnic Institute Houphoüet Boigny (INPHB) Abidjan, Ivory Coast
Brou Konan Marcellin
National Polytechnic InstituteYamoussoukro, Ivory Coast
Babri Michel
National Polytechnic InstituteAbidjan, Ivory Coast
Souleymane Oumtanaga
National Polytechnic InstituteAbidjan, Ivory Coast
Abstract—Following the many natural disasters and global socio-economic upheavals of the 21st century, the concept of resilience is increasingly the subject of much research aimed at finding appropriate responses to these traumas. However, most existing work on resilience is limited to a broad cross-disciplinary panel of non-operational theoretical approaches. Thus, the study of the processes of social resilience is confronted with difficulties of modeling and a lack of appropriate analysis tools. However, the existing stratification methods are too general to take into account the specificities of the resilience and are difficult to use for non-specialists in modeling. In addition, most traditional methods of partition research have limitations including their inability to effectively exploit the research space. In this paper, we propose a classification algorithm based on the technique of genetic algorithms and adapted to the context of social resilience. Our objective function, after penalization by two criteria, allows to explore widely the space of research for solutions while favoring classes quite homogeneous and well separated between them.
Keywords—genetic algorithm; Unsupervised classification; social resilience; Partitioning method
I. INTRODUCTION
Resilience is a polysemic concept that is studied in several fields including sociology, ecology, economics, computer science and psychology. Resulting from the physics of materials where it designates the ability of a system to resume its initial equilibrium after a deformation, resilience is the segment of many researches these days. However, analysis of the literature in this area reveals a lack of operational approaches. This paper is a contribution to the process of operationalizing the concept of social resilience that is defined by the French ethologist Boris Cyrulnik as the ability of a person, a social group or an environment to overcome suffering or trauma [1].
One of the fundamental principles of clustering is to ensure the partitioning of a set of objects so that the elements of the same group are as similar as possible and that the various groups are distinct among themselves. There are several
families of classification methods, the most widely used of which are hierarchical classification methods and partitioning methods. These methods, however, present a certain number of not inconsiderable drawbacks. In effect, hierarchical or agglomerative methods are limited to small sets of sizes due to the fact that they store in memory a dissimilarity matrix whose size is quadratic as a function of the number of vertices. As for partition-based classification methods, in addition to generating sub-optimal results dependent on the initial partition, they exploit only a small part of the solution search space. This calls for the need to develop other methods offering more possibilities for exploring this research space. The genetic algorithms developed by John Holland [2] respond to this concern. Indeed, these algorithms, inspired by the principles of the neo-Darwinian natural evolution are known for their effectiveness in exploring quite large and complex research spaces. They generally allow to generate good solutions following the application of a cycle of operations (selection, crossing, mutation). One of the interests of our proposal is its ability to identify different dominant characteristic groups in a given population. It thus adapts well to the context of social resilience [3] especially in the study of social stratification within a population victim of a traumatic shock. In other words, an application of this situation could be the identification of the social groupings of a population according to the degrees of resilience of the different individuals facing a traumatic shock.
In this paper, after a presentation of the genetic algorithms and some work done, we present our proposition followed by a conclusion.
II. GENETIC ALGORITHMS
A. Principle
(chromosomes) and proceeds by successive iteration to generate new individuals by applying different selection, crossover and mutation operators until reaching a stop criterion. An evaluation function makes it possible to evaluate beforehand each chromosome candidate for the selection. As a result of the evaluation, a sub-population which is victorious of chromosomes is retained for reproduction. The crossover and mutation operations are carried out respectively according to a crossing probability (Pc) and a mutation probability (Pm).
B. Genetic operators
- The selection operator: It allows parents to be chosen for reproduction according to an evaluation function called fitness. Generally, for a population of n individuals, n / 2 is selected for reproduction through the crossing step. We distinguish several techniques of selection in the literature of which the most used are the technique of roulette or the "roulette-wheel", the technique of the tournament, the technique of the rank (ranking ) and the universal stochastic selection [6][7][8].
- The crossover operator: This operator makes it possible to cross the n2pre-selected parents to generate new children
who have characteristics of their parents. It thus complements the population of n2individuals to
n
individuals. The crossingis done according to a probability
P
cwhich increases with the number of cross points. Three main crossover operators are distinguished: crossing at one point, crossing at n-points (n ≥ 2) and uniform crossing.- The mutation operator: This operation consists in modifying, randomly, the value of an allele following a mutation probability
P
m, which is generally very low. A too high mutation probability could lead to a suboptimal solution.III. STATE OF THE ART
M. Merzougui et al. [9] propose an improvement of the unsupervised classification algorithm Isodata through its main parameters. Indeed, because the results of "Isodata" are intrinsically linked to a threshold from which a class is divided and another threshold from which two classes are merged, the authors use the genetic algorithms to determine these two optimal thresholds. This has improved the quality of this algorithm. However, other parameters are empirically fixed, such as the bounds of the chromosome membership interval of the initial population. This helps to always influence the results of the algorithm despite some performance.
Stephane Legrand [10] proposes a genetic program to discover subsets of homogeneous and distinct data in a file called "Zoo". Thus, it represents an individual in the form of a tree of logical formulas. Each logical formula consists of a variable number of predicates. It evaluates the individuals from an evaluation function based on a measure of homogeneity (H) and a measure of the separability (S) of the data subsets and equal to:
fitness
=
H
+
µ
S
. It applies a coefficientµ
to the measurement of separability in order to vary the relative weight of the two measurements. It considers the homogeneity H as the weighted average of the homogeneity of the various subsets and the separability S as the weighted average of thedistances between the centroids of the subsets. The convergence of the algorithm is not proved. Moreover, the arbitrary choice of the coefficient
µ
greatly influences the quality of the results.Maulik et al. [11] propose a clustering method based on a genetic algorithm in which each element is assigned to the nearest centroid so as to form clusters. Each time, the centroids are recalculated as the average of the elements of the same group and the inverse of the intra-group inertia is then calculated to reduce to a maximization problem. The authors use a representation of the individuals in the form of k tuples and encode the coordinates of the k centroids by real numbers. Initially, they initialize an initial population of P chromosomes randomly. Moreover, the selection technique used is an elitist proportional castor, which allows to retain the best candidate of the previous generation. Unlike the previous algorithm, it converge towards the global optimum. However, it does not solve the question of non-consistent classes (having one element) and separability between classes.
Greene [12] proposes a method that generates hierarchies of partitions. It begins with a top-down method by which the initial population is subdivided into several subpopulations. Evaluation consists in optimizing a function dependent on intra-group and inter-group inertia and on the size of the constituted groups. To limit the influence of initial conditions including the order of insertion of objects in the tree, the author proposes to generate the best possible tree by applying a genetic algorithm. An initial population of trees is generated by choosing a random order of insertion of the objects. The different selection, crossing and mutation operators are applied. The selection is made by the elitist proportional roller technique where the two best solutions are retained after evaluating the quality of each tree. For crossing, it chooses the best branches of the first level of each tree. The algorithm takes into account any objects that are repeated in two classes or missing in the partition. In the first case, the object is maintained in the best class and in the second case, it is simply reinserted. This algorithm unfortunately does not provide information on the optimality of the generated solution.
IV. OUR PROPOSAL
A. Motivations
In order to study the processes of social resilience, researchers often use classification methods that are often poorly adapted to this domain because they do not respect certain specificities linked to the concept, particularly its unobservable, temporal and dynamic aspect.
solution-seeking space and can be applied to larger sets of data. In addition, it can be adapted to any field of study. In this paper, the algorithm is applied to a real data set, obtained from a survey of a sample of people in relation to the recent post-electoral crisis in Ivory Coast. The objective is to find the main sociological groupings caused by the trauma of this crisis within the population studied. In a broader case study, the results of our algorithm can be used by the actors to facilitate the making of certain decisions in favor of the resilience of the traumatized individuals.
B. Notation
n
: The number of objects to be classified;T
: The time horizon for estimating the resilience of individuals;Q
: The total number of classes; :t T
Ω
: Set of objects to be classified according to the information collected over the period from t to T;( )
Pop t
: Population of individuals (chromosomes) at time t;t i
ξ
: Estimation of the resilience of the individual at time t.[1... ]
i
∈
n
q
C
: The qth class asq
∈
[1... ]
Q
cr
P
: Crossover probability;mut
P
: Mutation probability;q
n
: Number of objects in classC
q;
t j
I
: jth partition of the SetΩ
t T:at time t;
K
: Population size (Number of partitions);M
: Maximum number of iteration (generation);Matr
: Dissimilarity matrix;()
t init
fit
: Initial objective function;()
t pfit
: Objective function after penalization;( )
t t
p
fit
I
: Evaluation value of the individualI
t ;q
g
: Center of gravity of the classC
q;g
: Center of gravity of the whole point cloud;d
: Euclidean distance; αδ
: Percentage of classes whose numbers are less than 1 (minimum number);β
δ
: Percentage of classes with closely spaced classes;δ
: The overall penalty rates;A
: All classes whose size is less than or equal to 1;B
: All non-homogeneous classes;( )
card A
: Cardinality of the set A.C. Representation of Individuals
An individual is a class partition and is a potential solution to the problem. In the context of genetic algorithms, it is represented by a chromosome composed of genes. Each gene represents a class and consists of a sequence of binary digits (0, 1). In this paper, we use a presence / absence coding where the presence of an object in a class is marked by the number 1 and its absence by the number 0.
Example of coding of our chromosome:
Either a given set of 12 traumatized persons each represented by its social resilience value
ξ
it:{
}
: ; ; ; ; ; ; ; ; ; ; ; 1 2 3 4 5 6 7 8 9 10 11 12
t T ξ ξ ξ ξ ξ ξ ξ ξ ξ ξt t t t t t t t t t ξt ξt
Ω =
A random partitioning of this set made it possible to obtain the following two partitions:
{
( ; ; ; ; ),( ; ; ; ),( ; ; )}
1t 1t 3t 4t 6t 8t 2t 5t 9 12t t 7 10 11t t tI = ξ ξ ξ ξ ξ ξ ξ ξ ξ ξ ξ ξ
{
( ; ; ; ),( ; ; ; ; ),( ; ; )}
2 1 5 9 11 2 3 4 6 8 7 10 12
t t t t t t t t t t t t t
I = ξ ξ ξ ξ ξ ξ ξ ξ ξ ξ ξ ξ
The coding of these partitions gives the following chromosomes:
{
(101101010000)(010010001001)(000000100110)}
1t I =
{
(100010001010)(011101010000)(000000100101)}
2 t I =
D. Our evaluation function
In order to obtain homogeneous classes, we propose an evaluation function which minimizes the ratio of intra class inertia by total inertia. It is as follows:
2
1
(
,
)
1
(
)
2
1
(
, )
1
Q
t
d
g
n
t
i
q
q
C
i
q
t
t
fit
I
init i
n
t
d
g
n
i
i
ξ
ξ
ξ
∑
∑
=
∈
=
∑
=
2 ( , )
1
(
)
2 ( , )
1
Q
t
d
g
i
q
t
q
C
i
q
t
t
fit
I
init i
n
t
d
g
i
i
ξ
ξ
ξ
∑
∑
=
∈
=
∑
=
Since the classification often leads to empty classes or classes containing a single element, we propose to penalize the above evaluation function by a rate which is the percentage of classes whose numbers are less than or equal to one. Moreover, in order to obtain homogeneous classes well separated from each other, we propose to penalize also the objective function by the percentage of classes whose class centers are relatively close. We obtain the global penalization rate
δ
such as:{
,
}
j
j
δ
δ
α β
=
∑
∈
(2)( )
card A
Q
α
δ
=
(3)( )
(
1) / 2
card B
Q Q
β
δ
=
−
(4)Therefore, the penalized objective function is calculated as follows:
( )
it( )
it( )
itt
t
t
fit
I
fit
I
fit
I
p
=
init
−
δ
init
(
)
(1
)
(
)
t
t
t
t
fit
I
fit
I
p i
= −
δ
init
i
2 ( , )
1
(
)
(1
)
2 ( , )
1
Q
t
d
g
i
q
t
q
C
i
q
t
t
fit
I
p i
n
t
d
g
i
i
ξ
ξ
δ
ξ
∑
∑
=
∈
= −
∑
=
(5)
E. The choice of parameters
• For the selection, we use the roulette method which is similar to a lottery wheel on which each individual is represented by a sector equivalent to his fitness value. At each turn of the wheel, each individual has a probability of being selected proportional to its fitness value :
( )
( ) /
( )
1
n
t
t
prob I
fit I
fit I
i
i
i
i
i
i
=
∑
=
(6)• For the crossing of the individuals, we use the crossing at a point of cut chosen randomly among the
l
−
1
possible points (
l
representing the length of a chromosome). At this level, we choose a crossing probability as advocated by Goldberg [13]. In our case,0, 6
P
cr
=
• For the mutation, we opt for a mutation probability inversely proportional to the size of our population, i.e.
0, 08
mut
P
=
.• As criterion for stopping our algorithm, we retain the maximum number of iterations (or generations) fixed.
F. Proposed Algorithm
_________________________________________________
Algorithm: Significant group identification algorithm (AlgoGene)
INPUT: dissimilarity matrix (Matr), Maximum number of classes (Q),
Population size (K)
Maximum number of generations (J)
OUTPUT: PartitionItj =C1,...,Cq, which minimizes the
most fitness function
BEGIN
1. //Random generation of the initial population
1.1.Choose random Q centers of gravity g q 1.2.Assign each observation to the nearest
center: 0
{
,...,}
0 1
I =C Cq
1.3.Calculate the new class centers
g t n
q i q
t C
i q
ξ ξ ← ∑
∈
1.4.Repeat steps 1.2 and 1.3 until the initial fixed population size (K)
1.5.Return the initial population to optimize (0)
{
0,...,0}
0
pop ←I Ik
2. //Optimization of the initial population
2.1.Coding the initial population (pop (0)) to binary
2.2.Evaluate the initial population Repeat
2.3.Select from the roulette wheel K/2 parents individuals (P (t) in P (t-1))
2.4.Cross at a point the selected individuals with a probabilityP
cr.
2.5.Making a mutation on the descendants obtained with a probabilityPmut.
2.6.Returning the new population
pop t( )←pop t( − +1) descendants 2.7.Evaluate the new population found
2 ( , ) 1
( ) (1 )
2 ( , ) 1
t j
Q
t d i gq t
q C
i q t
fitp I n
t d i g i
ξ ξ
δ
ξ
∑ ∑
= ∈
← −
∑ =
Until: Number of generations > M
Return the best partition Itj =C1,...,Cq
END
G. Results and interpretations
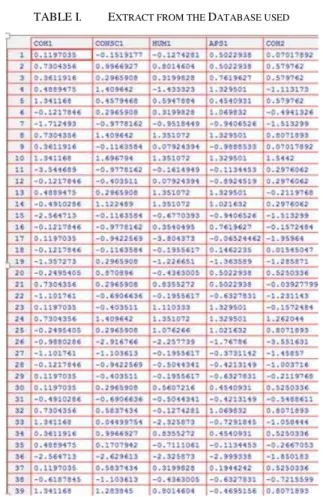
For the application of our algorithm, we use a real data set, obtained from a survey of a sample of one hundred (100) individuals (see Table 1). This survey relates to the trauma caused by the recent post-election crisis in these people.
TABLE I. EXTRACT FROM THE DATABASE USED
The objective is to identify the significant groupings that can be obtained from this population in order to make decisions. After simulations, it appears that the best classification result is obtained for 3 classes with a Rand index of 0.89 after 150 iterations (generations) (see Table 2). According to this classification, 18 individuals are in the first class, 32 individuals are in the second class and the other 50 individuals are in the third class.
TABLE II. TABLE OF RAND INDICES OBTAINED FOR 2,3,4,5 AND 6 CLASSES
2 3 4 5 6
Rand
Index 0,629 0,891 0,87 0,859 0,53
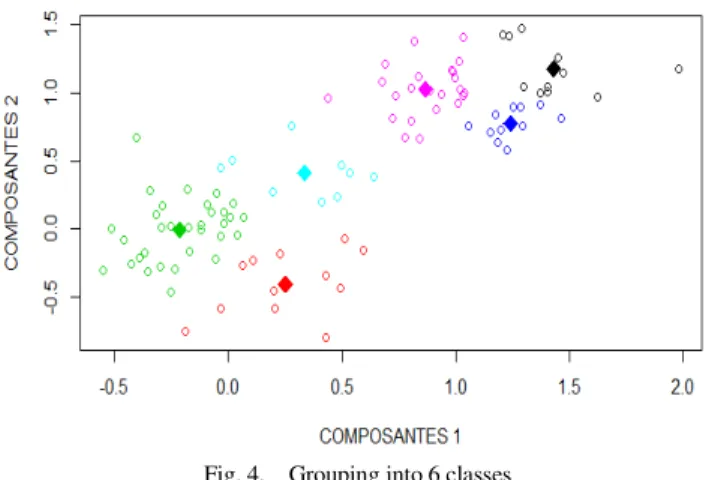
The following figures show the best groupings obtained respectively for 3, 4, 5 and 6 classes.
Fig. 1. Grouping into 3 classes
Fig. 2. Grouping into 4 classes
Fig. 4. Grouping into 6 classes
On the other hand, experimentation has shown that, from 150 iterations, the classes are more closely grouped and distinct.
V. COMPARISON OF OUR PROPOSAL WITH OTHER WORKS
These hybrid algorithms are very different which makes them very difficult to compare. However, in the table below, we present some points of comparison.
TABLE III. COMPARATIVE TABLE OF OUR ALGORITHM (ALGOGENE) WITH
OTHER WORKS
M erz o u g u i e t a l St e pha ne L eg ra n d Ma ul ik e t a l G reen e A lg o G e ne M o d el P ar tit io n in k fix ed cl as ses P ar tit io n in k fix ed cl as ses P ar tit io n in k fix ed cl as ses P ar tit io n H ie ra rc h y (fre e k ) P ar tit io n in k fix ed cl as ses V al id ity c las ses O v erl ap fro m 6 cl as ses O v er lap b et w ee n cl as ses Al wa y s v al id N o t v al id (em p ty cl as es + d u p li ca te s) Al wa y s v al id C on v er ge nc e C on v er ge t o g lob al o p tim u m N o in d ic atio n o n co n v er ge nc e C on v er ge t o g lob al o p tim u m N o t s ta n d ar d , d ep en d in g o n in it ia l c o n d it io n s C on v er ge t o g lob al o p tim u m S ep ar ab ili ty N o t r es p ect ed at a ce rta in le v el o f cl as ses M u ch r el at ed t o th e p ar am et er μ N o t r es p ec te d f o r cer ta in c las ses R es p ect ed R es p ect ed R ep re sen ta tio n R ea l n u m b er e n co d in g T re e o f l o g ic al fo rm u la s C en tr o id s ( act u al coor di na te s) T re e B in ar y c o d in g a b se n ce / p re sen ce
VI. CONCLUSION
We proposed a hybrid-partitioning algorithm for the identification of significant groups as a function of the levels of resilience. It generates from a traditional method of partitioning partitions, which are then optimized using the technique of genetic algorithms to give the best partition possible: one that minimizes the most intra-class inertia and promotes classes while eliminating classes that have only one element.
The results of our simulations showed that the algorithm converges after 150 iterations by providing a solution corresponding to the expected objective. The Rand index (0.89) obtained without doubt translates the good performance of our algorithm. In future work, we intend to extend this algorithm to other areas of study other than social resilience to test its robustness.
REFERENCES
[1] Boris Cyrulnik « Manifeste pour la résilience ». Spirale 2/2001, n°18, p. 77-82, 2001.
[2] J. H. Holland. Adaptation in Natural and Artificial Systems. University of
Michigan Press,Ann Arbor, MI, USA, 1975.
[3] Boris Cyrulnik. « Le murmure des fantômes ». Odile Jacob, 2003. [4] Duflo, Marie. Algorithmes stochastiques. 1996.
[5] Back, Thomas. Evolutionary algorithms in theory and practice: evolution
strategies, evolutionary programming, genetic algorithms. Oxford
university press, 1996.
[6] Sean Luke. Essentials of Metaheuristics. Lulu, second edition, 2013. [7] T. Blickle & L. Thiele. A comparison of selection schemes used in
genetic algorithms. Evolutionary Computation, 4(11): 311–347, 1995. [8] D. E. Goldberg & K. Deb. A comparative analysis of selection schemes
used in genetic algorithms. In Foundations of Genetic Algorithms, pp. 69–93. Morgan Kaufmann, 1991.
[9] M Merzougui, M. Nasri, Ahmad El Allaoui. Isodata et les algorithms génétiques pour une classification non supervisée. Présenté au Congrès Méditerranéen des Télécommunications (CMT’16), 12-13 mai 2016, At
Téhouan, Maroc. Répéré à https://www.researchgate.net/publication/303276467_Isodata_et_les_algo
rithmes_genetiques_pour_une_classification_non_supervisee.
[10] Stephane Legrand, Résolution de problème de classification par algorithmes évolutionnaires grâce au logiciel DEAP, octobre 2014, repéré à
https://stephanelegrand.files.wordpress.com/2014/10/classification_algo_ evol.pdf
[11] U. Maulik and S. Bandyopadhyay. Genetic algorithm-based clustering technique. Pattern Becognition, 33: 1455-1465, 2000.
[12] William A. Greene. Unsupervised hierarchical clustering via a genetic algorithm. In Proceedings of the 2003 Congress on Evolution, pages 998-1005, 2003.
[13] D. E. Goldberg. Genetic Algorithms in Search, Optimization, and Machine Learning. Studies in Computational Intelligence.
Addison-Wesley Longman Publishing Co., Inc., 1st edition, 1989. ISBN