Ana Cláudia Moreira Azevedo
janeiro de 2014
Genetic profile of the Iberian Peninsula
population: contributions of AIMs
UMinho|20
14
Ana Cláudia Mor
eira Aze
vedo
Genetic profile of t
he Iberian P
Ana Cláudia Moreira Azevedo
janeiro de 2014
Dissertação de Mestrado
Mestrado em Genética Molecular
Genetic profile of the Iberian Peninsula
population: contributions of AIMs
Trabalho realizado sob a orientação da
Doutora Ana Paula Fernandes Monteiro Sampaio
Carvalho
e da
iii
Acknowledgements/Agradecimentos
No fim desta etapa gostaria de agradecer a todos aqueles que me ajudaram ao longo desta:
À Professora Doutora Cristina Pereira Santos, minha orientadora, por ter aceite orientar uma aluna de outra universidade e que não conhecia, pela partilha de conhecimentos científicos, pela paciência e pelo apoio que sempre me deu,
À Professora Doutora Ana Paula Fernandes Monteiro Sampaio Carvalho, minha co-orientadora, agradeço-lhe pela simpatia e tempo que despendeu comigo,
Aos meus pais, por todo o apoio que me deram e por terem tornado este sonho possível,
À minha irmã, Bia, por todo o apoio e por me ter sempre uma palavra de conforto quando as coisas não corriam como esperado,
A todos os amigos que deixei em Portugal, pelo apoio e carinho que me deram,
Á Tânia por ter sido uma óptima companheira de Erasmus,
À Rut, Mar, Sara e Maria por todo o apoio e à Amanda pela ajuda e paciência,
A todos da Unidade de Antropologia Biológica na Faculdade de Biociências da Universidade Autónoma de Barcelona,
A todos que conheci durante a minha estadia na Catalunha,
A todos o meu Obrigado! Merci! Gracias!
Por fim gostaria de agradecer ao programa Erasmus Placements pelo financiamento para o período de mobilidade.
v
Abstract
Ancestry informative markers (AIMs) are a type of single nucleotide polymorphism (SNP) used to establish the probability of an individual biogeographical ancestry, as they occur at different frequencies on each population.
The aims of this study are: chapter 1) to select European AIMs that would allow to differentiate Iberian populations and design and validate primers that allow to analyse the selected AIMs by High Resolution Melting (HRM); chapter 2) to preliminarily genetically characterize three Iberian populations using selected SNPs.
For these purposes, twenty-six SNPs were selected in order to capture a north-south genetic gradient observed in Europe and the influence of Sephardic Jews. For the selected SNPs, primers which would allow the amplification of the region that contained the SNP were design. From the initial group, five SNPs were selected and the primers tested in the laboratory, PCR conditions were optimized and then used for analyses by HRM.
In chapter two, three SNPs were genotyped using HRM methodology in three specific Iberian populations, namely, Catalonia, Andalucia and Zamora. The data obtained was then compared to data of other populations already available. This preliminary study allows a glimpse of a possible European north-south axis in the Peninsula, nevertheless an extended work has to be performed using all the selected SNPs and including more Iberian populations.
vii
Resumo
Marcadores informativos de ancestralidade (AIMs) são um tipo de polimorfismo de nucleótido único (SNP) usados para estabelecer a probabilidade de ancestralidade biogeográfica de um individuo, pois ocorrem com diferentes frequências em cada população.
Os objetivos deste estudo são: o capítulo 1) selecionar AIMs europeus que permitam diferenciar as populações ibéricas, desenhando e validando primers que permitam a análise dos AIMs selecionados por High Resolution Melting (HRM), capítulo 2 ) caracterizar geneticamente, de forma preliminar, três populações ibéricas através dos SNP previamente selecionados.
De forma a atingir os objetivos propostos, selecionaram-se vinte e seis SNPs, para se verificar a possível existência de um gradiente genético, de norte para sul da Europa, e a influência dos judeus sefarditas. Para os SNPs selecionados, foram desenhados primers que permitissem a amplificação da região que contivesse o SNP. Do grupo inicial de vinte e seis SNPs, cinco foram selecionados e os seus primers testados em laboratório, com condições de PCR otimizadas, e em seguida usados na análise pela técnica de HRM.
No capítulo dois, fez-se a genotipagem de três SNPs, pela metodologia de HRM, em três populações ibéricas, nomeadamente, Catalunha, Andaluzia e Zamora. Os dados obtidos foram comparados com os dados de outras populações já disponíveis.
Este estudo permite um vislumbre de um possível eixo europeu norte-sul presente na península ibérica. No entanto, um trabalho mais exaustivo deverá ser realizado utilizando todos os SNPs selecionados e incluindo outras populações ibéricas.
ix
Index
Acknowledgements/Agradecimentos ... iii Abstract ... v Resumo ... vii Index of Figures ... xiIndex of Tables ... xii
I. Introduction ... 1
1.Evolution and Diversity ... 1
1.1 - Human populations’ genetics ... 2
1.2 - Single nucleotide polymorphism (SNP) ... 3
1.3 - Ancestry informative markers (AIMs) ... 5
1.4 - Typing methodologies ... 6
2. Iberian Peninsula: Geographical and Historical Considerations ... 9
2.1 - Iberian Peninsula ... 9
2.1.1 - Catalonia ... 12
2.1.2 - Andalucía ... 13
2.1.3 - Zamora ... 14
2.2 - Genetic Diversity and Structure of the Iberian Peninsula ... 16
II. Aims ... 19
III. Chapter I - Primer design and validation for analysis of European AIMs . 21 1. Material and methods ... 21
1.1 - SNP selection ... 21
1.2 - Primer design for HRM ... 21
1.3 - Control Samples ... 22
1.3.1 – PCR amplification, purification and sequencing ... 22
x
1.4 - Ancient samples ... 23
2.Results ... 24
2.1 – SNP Selection ... 24
2.2 – Primer design and PCR optimization ... 24
2.3 – Control Sample analysis ... 29
2.4 – Ancient samples ... 30
3.Discussion ... 32
IV. Chapter II - Iberian Human Population Structure: the European AIMs contribution ... 35
1. Material and Methods ... 35
1.1 – Samples ... 35
1.2 - SNP analysed and methodology ... 35
1.3 - Data analysis ... 36 1.3.1 - Intra-population analysis ... 36 1.3.2 – Inter-population analysis ... 36 2. Results ... 39 3. Discussion ... 45 V. Conclusions... 47 Bibliography ... 49
xi
Index of Figures
Figure 1 - DNA is a linear combination of four nucleotides, so when comparing two sequences position by position if there are different nucleotides at the same position we are in the present of a SNP [Chakravarti, 2001]. ... 4
Figure 2 - Some of the SNP typing methods used in scientific research. Some typing methods can divided itself on other more specific forms of typing and also differ themselves in the detection methods used [Sobrino et al., 2005; Kwok et al., 2003; Twyman, 2005; Costabile et al., 2006; Syvänen , 2001; Gundry et al., 2003; Liew et al., 2004; Twyman et al., 2003] ... 8
Figure 3 Map of the Iberian Peninsula, where is differentiated the area that corresponds to Spain (in blue) and the area that corresponds to Portugal (in orange) [INE, 2012b] ... 9
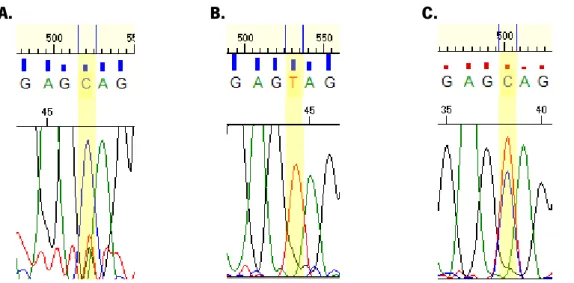
Figure 4 – Sequencing of three control samples for a specific region of one of the SNP study, on which it is possible to identify the three possible genotypes: CC (A); TT (B), CT (C) .... 30
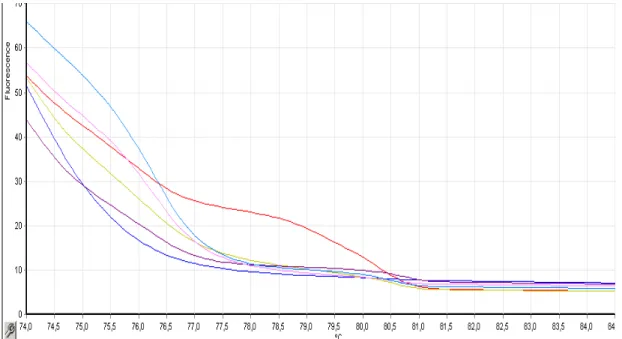
Figure 5 – HRM of three samples with distinct genotypes.: TT (blue), TC (violet) and CC (yellow). This graph allows the establishment of a pattern for each genotype for each SNP studied. ... 30
Figure 6 - HRM of samples from Bronze and Iron Age periods, which show positive amplifications. ... 31
Figure 7 - PCA of the studied populations and the comparison populations. Component 1 explains 49,32% of the variation and Component II explains 32,66%. ... 44
xii
Index of Tables
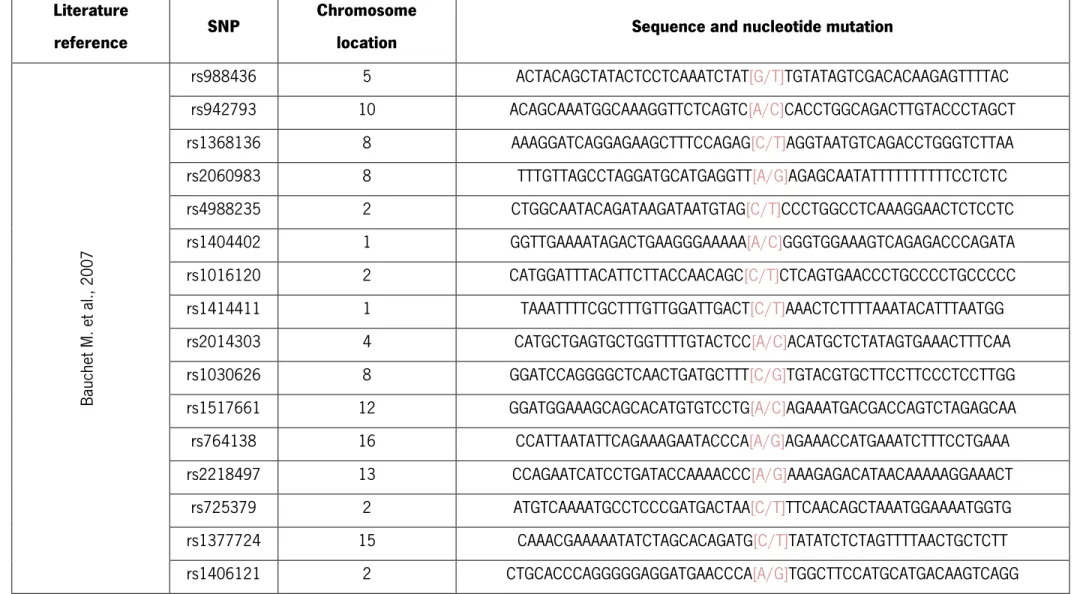
Table 1 - Description of the SNP chosen: chromosome location, sequence and nucleotide mutation ... 25
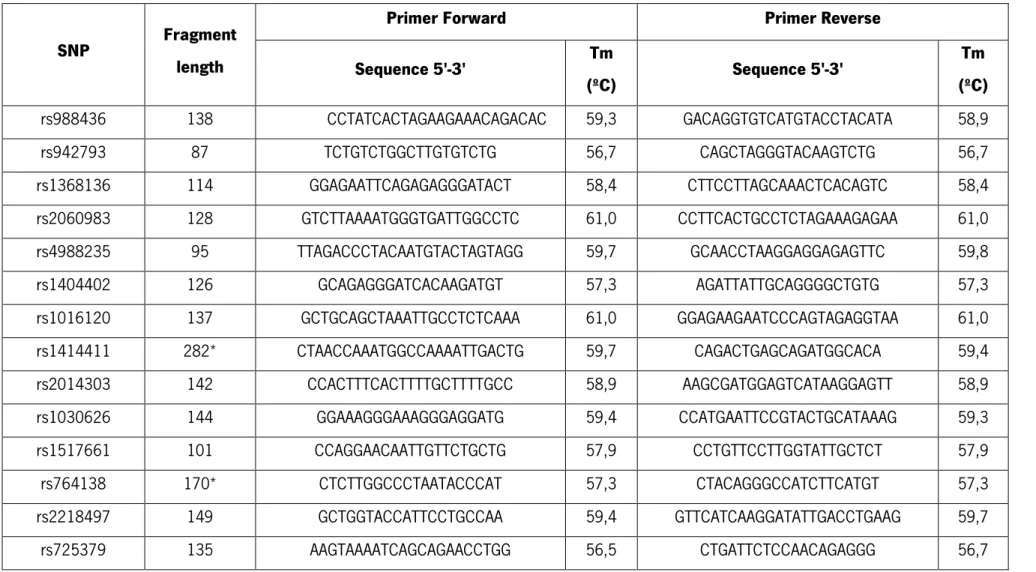
Table 2 - Primers designed to amplify specific regions, on which existed the SNP previously selected. All the primers obey to the specifications previously described. Melting temperatures (Tm) and fragment length for each pair of primers is also presented ... 27
Table 3 - Annealing temperature (Ta) for Polymerase Chain Reaction (PCR) and melting
temperature (Tm) for High Resolution Melting (HRM). ... 29
Table 4 – Number of samples analyzed taking in consideration the SNP and the population ... 35
Table 5 - Number of samples for each population used in population comparison taking in consideration the each SNP ... 37
Table 6 – Allelic frequency and genotypic frequency of the three studied populations regarding the SNP rs988436 ... 39
Table 7 - Allelic frequency and genotypic frequency of the three studied populations regarding the SNP rs1368136 ... 40
Table 8 - Allelic frequency and genotypic frequency of the three studied populations regarding the SNP rs4988235 ... 40
Table 9 - Hardy-Weinberg equilibrium probability values for the three SNP selected and for the studied populations. (*not significant after Bonferrroni correction) ... 40
Table 10 - Gene diversity values obtained for the three studied populations and for the populations used for comparison ... 43
1
I. Introduction
1.
Evolution and Diversity
During the ancient Greece there were already reports regarding inherited differences between humans [Vogel et al., 1997]. However, until the 20th century, the ultraconservative ideas
enacted by the Christian Religion prevailed. These ideas are derived by the philosophies of Plato and Aristotle, which attributed fixed and immutable characteristics to the species [Futuyma, 1998].
In the 19th century Charles Darwin formulates the theory of evolution [Griffiths et al.,
1993]. This theory assumes that the evolution of species is the result of different survival and reproduction rates of individuals’ variants that pre-existed in the group. Selection can eliminate some characters in a population, but cannot lead to new forms if they are not present in the original population. This contradiction was a serious impediment to explain the logic of evolution, which could not be accepted until the time that more knowledge about genetics and the processes that mediate the inheritance existed [Boyd et al., 2001]. The initial overcome for these contradictions took place in early 20th century, in the decades of 30 and 40, when the synthesis
of the modern theory of evolution was developed. This development was due to a combine work of people from different areas of the science, that atone the theory proposed by Darwin with genetic processes to demonstrate that natural populations are not uniform but there have many variants [Griffiths et al., 1993].
Diversity refers to differences between individuals of the same species. In the case of humans, they differ in thousands of ways. Even in a group of related people there is variation in height, weight, hair colour, eye colour, etc, which refers to changes in the phenotype of organisms. The levels of genetic diversity within populations are affected by the evolutionary forces, such as mutation, natural selection, genetic drift, gene flow and recombination [Boyd et al., 2001].
Although the rate of appearance of new mutations is low, mutation is the ultimate source of genetic variation, producing new alleles. So, without this process evolution wouldn’t exist [Raven et al., 2011]. Recombination is the production of new genetic combinations from the initially generated by the mutation, so the variation is increased even more [Boyd et al., 2001].
2
Natural selection removes variation from population by favouring one allele over other at a gene locus. However, in some circumstances, selection can do exactly the opposite and maintain population variation [Raven et al., 2011; Griffiths et al., 1993]. The modulating effect of natural selection on allelic frequencies, depend on whether a particular trait is favored or disadvantaged in a particular environment. Also, the speed of natural selection depends on the original allelic frequencies and values of fitness for each genotype [Griffiths et al., 1993].
Genetic drift causes random changes in allelic frequencies, for example, if two populations are isolated from each other, both change and, over time, might become genetically different [Griffiths et al., 1993].
While mutation, selection and genetic drift contribute to the differentiation between populations, gene flow acts in the opposite direction, in other words, migration make that over time, a mix of genes occurs, decreasing the differences between populations [Boyd et al., 2001]. All these evolutionary forces acting simultaneously over time, produce complex patterns of variation in allelic frequencies within a population and between different populations. In this sense, considering the recent human evolution, it is interesting to see the genetic changes that occur between different populations and identify the causes which produced such changes [Lewontin, 1974].
1.1- Human populations’ genetics
Population genetics describes the genetic variation, and determine how it changes over time and space, on a theoretical and experimental basis [Griffiths et al., 1993].
The traditional physical anthropology began to study the human variability in the 19th
century, consisting on the description of the human body, through its measurement [Amorim, 2007]. On 1900, Landsteiner published a short note commenting the agglutination of red cells of some patients by the serum of other patients [Landsteiner,1900], reaction which is now known to be the consequence of antibody and human blood cells interaction. In 1901, the same author published another study describing the human blood groups and revealed the polymorphisms on the phenotype blood system ABO [Landsteiner, 1901], thus becoming the first polymorphic genetic marker applied in humans [Owen, 2000; Cavalli-Sforza, 1996; Jobling et al., 2004] and opening a new era for anthropological studies. On 1917, Hirszfeld and Hirszfeld study the ABO phenotype proportions on different population and came to the conclusion that the frequencies
3
where different on all populations, what nowadays we know that each population show different frequencies not only on the polymorphism ABO but practically in all other genetic polymorphic marker studied [Cavalli-Sforza, 1996; Cavalli-Sforza et al., 2003]. Subsequent analysis of proteins [Pauling et al., 1949; Lewis et al., 1958] enabled the analysis of a large number of genes, where the first results show a higher diversity than expected in the human population, with a large genetic variation within populations (≈85%) and only a small part (≈15%) attributable to differences between populations [Lewontin, 1967, 1972, 1974]. However, protein based genetic was limited due to the low discrimination power of the system [Budowle et al., 2008]. From this moment on, genetic markers become a valuable tool for anthropology, as long as they meet a number of characteristics: to be monophyletic, neutral, permit to establish a direct relationship between antecessor and offspring without the distortion of environmental adaptations and allowing comparisons of interpopulation variability [Susanne et al., 2007]. Finally, the direct analysis of DNA became possible, thanks to advances in techniques such as polymerase chain reaction [Saiki et al., 1985]. Since then, the knowledge on genetic markers have progressed and nowadays the most important markers are based on polymorphisms at the DNA, which have fewer limitations against, for example, the use of proteins [Budowle et al., 2008]. The most common forms of polymorphism used are: restriction length fragment polymorphism (RFLP), minisatellites (Variable Number of Tandem Repeats – VNTR), microsatellites (Short Tandem Repeats - STRs) and single nucleotide polymorphism (SNP) [Budowle et al., 2008; Griffiths et al., 1993].
1.2- Single nucleotide polymorphism (SNP)
A Single Nucleotide Polymorphism (SNP) is a site at which individuals differ by only a single nucleotide and the minority of the variant must have a frequency greater than 1% (fig. 1) [Raven et al., 2011]. This kind of polymorphism is the most common form of variation in the human genome [Sobrino et al., 2005]; and according to the dsSNP database on NCBI the number of SNP already identified on the human genome is 60,560,048 SNPs [NCBI, 2013]. Thus, due to its abundance, they can be useful as genetic markers for numerous genetic applications [Zhao et al., 2000], for examples to search for mutation associated with specific genetic diseases [Scherer, 2008].
4
SNP reflect past mutations that were probably unique events and two individuals sharing an allelic variant are marked with a common evolutionary heritage. In other words, our genes have ancestors and analyzing shared patterns of SNP variation can give insights on the origin of individuals [Stoneking, 2001]. Thus, the study of this variability allows us to infer the history of human evolution and patterns of migration of populations [Quintáns et al., 2003].
On the forensic level, the use of SNP is still on an experiment phase. However, comparing to short tandem repeats (STR) which are now used routinely, SNP have a lower mutation rate (10-8 vs. 10-3), the recovery of information from degraded DNA samples is in theory
possible, due to the fact that a smaller target region is needed to SNP typing, and SNP profiling avoids stutter artefacts that complicate STR profile interpretation [Butler et al., 2007; Kayser et al., 2011]. On the other hand, SNP aren’t as polymorphic as STR and more SNPs are required to reach equivalent powers of discrimination or random match probabilities [Butler et al., 2007].
On a forensic perspective, SNPs can be divided into different categories as: identity-testing SNPs, lineage informative SNPs, phenotype informative SNPs and ancestry informative SNPs [Budowle et al., 2008]. Weir’s unbiased (FST)
Identify-testing SNPs provide genetic information to differentiate people and thus exclude individuals that cannot be the source of an evidentiary sample or cannot be a putative member. The best SNPs for identity testing are those that have the highest heterozygosity and low Weir’s unbiased (FST) levels, because fewer SNPs will be needed to reach high levels of power of
Figure 1 - DNA is a linear combination of four nucleotides, so when comparing two sequences position by position if there are different nucleotides at the same position we are in the present of a SNP [Chakravarti, 2001].
5
discrimination and fewer reference population databases will be required for statistical assessments for forensic casework [Budowle et al., 2008]. A study conducted by Kidd and collaborators shows the efforts and selection criteria necessary to develop the most useful identify-testing SNP panels [Kidd et al., 2006].
Lineage informative SNPs have been identified on the mtDNA genome and Y chromosome, due to the lack of recombination, these SNPs have been quite informative for evolutionary studies and kinship analysis [Budowle et al., 2008]. The most likely use for this class of SNP is for missing cases or mass disaster identification [Budowle et al., 2008; Kayser et al., 2011].
Phenotype informative SNPs are used to established high probability that an individual has a particular phenotypic characteristic, such as skin colour, hair colour and morphology, eye colour or stature [Budowle et al., 2008; Kayser et al., 2011]. Of all the traits studies, eye colour is the most accurately predictable and actually there are a system named IrisPlex that allows predicting eye colour [Kayser et al., 2011].
Ancestry informative SNPs are used to establish high probability of an individual’s biogeographical ancestry and to indirectly infer some phenotypic characteristics. It is expected that there will be many forensic cases where this markers will be useful for guiding the police for find unknown persons or victims [Kayser et al., 2011; Phillips et al., 2009; Gu Y., 2011]. Already a small set of autosomal ancestry-informative DNA markers have been developed for DNA base inference of biogeographic ancestry at the level of continental resolution, and in this sense continental biogeographic ancestry may be used carefully in some cases to get a general idea about a person’s appearance, but this only be applied to individuals whose ancestors come from a single continental region as can be established with DNA-based ancestry testing [Kayser et al., 2011].
1.3- Ancestry informative markers (AIMs)
Ancestry informative markers (AIMs) are SNPs distributed throughout the human genome, used to establish the probability of an individual biogeographical ancestry, since they occur at different frequencies in different world populations [Budowle et al., 2008; Gu et al., 2011].
6
A form of studying ancestry is by studying biogeography ancestry, in which’s person origin is associated with the geographic location of presumed ancestors inferred by comparison with contemporary populations living in that locations [Royal et al., 2010]. The “Malthusian parameter of ascent” combined with the fact that our specie is relatively young and that our ancestors arrived in various regions of the world, explains the globally complex and mosaic-like landscape of genetic clusters, which strongly influences DNA-based inference of biogeography ancestry [Kayser et al., 2011].
Inference of individual ancestry from genetic markers is helpful in diverse situations, including admixture and association mapping, forensics, prediction of medical risks, wildlife management, studies of dispersal, gene flow and evolutionary history and to confirm genome-wide association studies (GWAS) [Rosenberg et al., 2003; Nassir et al., 2009].
Inference of genetic ancestry is applied to individuals and is based on the analysis of a large collections of ancestry informative markers [Royal et al., 2010], which have attracted quite attention due to their implication in different areas of genetics [Drineas et al., 2010].
AIMs that show large frequency differences among intercontinental groups can be used to detect and correct stratification within the populations [Bauchet et al., 2007]..
1.4- Typing methodologies
The SNP genotyping can be divided into different methods, which can be carried out using different specific techniques. Some of this methods and techniques are presented in figure 2.
Among the different methods, the one chosen and applied in this study was High Resolution Melting (HRM), which relies on the analysis of DNA melting and resulted from the collaboration between academics and industry and was introduced on scientific field in 2002 [QIAGEN®, 2009; Reed et al., 2007]. This technique characterizes the DNA samples according to their dissociation behaviour as they transition from double stranded DNA (dsDNA) to single-stranded DNA (ssDNA) with increasing temperature. Before the HRM, the target sequence must be amplified to a high-copy number in the presence of a dsDNA-binding fluorescent dye (EvaGreen), which actively binds to the dsDNA and fluoresces brightly when bounds. The change in fluorescence can be used to measure the increase in DNA concentration during PCR and then to directly measure thermally-induced DNA melting by HRM. To perform the HRM analysis, the
7
temperature is increased and the fluorescence of the dye will be measured continuously, leading to a plot against the temperature [QIAGEN®, 2009]. This difference of Tm between samples will allow to differentiate samples as homozygous or heterozygous [Gundry et al., 2003; Liew, et al., 2004]. This technique is simple, easier, rapid, inexpensive and above all is a closed-tube system which prevents contamination with PCR products; on the other hand, depends strongly on a good PCR, instruments and dyes [QIAGEN®, 2009; Wittwer, 2009; Reed et al., 2007].
8
SNP Typing
Allele specifc hibridization
Homogeneous hybridization using fret
LightCycler® (Roche)
5'exonuclease activity: TaqMan® Assay (Applied
Biosystems) Array hibridization and
fluorescence detection Allele specific oligonucleotide
ligation Invasive cleveage Primer extension Pyrosequencing Allele-specific extension Minisequencing MALDI-TOF MS Fluorescence polarization Electrophoresis and fluorescence detection: SNaPshot™ (Applied Biosystems) High Resoution Melting
(HRM)
Sequencing
Single strand conformation polymorphism (SSCP)
Denaturing High-Performance Liquid Chromatography (DHPLC)
Gradient Gel Electrophoresis
Conformation-Sensitive(CSGE)
Temperature (TGGE)
Denaturing(DGGE)
Figure 2 - Some of the SNP typing methods used in scientific research. Some typing methods can divided itself on other more specific forms of typing and also differ themselves in the detection methods used [Sobrino et al., 2005; Kwok et al., 2003; Twyman, 2005; Costabile et al., 2006; Syvänen , 2001; Gundry et al., 2003; Liew et al., 2004; Twyman et al., 2003]
9
2. Iberian Peninsula: Geographical and Historical Considerations
2.1 - Iberian Peninsula
The Iberian Peninsula is situated in the southwest of Europe and it is formed by five different countries: Portugal, Spain, Gibraltar (which is under the United Kingdom domain), Andorra and a very small part France (western and northern slopes of the Pyrenean) (figure 3). However, when the term Iberian Peninsula is used, most of the times it just refers to Portugal and Spain. On this work, when it refer to the Iberian Peninsula is regarding only to Portugal and Spain.
The Iberian Peninsula has a surface of 598,081 km2 [INE, 2012a] and a population of
56,596,729 inhabitants [INE, 2012b].
The history of Spain and Portugal has always been connected, because for many centuries there wasn’t any distinction between the two countries, and the Iberian Peninsula was seen as one geographic entity.
Figure 3 Map of the Iberian Peninsula, where is differentiated the area that corresponds to Spain (in blue) and the area that corresponds to Portugal (in orange) [INE, 2012b]
10
The occupation of the Peninsula by modern humans began 35,000 years ago with settlements in the north and east of the Peninsula. During the period of the last glaciations maxim the human populations were confined to shelters located in Southern Europe, mainly occupying the northern part of the Iberian Peninsula. When this Ice Age ended the re-colonization of Europe began from the southern refuges [Stone, 1990].
The Neolithic period began approximately 7,000 years ago and is characterized by the development of agriculture and livestock. In Europe the first societies appeared in the European south-east between 7,000 b.C and 5,000 b.C., in the central and west Mediterranean from before 6,000 b.C, in central Europe before 5500 b.C and finally in the north-west of Europe before 4,000 b.C. [Ammerman et al., 1984; Whittle, 1996; Chikhi et al., 1998]. To explain this transition, there are two hypotheses: first, called demic diffusion model, that involves the movement of a large human contingent that colonize Europe by displacing or absorbing the European Paleolithic inhabitants, which predicts a major effect on the European gene pool [Semino et al., 1996; Cavalli-Sforza et al., 1997; Quintana-Murci et al., 1999; Simoni et al., 2000; Chikhi et al., 2002; Richards et al., 1996] and the second, called cultural diffusion model, which argues that the transition to agriculture occurred without large movements of populations and without changes in the genetic makeup of the pre-existing populations [Whittle, 1996; Semino et al., 1996; Richards et al., 1996].
In the Bronze Age and Iron Age, there were already several populations settled in the Peninsula: the tartessos, heirs of the megalithic culture and that occupied the south-west of the Peninsula; the iberians, a mix of different populations that extend through the eastern region of the Peninsula; and the celtiberians, people from the celtic culture that arrive in the 13th century
a.C. and occupies a broad area of the plateau, reaching the western end when the Iberian tribes occupied the Ebro Valley [Burillo, 2007].
From all this populations, one of the most important in the Peninsula was the Iberians. The called Iberian culture existed from 600 b.C. until 60 a.C., and was characterized by the forms of life of the indigenes societies, enriched by the Greek and Phoenician culture. The called iberos were religious and offered sacrifices to the divinities, develop a consistent economy of agricultural, boosted the exportation of textile crafts, and in 4th a.C. invented their own system of
writing [Sobrequés i Callicó 2010; Arribas 1971].
On the 10th century b.C, occurred the first settlement of the first Mediterranean nation:
11
commercial nature [Mata, 2002]. The Phoenicians were followed by the Greeks, which were powerful agents of culturalization which lead to the emergence of the Iberian world [Sobrequés i Callicó 2010], the Carthaginians and finally the Romans on the 3th century b.C, that occupied all
the Peninsula [Mira, 2000]. The presence of the Roman Empire in the Peninsula was due to the fact that the Greeks, threatened by the Carthaginians, asked Rome for help, which lead to the beginning of their presence in 218 b.C. in Ampurias [Sobrequés i Callicó, 2010].
Between 218 a.C. and 4th century the called Hispanias, name given to the Peninsula by
the Romans, were under the Roman domain. The military conquest was followed by a colonizing action that changed the history of the Peninsula. On one hand, the Romanization led to the lost of personality that characterized the indigenous people and have marked the collective identity until today, on the other hand led to the organization of new cities, create a plan of ordering of the Hispania and construct the first network of communication between the different cities [Sobrequés i Callicó, 2010; Tovar et al., 1982].
On the 3th century, the Roman Empire entered in an external and internal crisis and
above all, the barbarians started to force the borders of the empire [Tovar et al., 1982; Sobrequés i Callicó, 2010]. The entry of Germanics caused a sudden change in the social and political aspect. This entrance was divided in two phases: the first consisted on Vandals, Alans and Swabians. This last one settled in the northwest of the Peninsula and was the one that achieved greater social and political organization. On a second phase the Visigoths arrived expelling the other Germanic populations on the Peninsula, except the Swabians, nevertheless they were conquered and absorbed by the Visigoth kingdom on the sixth century. The end of the Visigothic period took place at the early eighth century when the peninsula was invaded by Arabs and Berbers from North Africa [Garcia, 1989; Sobrequés i Callicó, 2010].
Islamic domain lasted in the Peninsula for seven centuries, receiving the conquered territory the name of Al-Andalus, during which population from the North Africa transited to the peninsula at different stages [Camps, 1996].
The formation of two sovereign states on the Peninsula occurred due to the need of administrative organization of Leon and Castile, at 1139 the Kingdom of Portugal was established and it borders became definitively established in 1249 [Reilly, 1992].
Later then, the territory known as Al-Andalus began to decrease in extension, due to the successive conquests of the Northern Christian kingdoms. In 1492, the last muslin bastion,
12
Granada, was conquered by the Cristian kingdoms, completing the conquest of the Iberian Peninsula [Quesada, 1989].
The remaining minorities, Jewish and Moorish, that existed in the peninsula suffered a similar end. The Sephardic Jews that did not convert to Catholicism were expelled from the kingdoms of Castile and Aragon in July of 1492 [Quesada, 1989] and although at first they took refuge in Portugal they were later forced to leave this territory in the year 1497 [Stone, 1990]. On the other hand, the Moorish were forced to be baptized in 1502, in an attempt to achieve their integration, however they were banished in 1609 after different conflicts with the Christian population throughout the fifteenth century. Nevertheless the population that choose to converse suffer some problems to integrate in the Christian society [Quesada, 1989].
Ending the Middle Age, all the countries from the occident lived a period of crisis. First, in 1333 a crisis of subsistence, then in 1348 the Black Death took place, with relapses in 1362, 1363 and 1371, which led to a considerable diminution of the population [Sobrequés i Callicó, 2010].
2.1.1 - Catalonia
Catalonia is an autonomous community located on the northeast of the Peninsula, and administratively is divided in four provinces: Barcelona, Gerona, Tarragona and Lérida. The community appears surrounded by France and Andorra on the north, the Mediterranean Sea on the east, at south by the Valencia Community and west by Aragon Community. Cataluña has a surface of 32,091 km2 and a population of 7,539,618 inhabitants [INE, 2012a].
On 600 b.C., the Greeks create the first colony on the catalan Mediterranean coast, named Emporias (Ampurias), which meant market. In a few years, what began like a small market was then a consolidated urban structure. After the Greeks occupation, existed the Roman Empire, which ruling was retarded in Catalonia by the Iberos, starting only in 195 a.C. after a long battle [Sobrequés i Callicó, 2010].
The Muslim Berbers, coming from the North of Africa, started the occupation of the Catalan territory between 713 and 720, until 1148-1149 when the state of Catalonia was finally recaptured by the Count of Barcelona Ramón Berenguer IV. The beginning of the recaptured of the capital territory was due to the sovereign Carolingian, which ruled from the other side of the
13
Pyrenees, but in the beginning of the 9th century, the counds started to become independent
[Reilly, 1992].
This way, during the 11th century are configured the traits that characterized a national
reality, in other words, a common origin, a land, an economical and structured social life defined, a community that expresses themselves in the same language but above all, a knowlodgment by the people of this fact. On the 12th century, the terms “Catalan” and “Catalonia” were already
used to nominate the people and land ruled by the Count Ramón Berenguer III [Reilly, 1992]. After this period, Catalonia was during some centuries a region that passed from kingdom to kingdom or even try to have their own independence, which was always attack by other kingdoms. During the 18th and 19th century, the distinct governments of Spain dismantled
what was left of the state of Catalonia and tried to erase their characteristics traits [Sobrequés i Callicó, 2010]].
Between 1609 and 1610, around five thousands Catalans Moriscos, namely, ancient Muslims that were forced to convert, left towards Africa, due to the religious intolerance that was lived in the peninsula [Sobrequés i Callicó, 2010].
The autonomy of Catalonia was only approved in 1932, but in 1936 there was still some competence under de power of the government. This ended with the military rebellion on 1936, which led to the civil war of 1936-1939. During the dictatorship, the creation of new industries in Catalonia led people to migrate to Catalonia, leaving regions more undeveloped. The dictatorship led many Catalan to run to France, although their situation deteriorates with the German occupation of France. The general Franco had a special attention on constrain any show of Catalonia (language and symbols) [Sobrequés i Callicó, 2010].
2.1.2 - Andalucía
Andalucía is an autonomous community located on the south of the Peninsula, and it is composed by eight provinces: Huelva, Cadiz, Seville, Córdoba, Malaga, Jaen, Almeria and Granada. The community appears surrounded by west to east by Portugal, Extremadura Community, Castilla-La Mancha Community and Murcia Community, at south by the Mediterranean Sea and the Atlantic Ocean [INE, 2012a].
Around 1000 b.C. the Phoenicians, Greeks and Carthaginians settled on the area of Andalusia. In the sixth century b.C., the Roman Empire nicknamed the area as Andalusia, and
14
during this time the region was rich due to the exportations of wine and olive oil [Tovar et al., 1982; Moreno, 2001].
After the invasions of the Vandals and the Visigoths, the Muslims from the North of Africa invaded Andalusia in 711 a.C. The Muslim presence lasted for eight centuries and left an important and still visible mark in the population and in the culture of Andalusia. The Muslims established an Emirate in Andalusia, with his capital in Cordoba, which then became independent from Damascus. This period represents one of the most flourishing moments of Andalusia, with great social, cultural and economic prosperity [Reilly, 1992; Gill et al., 2008].
On the 11th century, the caliphate became weakened by civil wars, ending in the
conquest of the area by the Catholic kings, ending the conquest of Granada in 1492. The current territory of Andalusia just appeared after the War of Alpujarras (1570-1572), when happened the expulsion of all muslims from the region [Reilly, 1992; Gill et al., 2008].
After centuries of splendor lived in Andalusia, the golden period ended which led to the fall of what was an important region of Spain. In 1980, Andalusia acquired it own autonomy and began a slow recovery that latest until today. Andalusia is one of the communities of Spain with the higher unemployment rate, which have create a great amount of emigration, however the region is still looked for by the tourists due to the his important cultural history [Gill et al., 2008; Moreno, 2001].
2.1.3 - Zamora
The province of Zamora is located at the north western edge of the Central Plateau, in the autonomous community of Castile and Leon. The province appears confined to the north by Leon, east of Valladolid, Salamanca on the south, and at west by the province of Orense and Portugal. Zamora has a surface of 10,561 km2 and a population of 193,383 inhabitants [INE,
2012a].
In the 3th century b.C, when the Roman Empire enter the Peninsula, in the province of
Zamora coexisted three types of celtiberians: the vetones [Bosch, 2003]; the vacceos, that are considered the first stable population settled on the area [Wattenberg, 1959]; and the astures, that were the lasts one to the annexed to the Roman Empire [Bosch, 2003].
On the 5th century, with the fall of the Roman Empire the Germanic population enters the
15
on the occidental area and the vandalos occupied the rest of the province [Garcia, 1989]. This territorial distribution existed until the entry of the Visigoths, that first occupy the held territory of vandalos, and just in the end of the 5th century the Visigoths although took the area occupied by
the suevos [Barbero et al., 1974].
On the beginning of the 8th century, with the entrance of the Muslims, Zamora was only
used by them to control the trims and the forts used since the Roman Empire to defend themselves from the north population. Taking advantage of this situation, Alfonso I the Asturias invaded different cities, as Zamora, killing the muslim population and took the Christians to repopulate the Cantabria mountain and the coast zone of Galicia [Barbero et al., 1974]. These factors led to the lack of human settlements in de Douro line, acting this way as a frontier between the Astur kingdom and the muslim Kingdom [Menendez, 1960; García, 1982].
During the next three centuries (9th to 11th) Zamora was definitively annexed to the
kingdom of Asturias, in two different stages. During these stages, Zamora suffered different immigration flows, composed by mozárabs from al-Andalus, population coming from Asturias, Leon and Galicia on a first stage; and on a second stage, once again, the mozarabs from al-Andalus, population coming from Asturias, Leon and Galicia, but as well jews from al-Andalus and settlers from France [Lorenzo, 1995].
During the 20th century, Zamora have lost almost a third of its population by different
factors: high mortality caused by a flu pandemic, mortality and movements due to the civil war, and the increase of emigration to industrial areas due to the lack of progress, what led to the marginalization of the province until today [Redondo et al., 1995]. All this populations lost didn’t occur in an uniform way through the province, being affected the areas that possessed less resources.
16
2.2 - Genetic Diversity and Structure of the Iberian Peninsula
As explained previously, over the millenniums, the Iberian Peninsula has been influenced by multiples cultures and people of different origins, which configure it present day genetic architecture.
The first studies within the Iberia Peninsula have shown that, in terms of nuclear gene frequencies, blood groups and enzyme polymorphisms, the Basques are differentiated from neighbouring populations [Bertranpetit et al., 1991]. This has contributed to the ongoing debate on the origin of this isolated population with its linguistic and social distinctions. In accordance, analysis of monoparental genetic markers, the Y-chromosome and mitochondrial DNA, reveal that the Iberian Peninsula reflects a homogenous background, except in some areas like the Basque Country, Pyrenees and South of Portugal [Arroyo-Pardo et al. 2007; Pino-Yanes et al., 2011].
The Y-chromosome is characterized by high levels of haplogroup R1*(xR1a) and lower levels of haplogroups I*-M170, J*-12f2.1 and E*-M35 [Gonçalves et al., 2005; Arroyo-Pardo et al. 2007]. The haplogroups R1* and I* are linked to the Palaeolithic and show the highest frequencies in the Northeast of the Iberian Peninsula, the Basque Country and the Pyrenean populations [Arroyo-Pardo et al. 2007]. The distribution of the African haplogroups is highly variable across the Iberian Peninsula. For example, high frequencies of haplogroup E3b1* have been explained as the result of recent gene flow due to the long-term Islamic occupation of the peninsula, yet the presence of the haplogroup E-M81 in the North of the Peninsula is difficult to explain because the historical background does not support the presence of African individuals on that region. The presence of haplogroup E-M81 has been explained as consequence of prehistoric links between Iberians and North Africans, according to mtDNA analysis [Arroyo-Pardo et al., 2007].
Adams and collaborators [Adams et.al, 2008], using Y-STR haplotypes and admixture analysis showed the presence of high mean levels of admixture on North African and Sephardic Jews patrilineal ancestry in modern Iberian Peninsula population, 10.6% and 19.8%, respectively. This admixture is also showed in a study conducted by Nogueiro and collaborators [Nogueiro et al., 2010], on which analyzed Y-SNP and Y-STR and unveiled that Jew population from Trás-os-Montes (NE of Portugal) show high frequency of haplogroup R1b1b2, which is less frequent in other Jewish populations, indicating a significant level of admixture with non-Jews Iberian populations. This Jew population also showed high frequency of haplogroups T and J, which are
17
uncommon to Portuguese population, yet it reflects their origin in Middle East [Nogueiro et al., 2010].
The mtDNA of the Iberian populations indicates a Palaeolithic origin with a minor Neolithic contribution. Preliminary mtDNA studies showed that the Iberians are different from the rest of the Europeans under genetic diversity, having present unique lineage groups, like the Basque country and Catalonia, and also showed evidence of geographical subdivision. The Peninsula exhibits relatively higher proportion of lineages of African origin, especially haplogroups U6, L3, M1, L1b and L2, which has been interpreted either as a pre-historic African colonization or as historical migrations from Africa [Arroyo-Pardo et al., 2007; Alvarez et al., 2010]. Ruling out the Islamic occupation and the slave trade, no historical migrations are considered to have influenced the mtDNA gene pool of the Iberian Peninsula [Arroyo-Pardo et al., 2007]. Nevertheless the Iberians share the majority of their haplotypes with the Europeans (haplogroups H, U, J, T, W and X) [Arroyo-Pardo et al., 2007; Corte-Real et al., 1996].
Concerning more recent studies [Moorjani et al., 2011] based on genome-wide data, results indicate that the highest proportion of African ancestry in Europe is observed in the Iberian Peninsula, with values of 3,2±0,3% in Portugal and 2,4±0,3% in Spain; which are consistent with the inferences based on Y-chromosome and mtDNA that showed that that within Europe the Southwestern Europeans have the highest haplotype-sharing with Africans [Moorjani et al., 2011; Pino-Yanes et al., 2011].
A study conducted by Gayán and collaborators [Gayán et al., 2010], at which 262,264 SNP were genotyped using Affymetrix NspI 250K chip on the Spanish population, showed that this population is largely homogeneous within itself. However, patterns of micro-structure may be able to predict locations of origin from distant regions. Data obtained allow to differentiate between the two most apart geographically centers [Gayán et al., 2010], which corresponds to a south to north-east axis, which is in line with a south-west to north-east axis previously found in European populations [Seldin et al., 2006; Bauchet et al., 2007; Tian et al., 2008; Novembre et al., 2008; Tian et al., 2009].
19
II. Aims
The overall aim of this work is to study at what degree European AIMs can be applied in microgeographic differentiation. In this sense, the working line was divided into two steps, which forms in this dissertation two chapters.
The aims of chapter I - Primer design and validation for analysis of European AIMs, are: 1) To select a set of SNP that would allow characterizing and differentiating the populations of the Iberian Peninsula;
2) To design primers to amplify the regions encompassing the selected SNPs and that can be used to HRM methodology;
3) To obtain the three possible genotypes to each SNP, which would be helpful as controls ahead.
The aim of chapter II is to preliminarily genetically characterize different Iberian populations, namely, Catalonia, Andalucia and Zamora, using some of the selected SNPs.
21
III. Chapter I - Primer design and validation for analysis of European
AIMs
1. Material and methods
1.1 - SNP selection
The SNP selection was based on the historical background of the Iberian Peninsula. In this sense, there were considered some articles that mentioned the existence of an northern-southeastern axis that shows substructure in Europe [Seldin et al., 2006; Bauchet et al., 2007; Tian et al., 2008; Novembre et al., 2008; Tian et al., 2009; Gayán et al., 2010]. Moreover, it was considered the genetic contribution of the Sephardi Jews, as their presence was longstanding, with some evidence of their presence predated the Christian era, yet it is believed that many Jews arrived during the Roman Period, as slaves or voluntarily and later due to the Islamic invasion of their homelands in the Near East [Adams et al., 2008].
1.2 - Primer design for HRM
Primer design was performed using the ApE-A Plasmid Editor v1.16 and the Primer Designer version 1.01 software. In order to have a good resolution at the HRM analysis, the criteria used in primer design were: the melting temperature (Tm) must be at least 56ºC, the
difference of Tm of primers to each SNP can’t be higher than 1ºC, the content of CG must be
between 40% and 60% and the PCR product should have between 70 and 150 base pairs. To check to the formation of primer-dimers and hairpin structures the Windows32 Primer select 4.05 from DNASTAR package was used. The melting temperature of the primers was adjusted using the Eurofins MWG Operon PCR & Sequencing Primer Tool (http://ecom.mwgdna.com). Finally, to ensure the target region to amplify, the primers were submitted to an In-Silico PCR at the UCSC (University of California, Santa Cruz) (http://genome.ucsc.edu/cgi-bin/hgPcr).
22 1.3 - Control Samples
A set of 30 random samples of DNA from human populations from the Iberia Peninsula were amplified, purified and automated sequenced in order to obtain samples with a know genotype that would be further used as control samples in HRM typing experiments. Subsequently, a HRM was performed in order to establish the melting curves and temperatures for which genotype and SNP.
1.3.1 – PCR amplification, purification and sequencing
The PCR mix for each sample consisted of 17 µL of water, 1 µL of 10 pmol of primer forward plus 1 µL of 10 pmol of primer reverse, 2.5 µL of 10x NH4 Reaction Buffer, 1 µL of
50mM MgCl2 solution, 0.25 µL of 100mM DNTPs, 0.25 µL of 5u/µL TaqDNA polymerase and 2
µL of DNA, totalling a final volume of 25 µL.
The PCRs were performed in a Primus 96 plus thermocycler and the amplification program consisted of an initial denaturation step of 5 minutes at 95ºC, followed by 35 cycles of PCR [30s at 95ºC, 30s at annealing temperature (Ta) and 45s at 72ºC], and a final extension
step of 5min at 72ºC. The PCR amplification results were visualized by electrophoresis in agarose gels (2%).
PCR products were purified using the JETQUICK Spin Column Technique (Genomed), according to the protocol provided by the supplier. The samples were then sequenced using the BigDye® Terminator v3.1 kit. The sequence reaction was performed according to the manufacture specifications and were further purified using an EDTA/Ethanol protocol according to the recommendations available in the BigDye® Terminator v3.1 Cycle Sequencing Kit Protocol. The sequence electrophoresis was run in an ABI 3130XL sequencer at the Servei de Genòmica, Universitat Autònoma de Barcelona.
Sequence quality was analyzed using the Sequence Scanner v1.0 (Applied Biosystems). The alignment of the obtained sequences was performed using the BioEdit sequence alignment editor [Hall, 1999].
23
1.3.2 - Analysis by High Resolution Melting (HRM)
The PCR reaction mix for each sample consisted of 5 µL of 2x HRM PCR Master Mix, which consists on HotStarTaq Plus DNA polymerase, Type-it HRM PCR Buffer, EvaGreen, Q-Solution, dNTP mix; 0.35 µL of 10 pmol of primer forward plus 0,35 µL of 10 pmol of primer reverse; 3.3 µL of RNase-free water; and 1 µL of DNA, making up a final volume of 10 µL. The samples were then introduced in Rotor-Gene Q, a QIAGEN’S real-time PCR cycler, following the protocol of Quiagen for HRM analysis of SNPs, which consist on a initial PCR activation step for 5min at 95ºC, followed by 40 cycles of a two step cycling [first step is to denature for 10s at 95ºC; the second step is annealing/extension for 30s at 55ºC, during which it is necessary to activate fluorescence data acquisition on the green channel], and finally the step of HRM for 2s with the ramp of temperatures from 65ºC to 95ºC with 0.1ºC increments, during which there is fluorescence data acquisition.
It is recommended that after determining the Tm for each sequence, the subsequent HRM
may be run between 5ºC below the Tm to above 5ºC the Tm, which may reduce the time needed
for analysis.
1.4 - Ancient samples
A set of six ancient DNA samples were analyzed by HRM using the primers and conditions optimized with modern samples.
24
2.
Results
2.1 – SNP Selection
The selection of SNPs was done based on the available literature, ending on a total of twenty-six SNP chosen (table 1). Twenty-one SNPs were chosen from the paper of Bauchet and collaborators [Bauchet et al., 2007] and five SNPs from the article of Raskin and collaborators [Raskin et al. 2008].
From the study of Bauchet and collaborators [Bauchet M. et al., 2007], the twenty-one SNPs selected were chosen from a full set of 1200 European AIMs (EuroAIMs). The selected SNPs presented the highest FST values between the northern and southeastern European
populations.
From the article of Raskin and collaborators [Raskin L. et al., 2008], five SNPs which allows to differentiate Sephardi Jewish populations were chosen.
2.2 – Primer design and PCR optimization
A total of twenty-six primer pairs were designed, according to the specifications for HRM PCR primer design (table 2).
During primer design some major problems were found because the pair of primers to each SNP shouldn’t differ more that 1ºC in Tm and the PCR product should had a size between 70bp and 150bp. Moreover, the formation of primer-dimers and hairpins represent another challenge, since some primers pairs followed all the other specifications but failed by leading to the formation of primer-dimers and hairpins.
The primer pairs obtained were submitted to in-Silico PCR to ensure that the region amplified was the desired region. All the pair primer amplified only the region for which the primers were designed, leading only to the amplification of the target region.
25
Table 1 - Description of the SNP chosen: chromosome location, sequence and nucleotide mutation
Literature
reference SNP
Chromosome
location Sequence and nucleotide mutation
B au ch et M . e t a l., 2 00 7 rs988436 5 ACTACAGCTATACTCCTCAAATCTAT[G/T]TGTATAGTCGACACAAGAGTTTTAC
rs942793 10 ACAGCAAATGGCAAAGGTTCTCAGTC[A/C]CACCTGGCAGACTTGTACCCTAGCT
rs1368136 8 AAAGGATCAGGAGAAGCTTTCCAGAG[C/T]AGGTAATGTCAGACCTGGGTCTTAA
rs2060983 8 TTTGTTAGCCTAGGATGCATGAGGTT[A/G]AGAGCAATATTTTTTTTTTCCTCTC
rs4988235 2 CTGGCAATACAGATAAGATAATGTAG[C/T]CCCTGGCCTCAAAGGAACTCTCCTC
rs1404402 1 GGTTGAAAATAGACTGAAGGGAAAAA[A/C]GGGTGGAAAGTCAGAGACCCAGATA
rs1016120 2 CATGGATTTACATTCTTACCAACAGC[C/T]CTCAGTGAACCCTGCCCCTGCCCCC
rs1414411 1 TAAATTTTCGCTTTGTTGGATTGACT[C/T]AAACTCTTTTAAATACATTTAATGG
rs2014303 4 CATGCTGAGTGCTGGTTTTGTACTCC[A/C]ACATGCTCTATAGTGAAACTTTCAA
rs1030626 8 GGATCCAGGGGCTCAACTGATGCTTT[C/G]TGTACGTGCTTCCTTCCCTCCTTGG
rs1517661 12 GGATGGAAAGCAGCACATGTGTCCTG[A/C]AGAAATGACGACCAGTCTAGAGCAA
rs764138 16 CCATTAATATTCAGAAAGAATACCCA[A/G]AGAAACCATGAAATCTTTCCTGAAA
rs2218497 13 CCAGAATCATCCTGATACCAAAACCC[A/G]AAAGAGACATAACAAAAAGGAAACT
rs725379 2 ATGTCAAAATGCCTCCCGATGACTAA[C/T]TTCAACAGCTAAATGGAAAATGGTG
rs1377724 15 CAAACGAAAAATATCTAGCACAGATG[C/T]TATATCTCTAGTTTTAACTGCTCTT
26
rs869538 4 GGACTGGAGCCCTTGGCTTCTGATAT[A/G]GCATAATACCAAGAAGACAATTTCT
rs1905471 13 GTTCACTTCAGGCATCCTTCCCTTAC[A/C]AGCTGAATGTCCCTAGGAGATCATA
rs764681 16 ATCTCGGACATAGGCTTAGCAATCTG[C/T]AGTTTCACCCCTCGCCAGGTAATTC
rs1280100 4 AATTAAGAAATTGAAATTCATAACAC[A/G]CAAATGTAAGGGAAGAGCTGCTTAC
rs723211 10 AGCGAAGAGTCACTCTTGGGGTATCA[A/G]TGAGAGAAGAGGCTGGGCATCAGAG
R as ki n L. e t a l., 2 00
8 rs11200014 10 TCCAAAAAAAGATGCACAGAGGGAAG[A/G]TTTTCTCTCTGGTCCCAACACGTGT
rs2981579 10 CTTGCTTGTTTTGGATACGACCTCTG[C/T]AGACATCCAGGTTATGTATTTCCTC
rs1219648 10 AAGCACGCCTATTTTACTTGACACAC[A/G]CTCTTCAAGGATGGCCATGGCTTGT
rs2420946 10 CATCGACCTCCTTCCTGATCCATAAG[C/T]GCATCCACAGATCCCAGGTTGAGCA
27
Table 2 - Primers designed to amplify specific regions, on which existed the SNP previously selected. All the primers obey to the specifications previously described. Melting temperatures (Tm) and fragment length for each pair of primers is also presented
SNP Fragment length
Primer Forward Primer Reverse Sequence 5'-3' Tm (ºC) Sequence 5'-3' Tm (ºC) rs988436 138 CCTATCACTAGAAGAAACAGACAC 59,3 GACAGGTGTCATGTACCTACATA 58,9 rs942793 87 TCTGTCTGGCTTGTGTCTG 56,7 CAGCTAGGGTACAAGTCTG 56,7 rs1368136 114 GGAGAATTCAGAGAGGGATACT 58,4 CTTCCTTAGCAAACTCACAGTC 58,4 rs2060983 128 GTCTTAAAATGGGTGATTGGCCTC 61,0 CCTTCACTGCCTCTAGAAAGAGAA 61,0 rs4988235 95 TTAGACCCTACAATGTACTAGTAGG 59,7 GCAACCTAAGGAGGAGAGTTC 59,8 rs1404402 126 GCAGAGGGATCACAAGATGT 57,3 AGATTATTGCAGGGGCTGTG 57,3 rs1016120 137 GCTGCAGCTAAATTGCCTCTCAAA 61,0 GGAGAAGAATCCCAGTAGAGGTAA 61,0 rs1414411 282* CTAACCAAATGGCCAAAATTGACTG 59,7 CAGACTGAGCAGATGGCACA 59,4 rs2014303 142 CCACTTTCACTTTTGCTTTTGCC 58,9 AAGCGATGGAGTCATAAGGAGTT 58,9 rs1030626 144 GGAAAGGGAAAGGGAGGATG 59,4 CCATGAATTCCGTACTGCATAAAG 59,3 rs1517661 101 CCAGGAACAATTGTTCTGCTG 57,9 CCTGTTCCTTGGTATTGCTCT 57,9 rs764138 170* CTCTTGGCCCTAATACCCAT 57,3 CTACAGGGCCATCTTCATGT 57,3 rs2218497 149 GCTGGTACCATTCCTGCCAA 59,4 GTTCATCAAGGATATTGACCTGAAG 59,7 rs725379 135 AAGTAAAATCAGCAGAACCTGG 56,5 CTGATTCTCCAACAGAGGG 56,7
28 rs1377724 100 GGGTACAGAGAAGGTTGGAA 57,3 GGTCAAGATCTCAGAAGAGC 57,3 rs1406121 115 ATGTCCTGAGATTCCCAGCA 57,3 TGCTCTTCAGGATTTGGGTG 57,3 rs869538 141 GCTACAATCTATGCAGCAATTTCC 59,3 CACAAGGCTAGTATGCCATTAGAA 59,3 rs1905471 94 AGGAGCATGCTCAGTGTGTTT 57,9 GGTATATGATCTCCTAGGGAC 57,9 rs764681 98 CATCACCTGGACACTTATTTGC 58,4 CATGTATCAGAATTACCTGGCG 58,4 rs1280100 102 CACCACAGCGCCAAATGAT 56,7 GTCCAGTTTGTGAAAAGGTAAG 56,5 rs723211 130 GGATGTCACTCAGGACTCA 56,7 ATGATGCTCTGATGCCCAG 56,7 rs11200014 95 GATCTGATGTTTTCGGCTGTTCA 58,9 GACTTTAATACACGTGTTGGGAC 58,9 rs2981579 96 AGAAGAGGCTGGTGGAGGA 58,8 CCGGGGGGAGGAAATACAT 58,8 rs1219648 102 TTCCATGGTACCGGTTTCCCAA 60,3 ATTGGGACAAGCCATGGCCAT 59,8 rs2420946 138 CTCATAGCTCATGGAAACTATAAACCC 61,9 AGGCCTGCTCAACCTGGGAT 61,4 rs2981582 100 GAGAATAAAACGGCAGATCCCA 58,4 GACTGCTGCGGGTTCCTAA 58,8
29 2.3 – Control Sample analysis
Resorting to the Weir’s unbiased (FST) values for each SNP as a measure of genetic
distance between two groups, the five SNPs with the highest FST values were selected for
laboratory validation. The sets of primer for these five SNPs (table 3) were tested for PCR amplification. The conditions of PCR, including the annealing temperature (Ta) (table 3), were
optimized and no problems of amplification or specificity were detected for the five regions amplified.
A set of 30 samples from different human populations were randomly selected to establish control samples. These samples were further amplified and sequenced, and analyzed by HRM. This analyze allowed the compilation of the melting temperature (Tm) for each SNP (table 3).
Table 3 - Annealing temperature (Ta) for Polymerase Chain Reaction (PCR) and melting temperature (Tm) for
High Resolution Melting (HRM).
SNP Ta (ºC) for PCR Tm (ºC) for HRM rs988436 56,3 78,4 rs942793 53,7 80,3 rs1368136 55,4 78,5 rs2060983 58 76,8 rs4988235 56,7 78,7
The sequence of the region encompassing each SNP in different samples allows classifying the sample according to it genotype (fig. 4). Afterwards, HRMs were performed with the samples which were sequenced and it genotype identified. The HRM allowed establishing for each SNP a melting pattern for the different genotypes. This would be helpful in the future for the classification of other samples. By the analysis of the figure 5 it is possible to infer that in a HRM analysis the homozygous melting curve appear parallel to each other and that the heterozygous curve begins with one of the homozygous and ends with the other, and it cross the space left between the two homozygous. Moreover, the HRM analysis allows determining the melting temperature of HRM experiments for each SNP (table 3), a parameter that would be useful in subsequent experiments reducing the time of analysis.
30
A. B. C.
2.4 – Ancient samples
The primers and conditions optimized for control samples were tested to amplify ancient samples from Bronze and Iron Age periods and positive amplifications were obtained (fig. 6). These results point that these primers and genotyping method can be used successfully in ancient samples and this point will be investigated in the future.
Figure 4 – Sequencing of three control samples for a specific region of one of the SNP study, on which it is possible to identify the three possible genotypes: CC (A); TT (B), CT (C)
Figure 5 – HRM of three samples with distinct genotypes: TT (blue), TC (violet) and CC (yellow). This graph allows the establishment of a pattern for each genotype for each SNP studied.
31
32
3.
Discussion
The majority of selected SNPs presented the highest FST values between the northern and
southeastern European populations and five allows differentiating the influence of Sephardi Jewish populations [Bauchet et al., 2007; Raskin et al. 2008]. Thus, with this set of twenty-six SNPs we expect to see different patterns of genetic frequency of the SNPs in different Iberian populations.
Relatively to the SNPs of the Sephardi Jewish populations, is expected to see an obvious influence on Catalonia and Zamora, due to the fact that these two regions are described as places of settlement for the Jews during the inquisition time. During this time, they were forced to convert to Catholicism but yet many of them maintained their beliefs in secret [Quesada, 1989; Stone, 1990].
Regarding the non-inclusion of SNPs for the African population, it was due to the fact that the African influence in the peninsula has been studies using mainly monoparental genetic markers.
Among the SNP genotype techniques the one chosen for this study was HRM. This technique presents a number of advantages as: cost advantages derived from the simplicity of the method; doesn’t require specific labelled probes; is a closed-tub method where no processing is required between amplification and analysis, on which the risk of contamination is eliminated; hybridization is monitored over a range of temperatures instead of at a single temperature; after PCR amplification, the melting curves are generated by monitoring the fluorescence of a saturating dye that doesn’t inhibit PCR; is a non-destructive method which allows a subsequent characterization using gel electrophoresis or sequencing [Tayler, 2010; Vossen, 2009; Reed, 2007].
Comparing the HRM with other techniques, we can identify several disadvantages of other techniques such as SSCP, TGCE, DGGE and DHPLC. All of them need extensive automation, instrumentation and analysis and all require the separation of the gel or matrix, during which there is a high risk of contamination because the PCR product becomes exposed to the environment; other techniques, such as primer extension and invasive cleavage, demand the use of specific probes which have to be design [Reed, 2007; Kwok, 2001].
Thus, and taking into account that the studies that already used this technique [Zhou et al., 2005; Erali et al., 2008; Takano et al., 2008], the selection of HRM as the technique for this study seemed the right one. Taking into consideration all the specification required for the HRM,
33
a set of primers has designed for all the SNP selected. A handicap of this technique is that the SNPs have to be analysed one by one, which depending on the number of SNPs to be analyzed can be a time consuming technique. Although this handicap, when analyzing ancient samples the individual analyze of each SNP is important to ensure obtaining results.
In order to enable the reading of results of the HRM is very important to establish control samples, which are used as reference samples to each genotype. In all subsequent HRM, this reference samples are also embedded facilitating the classification of samples when, for example, genotype assignment is not straightforward. This control samples also allowed to reduce de time of the HRM, as each sequence for a specific SNP has a specific melting temperature, and in further HRM cycles the range of temperature can be decrease, leading to a small time consuming process.
Regarding the ancient samples, the positive amplifications obtained let us to think that HRM can be an alternative to SNP genotyping of degraded. It would be important, however, to further prosecute this technique with ancient samples.
35
IV. Chapter II - Iberian Human Population Structure: the European AIMs
contribution
1. Material and Methods
1.1 – Samples
The number of samples analysed by SNP and population is described in table 4. The samples are from individuals of both sexes and from the autochthon population, checked until the previous two generations. All the participants gave their written informed consent to participate in the study.
The DNA extraction was performed using the Jetquick Blood/Cell Culture DNA Spin Kit (Genomed) according to the manufacture specifications.
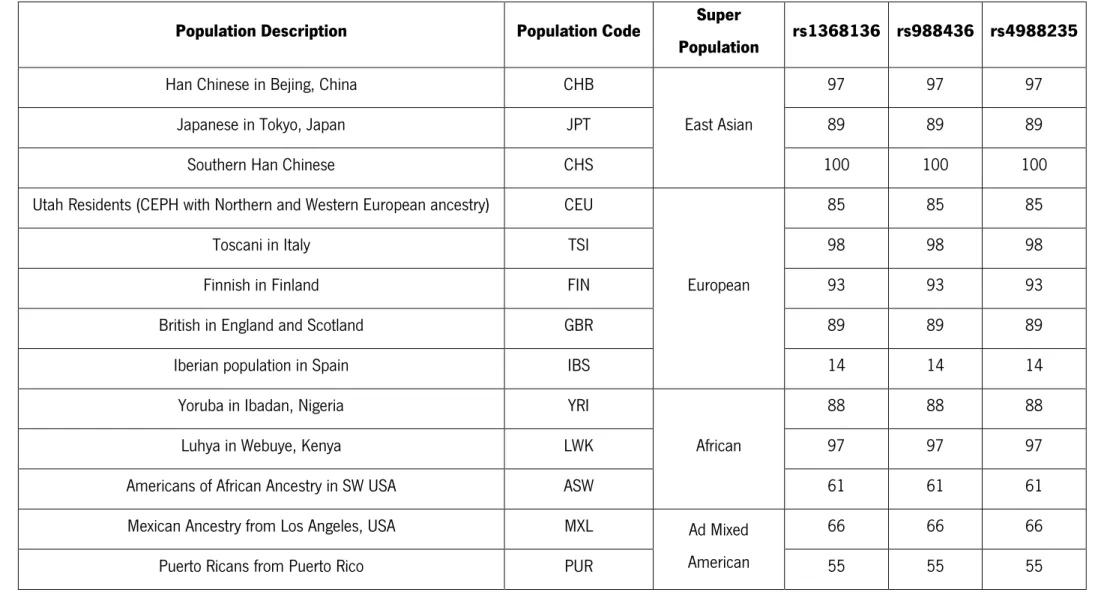
For comparative purposes, genotype frequencies for each SNP were obtained from the 1000 genomes projects platform [1000genomes, 2013] for the populations listed in table 5.
Table 4 – Number of samples analyzed taking in consideration the SNP and the population
rs988436 rs1368136 rs4988135
Catalonia 31 31 30
Andalucia 49 55 31
Zamora 33 33 32
1.2 - SNP analysed and methodology
The SNP analysed were rs988436, rs1368136 and rs4988235. The genotyping methodology used was High Resolution Melting using the optimized conditions detailed in the previous section Chapter I - Primer design and validation for analysis of European AIMs.
36 1.3 - Data analysis
1.3.1 - Intra-population analysis
Conformity with Hardy-Weinberg equilibrium was tested for each SNP and population. For probability interpretation a Bonferroni correction for multiple tests was applied. Hardy-Weinberg equilibrium states that the original proportion of the genotypes in a population will remain constant from generation to generation, as long as: no mutations take place; no immigration or emigration takes place; random mating is occurring; the population size is very large and no selection occurs. If these parameters are achieved and the genotypes proportions do not change, it is said to be in Weinberg equilibrium. If a population is not in Hardy-Weinberg equilibrium one or more evolutionary forces are operating [Raven et al., 2011; Guo et al., 1992].
Nei Gene Diversity [Nei, 1987] was calculated as a molecular diversity indicator. Gene diversity is equivalent to the expected heterozygosity for diploid data and it is defined as the probability that two randomly chosen haplotypes are different in the sample [Excoffier et al., 2005].
All the mentioned analysis were performed using Arlequin ver. 3.0 [Excoffier et al., 2005].
1.3.2 – Inter-population analysis
The population comparisons were made by computing pairwise FST values [Reynolds et
al., 1983; Slatkin, 1995] and by means of an exact test of population differentiation [Raymond et al., 1995]. This analysis were performed using Arlequin ver. 3.0 [Excoffier et al., 2005].
To evaluate the relation between populations using the combined information of all the SNPs analyzed, a Principal Component Analysis (PCA) was used. PCA consists on reducing the dimensionality of a data set consisting of a large number of interrelated variables, while retaining the variation present in the data set [Jolliffe, 2002]
![Figure 1 - DNA is a linear combination of four nucleotides, so when comparing two sequences position by position if there are different nucleotides at the same position we are in the present of a SNP [Chakravarti, 2001]](https://thumb-eu.123doks.com/thumbv2/123dok_br/17709317.828980/17.892.250.618.304.598/combination-nucleotides-comparing-sequences-position-different-nucleotides-chakravarti.webp)

![Figure 3 Map of the Iberian Peninsula, where is differentiated the area that corresponds to Spain (in blue) and the area that corresponds to Portugal (in orange) [INE, 2012b]](https://thumb-eu.123doks.com/thumbv2/123dok_br/17709317.828980/22.892.129.771.521.910/figure-iberian-peninsula-differentiated-corresponds-spain-corresponds-portugal.webp)