Ancestry indicative markers in HIV positive patients in
the state of Mato Grosso, Brazil
Lenicy Lucas de Miranda CerqueiraI; Claudinéia AraújoII; Beatriz Santos RibeiroIII
DOI: 10.5935/MedicalExpress.2017.05.07
I Departamento de Biologia e Zoologia, Instituto de Biociências, Universidade Federal de Mato Grosso, Cuiabá, Brazil. II Faculdade de Medicina, Universidade Federal de Mato Grosso, Rondonópolis, Brazil.
III Universidade de São Paulo Faculdade de Medicina de Ribeirão Preto, Clinica Médica, São Paulo, SP Brazil.
OBJECTIVE: Ancestry Indicative Markers are used to deine the allelic frequency of genes from diferent ethnic groups in populations of certain localities of interest, for analysis of population ancestry and estimation of ethnic mixture. This work aimed to evaluate the frequency of occurrence of the ancestry Indicative Markers SB-19.3, APO, AT3 / ID and PV-92 and to determine the existence of polymorphisms for these markers in the state of Mato Grosso.
METHOD: The study aimed to estimate allelic and genotype frequencies, adherence to the Hardy-Weinberg equilibrium and genetic diferentiation in the sample of 238 controls formed by HIV free individuals residing in twenty-six diferent municipalities in the state, collected at the Júlio Muller University Hospital and in a sample of 516 HIV-positive patients also residing in the state.
RESULTS: The Hardy-Weinberg equilibrium test revealed an imbalance between the observed and expected proportions of Sb19.3 and APO loci in the control population. Applying the genetic diferentiation test, control populations and HIV-positive patients difered for the four loci analyzed.
CONCLUSION: The population of the state of Mato Grosso, Brazil proved to be very heterogeneous, conirming hypotheses about its history of colonization. Control populations and HIV-positive patients difered for the four loci analyzed.
KEYWORDS: Ancestry, Mato Grosso, population.
Cerqueira LLM; Araújo C; Ribeiro BS. Ancestry indicative markers in HIV positive patients in the state of Mato Grosso, Brazil. MedicalExpress (São Paulo, online). 2017 Oct;4(5):M170507
Received for Publication on July 27, 2017; First review on September 5, 2017; Accepted for publication on October 19, 2017; Online on
November 1, 2017
E-mail: [email protected]
■
INTRODUCTIONStudies of groups of individuals according to the population to which they belong or comparisons between individuals from the same population according to their ethnic groups are relevant to understand the characteristics of diseases, an important subsidy for Public Health.
This type of grouping of individuals according to phenotypic or social characteristics may be complicated, due to high levels of miscegenation presented by most contemporary populations, as is very much the case with the Brazilian population.
Genetic proportions of ancestry in several Brazilian population samples have been investigated
with the use of markers. These markers, namely
PSAs (Population-specific alleles) or AIMs (Ancestry Informative Markers) are molecular markers that present
difference of allelic frequency between populations, being able to detect either the absence or the exclusive presence of a certain allele in a given population.1 The
use of genetic ancestry information can help map genes
that influence susceptibility to complex diseases derived
from ethnic factors.2
The most recent estimates made by the Brazilian
Institute of Geography and Statistics-IBGE3 indicate that
the Brazilian population totals 208,042,639 inhabitants; 49% self-classify themselves as white, 37.3% as brown, 8.4% as black, 3.8% as indigenous and 1.5% as yellow.
UNIC: 2011-154. The data regarding their age, sex, city of
birth, where they currently reside and self-assessment of their skin color is displayed in Table 1. The sampled
participants are residents of 26 (out of 141) different municipalities in the state of Mato Grosso.
The inclusion criteria were defined based on the
analysis of the records of care and follow-up of these patients and consultation with an infectious physician from
the State Health Department, taking into account the ELISA test for anti-HIV antibodies, confirmed by Western blotting
and antiretroviral treatment.
Laboratory analysis: Peripheral blood samples from
HIV positive patients were collected by venipuncture in tubes containing 0.1% EDTA (final volume in 1 Mg/ dL concentration) and the genomic DNA was extracted from 200 mL using a kit for DNA purification GFX (GE Healthcare Life Sciences of Brazil®), with adaptations.
Peripheral blood samples from seronegative
controls (2-4 ml) were collected as described above; the
DNA was extracted according to Higuchi & Ochman,10 with modifications, or through the use of two commercial extraction kits (GE Healthcare Life Sciences of Brazil® and Invitrogen – Thermo Fisher Scientific).
DNA quantifications were performed by Agarose Gel Electrophoresis (140V applied for 30 minutes). After this period, the gel was observed in the translucent (UVP®) and the analysis
of the bands indicated the respective DNA characteristics.
We then performed the analysis of the ancestry indicative markers of the ALU insertion types: SB19.3, PV92 and APO and (Indel) – (AT3-I/D). The ALU locus
Sb19.3, previously described by Parra et al,11 belongs to
the subfamily Yb8 and is located in chromosome 19p12.12
The presence of this insert generates a fragment of approximately 457bp and characterizes the Sb 19.3*1 allele.
The ALU APO locus described by Batzer et al13 is close to the apolipoprotein AI-CIII-AIV gene complex on the long arm
of chromosome 11. The presence of this insert generates a fragment of approximately 409bp and characterizes the
APO*1 allele. The ALU PV-92 locus is located in chromosome
16 and the presence of this insert generates a fragment of
approximately 400bp and characterizes the PV92*1 allele;
its absence generates a 110bp fragment that characterizes
the PV92*2 allele. The AIM AT3-I/D, described by Liu et
al.14 is an insertion/deletion type, also called “indel”, which
is characterized by the presence of the insertion of exon 1,
with 76bp, located in chromosome 1 (1q25.1). The AT3*1
allele, representative of the insert corresponds to the
heavier band (572bp) and the AT3*2 allele represents the lighter fragment (Table 2).
according to Callegari-Jacques et al,4 of immigrants who
arrived in Brazil between 1500 and 1972, 58% were
European, 40% African and 2% Asian.
After 500 years of miscegenation between
Amerindians, Europeans and Africans, the Brazilian
population has become one of the most heterogeneous in the world.5 The state of Mato Grosso (3.5 million inhabitants) also presents this characteristic with the predominant miscegenation of three ethnic groups: Africans, Amerindians and Europeans.
The relationship between ancestry and genetic diseases is not restricted to any single population group, although differences in the prevalence of some diseases according to race and genotype are evident in several studies.1-7 It is known that the vulnerability of
individuals to certain diseases, as in the case of Acquired
Immunodeficiency Syndrome (AIDS), is dependent on
several ethnic, genetic, socioeconomic and environmental
factors. These added factors drive the spread of HIV/AIDS.6
To understand the mechanism of infection and the
host’s response to the HIV-1 virus we must understand the genetic makeup of the host. It allows us to understand, at least
in part, why some individuals are more resistant to certain
infections than others. In order to understand the differential progression to AIDS, many studies have been carried out, but
the understanding of the inclusion of different populations
with different ancestries can contribute to the clarification of genetic factors that influence the infection.7
DNA markers such as AT3-I / D, APO, Sb19.3, PV92 point to divergences in the contributions of European,
Amerindian, and African ancestry in each region. Such markers make it possible to recover the socio-historical and demographic events of the country.8-10
There is a scarcity of studies for the State of Mato Grosso (total area: 900.000 km2, population 3.3 million; HDI: 0.72, equatorial/tropical climate) evaluating the incidence of AIDS according to the race/color variable. In order to overcome some of this deficiency, this study aimed
to analyze the prevalence of ancestral informational marker
polymorphisms in samples in HIV-free and HIV-1 virus
carriers within the population of the state
■
MATERIALS AND METHODSThis is an observational, cross-sectional study. A total
of 516 HIV-1 infected individuals were collected at the Júlio Muller University Hospital, in the state capital city of Cuiabá, Mato Grosso (population 600,000, HDI 0.78). As controls,
samples from 238 seronegative individuals were collected from DNA banks of research projects already completed or in progress. All participants are residents of the state of
Mato Grosso and have received basic information on this
research, in addition to signing a free and informed consent
form approved by a Research Ethics Committee, case # CEP
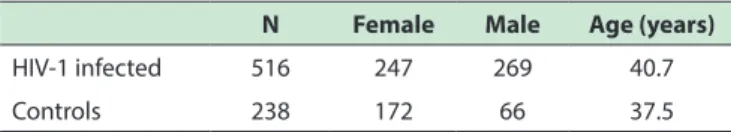
Table 1 - Anthropometric data on included patients
N Female Male Age (years)
HIV-1 infected 516 247 269 40.7
Table 2 - Indicating Loci, type of polymorphism and population where allele *1 is more frequent.
Locus Polymorphism Allele*1 Allele*2 Population with more
frequent Allele*1
Sb 19.3 Insertion ALU 457pb 150pb European
APO Insertion ALU 409pb 110pb European
PV-92 Insertion ALU 400pb 110pb Amerindian
AT3/ID 76bp indel 572pb 496pb African
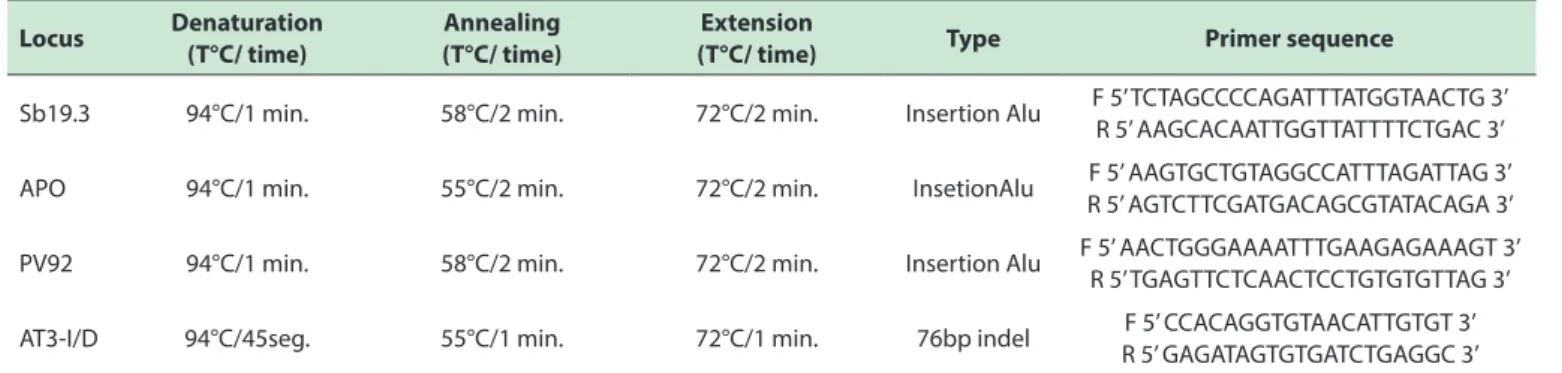
DNA was amplified by PCR (Polymerase Chain Reaction) using an Eppendorf® thermocycler in a total reaction volume of 25μl. After an initial denaturation step of
5 minutes at 94ºC, the samples were ampliied for 30 cycles at the denaturation / annealing / extension temperatures speciied for each loci, followed by a inal extension step of 5 minutes at
72ºC. Table 2 displays specific parameters, type and primer
sequences used.
For marker Sb19.3, the amplified products were
separated by electrophoresis on 10% non-denaturing polyacrylamide gels15 and 1% agarose. APO, and PV92
markers were analyzed on 2% agarose gel and stained with GelRed™ (Uniscience®). For the AT3-I/D marker, 10% polyacrylamide gel was used with silver nitrate.
Statistical Analysis: Allele frequency estimates,
deviations from Hardy-Weinberg equilibrium expectations
and the exact test of population differentiation based on allele or genotype frequencies were performed using
GENEPOP software (http:// genepop.Curtin.edu.au).
■
RESULTSThis study used samples from 238 individuals from the control group, of whom 172 were female and 66 were
male; 516 were HIV positive patients, of whom 247 were
female and 269 were male.
In the control group, 161 individuals were
interviewed and self-assessed for skin color, categorized as yellow, white, indigenous, black or brown.
A total of 215/238 (90.3%) control subjects presented positive results in the amplification of the markers studied. Of the HIV-positive patients, only 277/516
Table 3 - PCR conditions and primer sequences used of the four analyzed AIMs.
Locus Denaturation (T°C/ time)
Annealing (T°C/ time)
Extension
(T°C/ time) Type Primer sequence
Sb19.3 94°C/1 min. 58°C/2 min. 72°C/2 min. Insertion Alu F 5’ TCTAGCCCCAGATTTATGGTAACTG 3’ R 5’ AAGCACAATTGGTTATTTTCTGAC 3’
APO 94°C/1 min. 55°C/2 min. 72°C/2 min. InsetionAlu F 5’ AAGTGCTGTAGGCCATTTAGATTAG 3’ R 5’ AGTCTTCGATGACAGCGTATACAGA 3’
PV92 94°C/1 min. 58°C/2 min. 72°C/2 min. Insertion Alu F 5’ AACTGGGAAAATTTGAAGAGAAAGT 3’ R 5’ TGAGTTCTCAACTCCTGTGTGTTAG 3’
AT3-I/D 94°C/45seg. 55°C/1 min. 72°C/1 min. 76bp indel F 5’ CCACAGGTGTAACATTGTGT 3’ R 5’ GAGATAGTGTGATCTGAGGC 3’
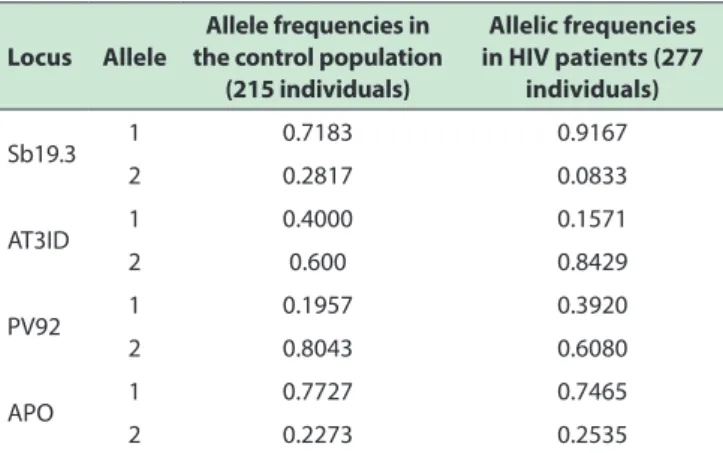
(53.7%) individuals presented positive results in the amplification of the markers studied. The allele frequencies
obtained are listed in Table 4.
The Hardy-Weinberg equilibrium test revealed an
imbalance between the observed and expected proportions of Sb19.3 and APO loci in the control population (Table 5).
Applying the genetic differentiation test, control
populations and HIV-positive patients differentiated for the four loci analyzed (Table 6).
■
DISCUSSIONThe history of each population studied is essential in genetic studies of populations that attempt to group individuals according to ethnicity . The genetic constitution of a population with respect to the genes that it possesses is
described by the gene frequency, the identification of which
alleles are present in each of the loci and their proportions.17
The challenge of genetic studies of human history is to use genetic differentiation among populations to infer the history of human migrations; because most alleles are common, genetic differences between human populations come mainly from gradations in allelic frequencies.18
According to data from IBGE in 2000,3 there is a
greater participation of Africans in the settlement of the
northeast region, Amerindians in the North and Europeans
in the South.
Considering markers Sb19.3 and APO and their higher frequencies in European populations, it is possible
to suggest that miscegenation of the population of the
the *1 alleles of Sb19.3 and APO in this population. This is shown in Table 4.
The observed deviations are due to the great gene
flow and high level of miscegenation of the population,
which is a marked characteristic of the population of the
state of Mato Grosso.
This result resembles that found in the study by
Lins et al2 when studying Brazilian population samples
using ancestral the information content of 28
ancestry-informative Single-Nucleootide Polymorphisms (SNPs):
they reported that more than half of the individuals sampled
had a predominant European ancestry, 52% in the total
sample and 32.5% in the sample from the center-west region.
Pena et al19 carried out an estimation of ancestry in the four Brazilian regions using 40 Indel markers and as a result also observed the predominance of European
ancestry with proportions ranging from 60.6% in the Northeast region to 77.7% in the South region.
Using several Microsatellite Markers and AIMs including the AT3-I/D locus, Pedrosa9 investigated four
remaining Brazilian communities of quilombos and found
an allele frequency for the locus ranging from 0.438 to 0.671 and 0.329 to 0.563 for The AT3 *1 and AT3 *2 alleles, respectively. This difference in comparison to our results can be explained by the fact that the remnant quilombo
populations have ancestry strongly linked to the Africans, considering the historical context of their formation, the
refuge and establishment of the slaves in places of difficult
access that gave rise to the isolation.20,21 Consequently
the allelic frequency of insertion in this locus tends to be
greater. In the present study, we are dealing not with small
and isolated communities, but integrally with the large and mixed population of a very large Brazilian state.
Studies with two other Brazilian quilombo
populations were carried out by Gontijo.22 The allelic
frequencies found ranged from 0.500 to 0.742 for the AT3*1 allele and 0.258 to 0.500 for AT3*2.
Parra et al23 studied 9 autosomal AIMs loci (APO, AT3-I / D, GC 1S, GC 1F, FY-Null, LPL, OCA 2, RB 2300 and Sb19.3) in 10 African-American populations of the United States and Jamaica. Their results indicated that the European contribution corresponds to 6.8% in Jamaica and to 22.5% in New Orleans. This finding weakens the concept
of grouping considering only the phenotype expressed by an individual.
In another study with the objective of evaluating the
genomic ancestry of the Brazilian population, Parra et al23 sampled (A): 173 individuals from a rural southeastern community, visually classified as whites, blacks, and intermediates; the also sampled (B): 200 individuals from
the North, Northeast, Southeast and South regions of the
country, using the “African Ancestry Index” (IAA). The
results revealed that in Brazil skin color is a poor indicator of ancestry.
Luizon24 evaluated the polymorphism of eight AIMs (FY-Null, RB, LPL, AT3-I / D, Sb19.3, APO, PV92 and CYP1A1*2C) in three remaining quilombo communities compared to samples from two urban populations. This work evidenced a greater miscegenation in the urban populations when compared to remnants of quilombos
and indigenous tribes, but the subpopulations studied
presented significant differences of genetic frequencies
among themselves. Due to the population isolation, this portion of individuals tends to differentiate from larger populations that occupy a larger area and resemble favoring a higher frequency of certain alleles within themselves.
Other interethnic estimates also held in Brazil by Santos25 using 48 markers of indel type, indicate that, as
expected, individuals in southern Brazil have an almost
exclusively European descent. The indels AIMs panel MID group were optimized and the findings validated the
valuable tools for individual and overall estimate of ethnic proportions in admixed populations.
In the state of Mato Grosso specifically, there are no
studies that record genetic information of this nature and
Table 4 - Allele frequencies
Locus Allele
Allele frequencies in the control population
(215 individuals)
Allelic frequencies in HIV patients (277
individuals)
Sb19.3 1 0.7183 0.9167
2 0.2817 0.0833
AT3ID 1 0.4000 0.1571
2 0.600 0.8429
PV92 1 0.1957 0.3920
2 0.8043 0.6080
APO 1 0.7727 0.7465
2 0.2273 0.2535
Table 5 - Test for the Hardy-Weinberg Equilibrium (H-W)
Locus H-W in the controls H-W in HIV patients
Sb19.3 0.0012 (**) 0.0504 (*)
AT3ID 1.0000 (NS) 0.7193 (NS)
PV92 0.1619 (NS) 0.2380 (NS)
APO 0.0000 (**) 0.0720 (NS)
NOTE: NS: not signiicant; *: signiicant; **: highly signiicant
Table 6 - Population Diferentiation Test.
Locus P value Standard deviation
Sb19.3 0 0
AT3ID 0 0
PV92 0.00658 0.000756545
Este trabalho teve como objetivo avaliar a freqüência de AIMs (SB-19.3, APO, AT3 / ID e PV-92) e verificar a existência de polimorfismos para esses marcadores no estado de Mato Grosso.
MÉTODO: O estudo teve como objetivo estimar as
freqüências alélicas e genotípicas, a aderência ao equilíbrio de Hardy-Weinberg e a diferenciação genética na amostra de controles formada por indivíduos residentes em vinte e seis municípios do estado, coletados no Hospital Universitário Júlio Muller e em uma amostra de pacientes HIV positivos também residentes no estado.
RESULTADOS: O teste de equilíbrio de
Hardy-Weinberg revelou um desequilíbrio entre as proporções
observadas e esperadas dos loci Sb19.3 e APO na
população de controle. Aplicando o teste de diferenciação genética, a população controle e os pacientes HIV positivos
diferenciaram-se para os quatro loci analisados.
CONCLUSÃO: A população do estado de Mato Grosso
mostrou-se heterogênea, confirmando hipóteses sobre sua história de colonização. A população controle e os pacientes HIV positivos diferenciaram-se para os quatro
loci analisados.
PALAVRAS-CHAVE: Ascendência, Mato Grosso, população.
■
REFERENCES1. Shriver MD, Smith MW, Jin L, Marcini A, Akey JM, Deka R, et al. Ethnic affiliation estimation by use of population-specific DNA markers. Am. J. Hum. Genet. 1997;60(4):957-64.
2. Lins TC, Vieira RG, Abreu BS, Grattapaglia D, Pereira RW. Genetic Composition of Brazilian Population Samples Based on a Set of Twenty Eight Ancestry Informative SNPs. Am. J. Hum. Biol. 2010;22:187-92. DOI:10.1002/ajhb.20976
3. Instituto Brasileiro de Geografia e Estatística. Características étnico-raciais da população. [Accessed em 25 set 2017]. Available at: http:www.ibge.gov.br
4. Callegari-Jacques SM, Grattapaglia D, Salzano FM, Salamoni SP, Crossetti, SG, Ferreira, ME. et al. Historical genetics: Spatiotemporal analysis of the formation of the Brazilian population. Am J Hum Biol. 2003;15:824–34. DOI:10.1002/ajhb.10217
5. Abe-Sandes K, Bomfim TF, Machado TMB, Abe-Sandes C, Acosta AX, Alves CRB et al. Ancestralidade Genômica, Nível Socioeconômico e Vulnerabilidade ao HIV/AIDS na Bahia, Brasil. Saúde e Sociedade. 2010; 19(2):75-84. DOI:10.1590/S0104-12902010000600008 6. Parker R, Camargo-Jr, Kenneth R. Poverty and HIV/AIDS: anthropological
and sociological aspects. Caderno de Saúde Publica. 2000;16(Suppl 1):89-102. DOI:10.1590/S0102-311X2000000700008.
7. Medeiros MR. Avaliação de polimorfismo em genes envolvidos na resposta imune inata de pacientes infectados com HIV-1 e sua influência na progressão à AIDS. Masters dissertation, Genetics and molecular biology, Universidade Federal do Rio Grande do Sul, Instituto de Biociências. 2012. Porto Alegre, RS, Brazil
8. Santos RV, Bortolini MC, Maio MC. No fio da navalha: raça, genética e identidades. Revista USP. 2006;68:22-35.
9. Pedrosa, MAF. Composição genética de quatros populações remanescentes de quilombos do Brasil com base em microssatélites e marcadores de ancestralidade. Masters dissertation in Molecular Biology, Universidade de Brasília, Departamento de Biologia Molecular.
2006. Brasilia, Brazil
10. Luizon MR, Mendes-Jr CT, Oliveira SF, Simões AL. Ancestry Informative Markers in Amerindians from Brazilian Amazon. Am. J. Hum. Biol.
there is still a gap in the genetic makeup of the population. New data on the contribution of ancestral populations in
HIV patients and in the control population may support
a better understanding of the prevalence of differential ancestry within the diseased and may help to advance the use of genomic medicine.
■
CONCLUSIONThis study showed that the use of markers can provide useful data on genetic structure in samples of
mixed populations. The population of the state of Mato Grosso proved to be very heterogeneous, confirming hypotheses about its history of colonization. For a better
characterization of this population, it would be interesting
if more markers were to be used. We also found that control populations and HIV-positive patients differentiated for the
four loci analyzed.
■
CONFLICT OF INTERESTAuthors Declare no conflict of interest relating to
this project.
■
AUTHOR PARTICIPATIONLenicy Lucas de Miranda Cerqueira: Conceived and
designed the experiments; performed the experiments;
Analyzed the data; Contributed reagents, materials, analysis
tools; wrote the manuscript.
Claudinéia Araújo: Conceived and designed the
experiments; performed the experiments; Analyzed the
data; Contributed reagents, materials, analysis tools; wrote
the manuscript.
Beatriz Santos Ribeiro: Performed the experiments;
wrote the manuscript.
■
ACKNOWLEDGEMENTSWe acknowledge a grant from Fundação de Amparo a Pesquisa de Mato Grosso.
MARCADORES INDICATIVOS DE ANCESTRALIDADE EM PACIENTES HIV POSITIVOS NO ESTADO DE MATO GROSSO, BRASIL.
OBJETIVO: Os Marcadores Indicativos de
2008;20:86–90. DOI:10.1002/ajhb.20681
11. Parra EJ, Marcini A, Akey J, Martinson J, Batzer MA, Cooper R, et al. Estimating African American Admixture Proportions by Use of Population-Specific Alleles. Am J Hum Genet. 1998;63:1839-51. DOI:10.1086/302148
12. Arcot SS, Adamson AW, Risch GW, Lafleur J, Robichaux MB, Lamerdin JE, et al. High-resolution cartography of recently integrated human chromosome 19- specific Alu fossils. J Mol Biol. 1998;281(5):843-56. DOI:10.1006/jmbi.1998.1984
13. Batzer MA, Arcot SS, Phinney JW, Alegria-Hartman M, Kass DH, Milligan SM, et al. Genetic variation of recent Alu insertions in human populations. J. Mol. Evol. 1996;42:22–29. DOI:10.1007/BF00163207 14. Liu Y, Saha N, Low PS, Tay JSH. Linkage Disequilibrium between Two Loci (5’Untranslated Exon 1 and Intron 5-DdeI) of the Antithrombin III Gene in Three Ethnic Groups in Singapore. Hum Hered. 1995;45(4):192-8. DOI:10.1159/000154288
15. Sanguinetti CJ, Dias Neto E, Simpson AJ. Rapid silver staining and recovery of PCR products separated on polyacrylamide gels. Biotechniques. 1994; 17(5): 914-21.
16. Teló PN. Estimativa de mistura étnica avaliada por Marcadores Informativos de Ancestralidade (AIMs) e Microssatélites (STRs). Salvador. Masters dissertation in Health and Investigative Medicine Biotechnologu Centro de Pesquisas Gonçalo Moniz, Fundação Oswaldo Cruz. 2010. Rio de Janeiro Brazil
17. Salman AKD. Conceitos básicos de genética de populações. Embrapa. 2007 [Accessed 25 set 2017]; Available at: https://www.embrapa.
br/busca-de-publicacoes/-/publicacao/709081/conceitos-basicos-de-genetica-de-populacoes
18. Rosenberg NA, Pritchard JK, Weber JL, Cann HM, Kidd KK, Zhivotovsky LA, et al. Genetic Structure of Human Populations. Science. 2002;298(5602):2381-5. DOI:10.1126/science.1078311
19. Pena SDJ, Di Pietro G, Fuchshuber Moraes M, Genro JP, Hutz MH, et
al. The genomic ancestry of individuals from different geographical regions of Brazil is more uniform than expected. Plos One.
2011;6(2):e17063. DOI:10.1371/journal.pone.0017063
20. Pena SDP. Retrato Molecular do Brasil, Homo brasilis. Funpec. 2002 [Accessed 25 sep 2017]; Available at: http://www.nacaomestica.org/
hemero_020811_hoje_em_dia_homo_brasilis.html
21. CIGA, Centro de Cartografia Aplicada e Informação Geográfica da Universidade de Brasília. Segundo Cadastro Municipal dos Territórios Quilombolas. 2005 [Accessed 25 sep 2017]; Available at: http://www. ciga.unb.br/
22. Gontijo CC. Composição genética de duas populações Afro-derivadas brasileiras inferidas a partir de Marcadores Informativos de Ancestralidade. Brasília. Masters dissertation in Animal Biology -Universidade de Brasília-UnB. 2008. Brasilia, Brazil
23. Parra FC, Amado RC, Lambertucci JR, Rocha J, Antunes CM, Pena SD. Color and genomic ancestry in Brazilians. Proc Natl Acad Sci U S A.2003;100(1):177-82. DOI:10.1073/pnas.0126614100
24. Luizon MR. Dinâmica da mistura étnica em comunidades remanescentes de quilombo Brasileiras, 115F. Doctoral Thesis – Genetics.) – Universidade de São Paulo. Faculdade de Medicina de Ribeirão Preto. 2007. Ribeirão Preto, Brazil.