Ana Rita Marques da Silva
outubro de 2015
Production of biohydrogen from dark
fermentation of organic wastes
Ana Rita Mar
ques da Silva
Production of bioh
ydrogen from dark ferment
ation of organic w
as
tes
Ana Rita Marques da Silva
Production of biohydrogen from dark
fermentation of organic wastes
Trabalho efetuado sob a orientação da
Professora Doutora Maria Alcina Alpoim de Sousa Pereira
e da
Doutora Ângela Alexandra Valente de Abreu
Dissertação de Mestrado
A
GRADECIMENTOS
Em primeiro lugar quero agradecer á minha orientadora Alcina Pereira, pela confiança depositada no meu trabalho, pela orientação, partilha de conhecimento, disponibilidade total e motivação.
À minha co-orientadora Ângela Abreu, pela troca de ideias, partilha de conhecimento, apoio, orientação ao longo de todo o percurso, disponibilidade total e ajuda generosa no decorrer da realização deste trabalho.
Um especial agradecimento à Andreia Salvador por todo o apoio, presença e ajuda com a parte da biologia molecular realizada neste trabalho.
Ao Sr. Manuel Santos pelo trabalho e apoio prestados que foram imprescindíveis, bem com à Engª. Madalena Vieira e à Aline pela sua disponibilidade em ajudar.
A todos os meus colegas do Laboratório de Biotecnologia Ambiental, com quem tive o privilégio de trabalhar e que me ajudaram a superar alguns dos problemas laboratoriais que foram surgindo. Um especial agradecimento ao João.
Agradeço a todos os meus amigos que me acompanharam no meu percurso académico tanto na Licenciatura em Bioquímica como no Mestrado em Bioengenharia especialmente à Andreia, Catarina, Sara e Paulina pela vossa amizade, apoio e companheirismo.
Quero agradecer especialmente ao Ricardo, por todo o amor e compreensão. Por me apoiar em todas as minhas decisões e por me motivar em conquistar todos os meus sonhos. Obrigado por toda a paciência demonstrada em todos estes anos juntos.
E Finalmente agradeço aos meus pais e irmão por todo o apoio, amor, compreensão e inesgotável paciência.
R
ESUMO
Atualmente, o hidrogénio é uma alternativa promissora aos combustíveis fósseis devido á sua elevada conversão, reciclabilidade e natureza não poluente. Vários investigadores estudam outras fontes de combustível, inclusive o uso de hidrogénio como fonte de energia. A utilização de processos biológicos como a dark fermentation para a produção de hidrogénio é uma das possibilidades. Este processo é considerado um dos processos mais promissores, sustentável e “amigo” do ambiente. O armazenamento de energia é, atualmente, um assunto de extrema importância. A procura por novos métodos para o armazenamento de hidrogénio é um importante aspeto para as suas aplicações energéticas. Os zeólitos são um dos materiais mais promissores para o armazenamento deste gás. Estudos preliminares sobre a produção de hidrogénio por dark fermentation na presença de zeólitos revelaram um aumento significativo na produção deste. Nesta dissertação, foram testadas três razões diferentes de zeólitos/biomassa, 0.26, 0.13 e 0.065 g g-1 (VS).
Foram realizados ensaios em modo batch com dois meios diferentes (meio complexo e simples) e com arabinose e glucose como substrato. Em ambos os casos, o aumento na produção de hidrogénio na presença de 0.26 g zeólito g-1 (VS) biomassa foi significativamente superior do que o obtido para o
controlo (sem zeólito). A produção de hidrogénio máxima obtida para as fermentações em meio complexo e simples foram respetivamente 1.27 mmol e 0.87 mmol. Nestes ensaios, o lactato, acetato e o ácido fórmico foram os únicos produtos solúveis de fermentação (PSF) formados durante o processo dark fermentation. O aumento na produção de hidrogénio pelos zeólitos foi também observado em modo batch com o Sargassum sp., como substrato. Neste caso foi atingida uma produção máxima de hidrogénio de 0.62 mmol para a razão de 0.13 g zeólito g-1 (VS) biomassa. Vários produtos solúveis de
fermentação foram produzidos neste ensaio, uma vez que foi utilizado uma biomassa marinha que é um substrato bastante complexo. Contudo, o acetato e o lactato foram os PSF predominantes.
O efeito dos zeólitos em contínuo foi também testado. Nesta fase, duas operações foram realizadas uma com arabinose e glucose como substrato (RA + G) e outra com glucose (RG). A presença de 0.26 g zeólito g-1 (VS) biomassa no bioreator melhorou a taxa de produção de hidrogénio,
observando-se um máximo de 430 mL H2 L-1 d-1 e 250 mL H
2 L-1 d-1, respetivamente. O lactato foi o produto solúvel
de fermentação predominante, no entanto a formação de outros ácidos foi também observada. Palavras-Chave: Biohidrogénio, Zeólitos, Bioreator, Sargassum sp., Dark fermentation.
A
BSTRACT
Nowadays hydrogen is a promising alternative to fossil fuels mainly due to its high conversion, recyclability and nonpolluting nature. Several researchers study other sources of fuel, including the use of hydrogen as energy source. The utilization of biological process, such as Dark fermentation is one of the possibilities for the hydrogen production. This process is considered one of the most promising, sustainable and environmentally friendly. Currently, energy storage has become an extremely important issue. So the search for new hydrogen-storage methods has become an important aspect in hydrogen energy applications. Zeolites is one of the most promising material for hydrogen storage. Preliminary studies using zeolites for biohydrogen dark fermentation in batch mode, revealed an improvement on the biohydrogen production. Three different ratios zeolites/biomass, 0.26, 0.13 and 0.065 g g-1 (VS), were
tested.
The batch assays were performed with two different medium (complex and a simple medium) and with arabinose and glucose as substrate. In both cases the increase on cumulative hydrogen production in the presence of 0.26 g zeolite g-1 (VS) biomass was significantly higher than the obtained
for the control (without zeolites). A maximum hydrogen production of 1.27 mmol and 0.87 mmol was achieved for the fermentation with a complex and simple medium, respectively. Lactate, acetate and formic acid were the only soluble fermentation products (SFP) formed during dark fermentation process. The improvement of hydrogen production by zeolites was also observed in batch mode with the marine biomass, Sargassum sp., as substrate. In this case a maximum hydrogen production of 0.62 mmol was achieved in the presence of 0.13 g zeolite g-1 (VS) biomass. Due the use of a complex substrate many
soluble fermentation products were formed during Sargassum sp. dark fermentation. However acetate and lactate were the most prevalent of SFP.
The effect of zeolites in continuous mode, performed with glucose and arabinose as substrate
(RA + G) and with only glucose (RG), was also studied. The presence of zeolites (0.26 g zeolite g-1 (VS)
biomass) improve the hydrogen production rate in the two operations, reaching a maximum of 430 mL H2 L-1 d-1 and 250 mL H
2 L-1 d-1, respectively. The largest amount of soluble microbial products produced
for the two operations was for lactic acid. The acetate, formic acid, propionic acid and n-butyric acid formation was also observed.
T
ABLE OF CONTENTSAgradecimentos ... iii
Resumo... v
Abstract... vii
List of figures ... xiii
List of Tables ... xv
List of symbols and abbreviations ... xvii
1. Chapter State of Art ... 19
1.1 Importance of Hydrogen production ... 21
1.2 Biohydrogen production ... 22
1.2.1 Dark fermentation ... 22
1.2.2 Hydrogenases... 23
1.2.3 Fermentative pathways and metabolites for biohydrogen production ... 24
1.3 Bioreactors for hydrogen production ... 27
1.3.1 Type of Bioreactors ... 27
1.3.2 Type of inoculum ... 28
1.3.3 Advantages of using granular-sludge systems ... 29
1.3.4 Feedstocks and nutrients requirement ... 29
1.4 Parameters influencing the activity of hydrogen-producing bacteria ... 31
1.4.1 pH Control ... 31
1.4.2 Temperature control ... 31
1.4.3 Hydraulic retention time (HTR) control ... 32
1.4.4 Hydrogen partial pressure (p(H2)) ... 32
1.5 Importance of hydrogen storage materials ... 33
1.5.1 Zeolites ... 33
2. Chapter Objective ... 35
3. Chapter Material and Methods ... 39
3.1 Zeolites... 41
3.3 Hydrogen production assays with Sargassum sp. ... 42
3.3.1 Inoculum ... 42
3.3.2 Residue characterization ... 43
3.3.3 Experiment set-up ... 43
3.3.4 Experiment set-up with Zeolites ... 44
3.4 Operation of the Hydrogen producing reactors ... 44
3.4.1 Inoculum ... 44
3.4.2 Glucose and Arabinose reactor ... 45
3.4.3 Glucose reactor ... 45
3.5 Analytical methods ... 46
3.6 Molecular Methods... 46
3.6.1 PCR-DGGE and Sequencing ... 46
4. Chapter Results and Discussion ... 49
4.1 Biohydrogen dark fermentation with simple sugars ... 51
4.1.1 Zeolites effect on biohydrogen dark fermentation performed with a complex reaction medium 51 4.1.2 Zeolites effect on biohydrogen dark fermentation performed with a simple reaction medium 54 4.2 Biohydrogen dark fermentation of Sargassum sp. ... 57
4.3 Zeolites effect on biohydrogen dark fermentation of Sargassum sp. ... 60
4.4 Effect of HRT and zeolites in continuous hydrogen production in an EGSB bioreactor ... 63
4.4.1 Hydrogen production in an EGSB bioreactor using glucose and arabinose ... 64
4.4.2 Hydrogen production in an EGSB bioreactor using glucose ... 69
4.5 MICROBIAL COMMUNITY PROFILES... 71
4.6 MICROBIAL DIVERSITY ... 74
5. Chapter Conclusion ... 81
6. Chapter Bibliography ... 85 Bibliography ... 87
L
IST OF FIGURES
Figure 1. Schematic representation of dark fermentation biohydrogen production ... 22 Figure 2. Hydrogen producing fermentation pathways involved in glucose and arabinose fermentation, in mixed cultures, obtained from (Abreu, Karakashev, Angelidaki, Sousa, & Alves, 2012). ... 25 Figure 3. (a) Schematic representation of a pore of the zeolite NaX. (b) SEM images of zeolites NaX. . 34 Figure 4. Zeolites of NaX family, correspondent of type 13X. ... 41 Figure 5. Cumulative hydrogen production for each ratio zeolites/biomass tested. The error bars represent one standard deviation of triplicate bottles. ... 51 Figure 6. Arabinose (a) and glucose (b) utilization. Lactate (c), acetate (d) and formic acid (e) formation during hydrogen dark fermentation process for each ratio zeolites/biomass tested. Error bars represent one standard deviation of duplicate bottles. ... 52 Figure 7. Cumulative hydrogen production for each ratio zeolites/biomass tested. The error bars represent one standard deviation of triplicate bottles. ... 54 Figure 8. Arabinose (a) and glucose utilization (b). Lactate (c), acetate (d) and formic acid (e) formation during hydrogen dark fermentation process, for each ratio zeolite/inoculum tested. Errors bars represent standard deviation of duplicate bottles. ... 55 Figure 9. Cumulative hydrogen production for each ratio biomass/substrate tested. The errors bars represent one standard deviation of triplicate bottles. ... 57 Figure 10. Soluble fermentation products (SFP) formed during hydrogen dark fermentation process for each ratio biomass/Sargassum sp. tested. Error bars represent one standard deviation of duplicate bottles. ... 58 Figure 11. Cumulative hydrogen production for each ratio zeolites/biomass tested. Error bars represent one standard deviation of triplicate bottles. ... 61 Figure 12. Soluble fermentation products (SFP) formed during hydrogen dark fermentation process from Sargassum sp. for each ratio zeolites/biomass tested. Error bars represent one standard deviation of duplicate bottle. ... 62 Figure 13. Effect of HRT and zeolites on the performance of RA + G. (a) Hydrogen production rate and HRT. (b) Hydrogen content. ... 64 Figure 14. Effect of HRT and zeolites on (a) arabinose and glucose utilization, (b) soluble fermentation products (SFP). ... 65
Figure 16. Effect of HRT and zeolites on (a) arabinose and glucose utilization (b) soluble fermentation products. ... 70 Figure 17. DGGE profile of bacterial community present in the granular biomass of RA + G (arabinose and glucose as substrate) and RG (glucose as substrate) before and after zeolites addition. ... 72 Figure 18. Dendrograma calculated by Dice correlation of the DGGE profile of bacterial community present in the granular biomass of RA + G (arabinose and glucose as substrate) andRG (glucose as substrate) before and after zeolites addition. ... 73 Figure 19. Taxonomic composition of microbial community present in RA + G before zeolites addition. 76 Figure 20. Taxonomic composition of microbial community present in RA + G after zeolites addition. .. 77 Figure 21. Taxonomic composition of bacterial community present in of RG before zeolites addition. .. 78 Figure 22. Taxonomic composition of microbial community present in RG after zeolites addition. ... 80
L
IST OF
T
ABLES
Table 1. Principal characteristics of zeolites 13X... 41 Table 2. Ratios zeolites and biomass (g g-1 (VS)) tested in batch assays performed with simple sugars and with Sargassum sp.. ... 42 Table 3. Characterization of Sargassum sp. obtained from (Costa et al., 2015). ... 43 Table 4. Ratios of biomass/Sargassum sp. tested on batch assays. ... 44 Table 5. Maximum hydrogen partial pressure (p(H2)), maximum hydrogen yield (mmol mmol-1 substrate) and COD balance (%) obtained for each ratio zeolite/biomass tested and for the control. ... 53 Table 6. Maximum hydrogen partial pressure (p(H2)), maximum hydrogen yield (mmol mmol-1 substrate) and COD balance (%) obtained for each ratio zeolite/biomass tested. ... 56 Table 7. Maximum hydrogen partial pressure (p(H2)), maximum hydrogen yield (mmol g-1 (VS) Sargassum sp.) and COD balance (%) obtained for each ratio biomass/ Sargassum sp. tested. ... 59 Table 8. Maximum hydrogen partial pressure (p(H2)), maximum yield (mmol g-1 (VS) Sargassum sp.) and COD balance (%) obtained for each ratio biomass/Sargassum sp. tested. ... 61 Table 9. Process performance of RA + G. ... 66 Table 10. Process performance of RG. ... 71 Table 11. Similarities calculated by Dice correlation of the DGGE profiles of bacterial community present in the granular biomass of RA + G (arabinose and glucose as substrate) andRG (glucose as substrate) before and after zeolites addition. ... 73 Table 12. Taxonomic diversity of 16S rRNA RA + Gand RG before and after zeolites addition. ... 75
L
IST OF SYMBOLS AND ABBREVIATIONS
BES - 2-Bromoethanesulfonate ATP - Adenosine triphosphate
NAD+/NADH - Oxidized/reduced forms of nicotinamide adenine dinucleotide DNA - Desoxyribonucleic acid
CoA - Coenzyme A H2ase - Hydrogenase
Fd(ox)/Fd(red) - Oxidized/reduced forms of ferredoxin PFL - Pyruvate: Formate lyase
PFOR - Pyruvate: Ferredoxin oxidoreductase COD - Chemical oxygen demand
p(H2)- Hydrogen partial pressure HRT - Hydraulic retention time HY – Hydrogen yield
D - Dilution rate
CSTR - Continuously stirred tank reactor EGSB - Expanded granular sludge bed AnGSB - Anaerobic granular sludge bed AFBR - Anaerobic fluidized bed reactor UASB - Up-flow anaerobic sludge bed AF - Anaerobic filter
GC - Gas chromatography
HPLC - High-performance liquid chromatography VS - Volatile solids
VSS - Volatile suspended solid TS - Total solids
TKN - Total Kjeldahl Nitrogen VFA - Volatile fatty acid v - Volume
1.1 Importance of Hydrogen production
In our days, several studies have been conducted to search alternative energy sources, including hydrogen. Hydrogen is been considered an important energy carrier since it is environmental friendly and water is the only product of its combustion. Additionally, hydrogen contains the highest value of energy per mass (142 MJ/Kg) of any known fuel (Gaffron & Rubin, 1942). Although, hydrogen is considered a sustainable energy carrier only if it is produced from renewable sources.
There are different hydrogen production methods using biological and thermo-chemical processes. Biological hydrogen production methods include: dark fermentation; or the use of algae deprived of sulfur to produce hydrogen in a bioreactor. Cyanobacteria and microalgae are among the algae that possess the ability to produce hydrogen with the help of the hydrogenase enzyme. The hydrogen producing efficiency due to this process is reported to be 10-20% (Gaffron & Rubin, 1942). Water thermolysis and electrolysis are examples of thermo-chemical methods for hydrogen production. In the first case, which water is covalently bonded, energy is necessary to break this molecule apart into hydrogen and oxygen by using heat as the source (Baykara & Bilgen, 1989). This method is less preferred on industrial and commercial scale due to material constraints. Hydrogen can also be made via electrolysis of water, which means using electricity to split water molecules to create pure hydrogen and oxygen. The advantage of this process is that it can be made anywhere. For example, hydrogen can be produced from tap water and then it can be used to fuel a car. However, this method is not efficient because the electricity consumed is more valuable than the produced hydrogen (Baykara & Bilgen, 1989). If this process is carried out at high temperature is designated as high temperature electrolysis. This method has been carried out at the laboratory scale, however, fails at the commercial level because of lower quality making it unsuitable for fuel cells (Niaz, Manzoor, & Pandith, 2015).
Biohydrogen production processes are found to be more environmental friendly. The utilization of cheaper feedstocks allows the possibility of scale-up production of biohydrogen (N. Ren, Guo, Liu, Cao, & Ding, 2011).The production of biohydrogen is influenced by different factors such as local availability of feedstock, the maturity of the technology that it is used for the production, market applications and demand, policy issues and costs (Abreu, 2011).
Currently, biohydrogen technology is not ready for industrial scale application because it needs more research projects to explore the opportunities for scale-up production (Abreu, 2011).
1.2 Biohydrogen production
1.2.1 Dark fermentation
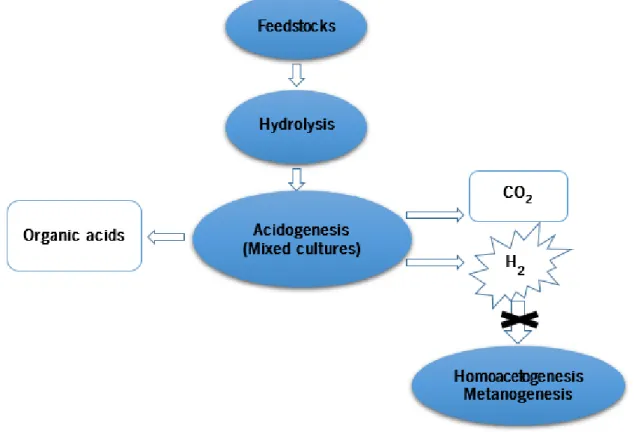
Dark fermentation is a metabolic process for production of organic acids and alcohols, releasing H2 and CO2 from biomass by anaerobic microorganisms (Figure 1) (Rittmann & Herwig, 2012). The microorganisms involved in this process, can be pure or mixed cultures. The control of biohydrogen production by dark fermentation is selected by the used feedstock and the applied reactor conditions (Abreu, 2011). For the production of hydrogen by dark fermentation is necessary to suppress the hydrogen consuming organisms (such as methanogenic archaea, homoacetogens, nitrate and sulphate reducers) by maintaining the pH inside of the reactor around 5.
Figure 1. Schematic representation of dark fermentation biohydrogen production.
Inside of the reactor it is developed a microbial consortium that will affect the distribution of the bioproducts, including the make-up of the gas. Usually, mixed communities of microorganisms are used because they have more advantages than pure cultures. They are generally more stable and more adaptable to changes in the environment and in the feedstock, making them better suited for continuous operations and waste stream applications (Abreu, 2011). Dark fermentation is a biological process that
allows a continuous hydrogen production and the generation of commercially valuable metabolites (such as organic acids). The limitations of dark fermentation are the low yields and rates of hydrogen generation when compared with non-biological hydrogen production methods (Abreu, 2011).
Although the great diversity of metabolic pathways and the several hydrogenases available, the major problem with the existing pathways is that just 1/3 of substrate can be used for hydrogen production. The other 2/3 are used for acetyl-CoA production, creating other fermentative products such as: butanol, ethanol, butyrate and acetate. For the growth and survival of the microorganism the formation of some of these products is essential. For example, the acetate allows the ATP formation, while the formation of other reduced products allows the NADH oxidation, and that is fundamental for the cellular metabolism (P. C. Hallenbeck, Abo-Hashesh, & Ghosh, 2012). Nowadays, it is important to do more studies in order to identify the most suitable feedstocks, to isolate and develop efficient hydrogen-producing strains through genetic engineering and to optimize reactor configurations and operating strategies. The, objective of this is to increase the yields of hydrogen production through dark fermentation (Abreu, 2011).
1.2.2 Hydrogenases
The enzyme involved in the process of hydrogen production is the hydrogenase (H2ase). This is a very complex enzyme responsible for the reversible oxidation of hydrogen into elementary particles, two protons (H+) and two electrons (e-), represented in the follow reaction (Hexter, Grey, Happe, Climent, &
Armstrong, 2012):
Hydrogenases are classified according with the metals present in the active sites. They can be classified into two main groups: the Fe-H2ase that contains Fe and those with Ni, Fe and occasionally Se, [Ni-Fe] H2ase and [Ni-Fe-Se] H2ase (Vignais, Billoud, & Meyer, 2001).
Fe-H2ase has two functions in the cell: the utilization of hydrogen as a growth substrate or in the combination of electrons with protons to form hydrogen (H2 production). This enzyme has a cytoplasmatic form that is responsible for the removal of equivalents reducers in excess, produced during fermentations and carried out by strict anaerobic bacteria (Peters, 1998). On the other hand the [Ni-Fe]-H2ase functions
are the uptake hydrogenase that provides reducing power via hydrogen oxidation (P. Hallenbeck, 2002). Several electron carriers are implicated in the reduction of hydrogenase such as ferredoxin and flavodoxin.
The activity can be influenced by some environmental factors such as pH, temperature and iron concentration. This last have a direct influence on the activity of the enzyme in the hydrogen production process: The higher the iron concentration, the higher will be the activity of the enzyme (Abreu, 2011). The optimum hydrogen production rate was achieved at thermophilic conditions. So the bioreactors used were operated at high temperatures using thermophilic microorganisms (Abreu, Karakashev, Angelidaki, Sousa, & Alves, 2012).
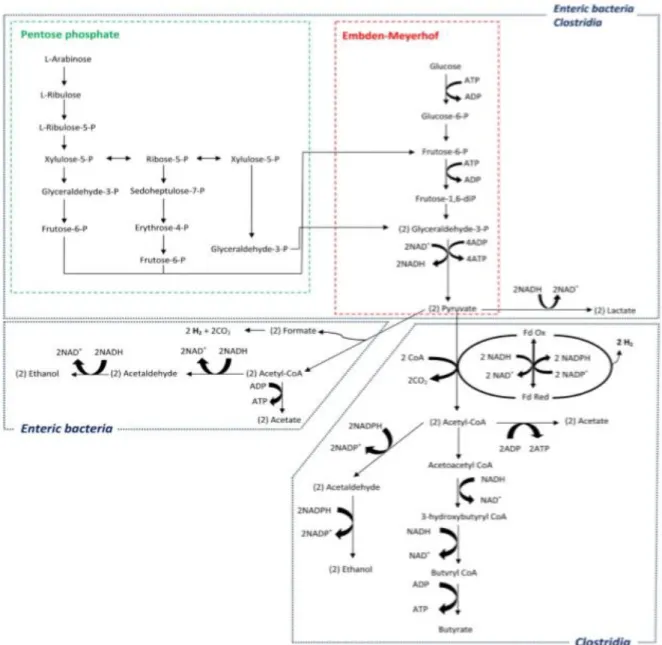
1.2.3 Fermentative pathways and metabolites for biohydrogen production
Carbohydrates are the most effective substrate for dark fermentation H2 production. Currently, carbohydrate-rich waste and wastewater, such as food manufacturing wastes, cheese whey, sugar factory wastewater, among others, appear to be suitable feedstocks for the production of H2. Biohydrogen production have been investigated via batch experiments using solutions of simple carbohydrates such as glucose, arabinose and sucrose. Usually fermentative H2 production follows two main metabolic pathways: the acetate pathway where the theoretical biogas composition is around 67% of H2; and the butyrate pathway, 50% of H2 (P. C. Hallenbeck, 2009).
In glycolysis, glucose is broken down to pyruvate, generating ATP and NADH. Pyruvate is then converted to acetyl-CoA, and depending upon the microrganism, this pathway can follow two ways: the formate production, through the PFL pathway; or the production of reduced ferredoxin and CO2, through the PFOR pathway (P. C. Hallenbeck, 2009).
Formate can be converted to hydrogen and CO2, by either the formate hydrogen lyase pathway, which contains a [NiFe] hydrogenase (the Ech hydrogenase) or possible in some other organisms another pathway which contains a formate dependent [FeFe] hydrogenase. Organisms which only have the pyruvate formate lyase (PFL) pathway cannot access NADH for hydrogen production and thus are limited to 2 mol of hydrogen per mole of glucose. In another way organisms that use the pyruvate oxidoreductase (POR) pathway can potentially derive some hydrogen from NADH oxidation using different [FeFe] hydrogenases (P. C. Hallenbeck et al., 2012).
NADH, generated during glycolysis, is oxidized through the production of various reduced carbon compounds, such as ethanol and butyrate. They can be used in another pathway to produce H2. Excess
NADH is used to produce other reduced fermentation products. In both cases, acetyl-CoA can also be used to produce ATP in another pathway to produce H2 Figure 2 (P. C. Hallenbeck et al., 2012).
Figure 2. Hydrogen producing fermentation pathways involved in glucose and arabinose fermentation, in mixed cultures, obtained from (Abreu et al., 2012).
Several studies reported that extreme thermophilic bacteria, such as Caldicellulosiruptor saccharolyticus, approach the theorical maximum yield of 4 mol H2 mol-1 (glucose) (Costa, Oliveira,
Pereira, Alves, & Abreu, 2015).
The highest hydrogen yield (HY) possible, from the breakdown of 1 mol of glucose is obtained through the acetate pathway which generates 2 mol of acetate and 4 mol of H2 (Reaction 1)).
This stoichiometric HY is only reached under near-equilibrium conditions, which implies slow growth rates at very low partial pressures of H2, that is very difficult to achieve (P. Hallenbeck, 2002). In fact, experimental HYs were largely lower than the maximum theoretical value for dark fermentation. The discrepancy between the experimental and theoretical values of HY can be explained by: (i) several metabolic pathways that can improve the H2 production yield while several other pathways can consume it; (ii) a fraction of the substrate is consumed for biomass production; (iii) a fraction of H2 produced is consumed for the production of other by-products (Costa et al., 2015).
When butyrate is the fermentation product, the maximum hydrogen theoretical yield becomes 2 mol of H2 per mol of glucose consumed, according to the Reaction 2.
Homoacetogenic bacteria had the capacity to consume H2 to produce acetate as shown in Reaction 3).
Several studies reveal that higher concentration of propionate was often associated with lower H2 production (Arriaga, Rosas, Alatriste-Mondragón, & Razo-Flores, 2011; Lee, Lin, & Chang, 2006) because the propionate fermentation (Reaction 4)), consumes the substrate and the H2 lowering the HYs.
Several authors have demonstrated that a fraction of the substrate may be also converted to lactate without the production of H2 (Fritsch, Hartmeier, & Chang, 2008; Peintner, Zeidan, & Schnitzhofer, 2010). Thus leading to a further decrease in experimental HYs compared to the theoretical values for acetate and butyrate pathways. The metabolism shifted from lactate reduce the dissolved H2 concentration and decrease the pH below 6.
1.3 Bioreactors for hydrogen production
1.3.1 Type of Bioreactors
Bioreactors are necessary for the production of hydrogen by dark-fermentation. The design of the reactor and optimization of operation are essential for the process efficiency. The reactors used for the production of hydrogen through the anaerobic fermentation processes can operate in two ways: batch or continue.
Continuous reactors are usually preferred than batch reactors for full scale applications because, if well designed and operated, they may give continuous biohydrogen production under steady-state conditions, avoiding the feeding and emptying steps of batch reactors (Show, Lee, & Chang, 2011).
The fermentative production of hydrogen in continues processes can also occur in immobilized systems or in suspension (Oh, Iyer, Bruns, & Logan, 2004). The systems in suspension allow a better transference of mass between the substrates and the microorganisms. However, for lower HRT is very likely to occur washout of hydrogen producer bacteria (C. C. Chen, Lin, & Chang, 2001).
There are various types of reactors with several advantages and disadvantages for the production of hydrogen by microorganisms, such as continuously stirred tank reactor (CSTR), granular sludge bed reactor (EGSB), anaerobic granular sludge bed (AnGSB), anaerobic fluidized bed reactor (AFBR), up-flow anaerobic sludge bed (UASB) and anaerobic filter (AF).
The CSTR is a very usual reactor once it has a simple construction, easy operation, easy control of temperature and pH, and allows o homogeneous mix (Abreu, 2011). These are usually used for the optimization of continue production of hydrogen through the various substrates. The specific configuration of a particular type of reactor can influence the fermentation process through the retention of biomass (N. Ren et al., 2011). Several studies demonstrate, for example, that an attached-sludge CSTR is more stable than a suspended-sludge CSTR. This related to pH, efficiency in the utilization of substrate and in production of hydrogen and others metabolites, once it manages to maintain elevated concentrations of biomass that confers resilience (N. Ren et al., 2011; N.-Q. Ren, Tang, Liu, & Guo, 2010).
An AnGSB has a high capability of hydrogen production compared with the traditional CSTR (Lo, Lee, Lin, & Chang, 2009). Comparing a CSTR to an AFBR in a suspended and immobilized cells system, the formation of biofilms granules increase the retention of biomass that is proportional to the hydrogen production rate (Show et al., 2010). In this way, the hydrogen production raises in reactors that support the biofilms formation opposing to those where the growth is in suspension. The UASB and AF reactors
biofilms allows to maintain the concentrations of biomass even for the organisms of lower growth (N. Ren et al., 2011). The principal operational parameters of the reactors are: substrate concentration (feed), chemical oxygen demand (CDO), pH, hydrogen partial pressure (p(H2)), flow, temperature, microorganisms rate and HRT (N. Ren et al., 2011).
Although there are several current studies about the production of hydrogen through different types of reactors, a direct comparison between the performances of the different types is not possible because the operational parameters, as well as its configurations, are quite different in the diverse studies (Abreu, 2011).
1.3.2 Type of inoculum
In biohydrogen production, it is frequent to use mixed cultures of microorganisms instead of pure cultures, once it brings more advantages to an industrial scale. The control and operation of the process is facilitated because medium sterilization is not required, reducing the overall cost and allowing a wide choice of feedstocks (Valdezvazquez, Riosleal, Esparzagarcia, Cecchi, & Poggivaraldo, 2005). For the production of biohydrogen, it is very important the control of microbial consortia to obtain the best yields. The pH condition in the bioreactor, is very important for biohydrogen production, maintaining a different microbial consortia (parameter that be around 5.5–6.5) (Z. Liu et al., 2013). However, depending on the complexity of the substrates to be fermented, several microorganisms are involved, leading to different H2 yields.
An important issue about mixed cultures is the necessity to avoid the development of hydrogen-consuming microorganisms in the bioreactor (Z. Liu et al., 2013). The viability of the process can be reduced by non-hydrogen producing species such as methanogens, homoacetogens and lactic acid bacteria that could eventually lead to process failure (Abreu, 2011). To minimize this problems, the pretreatment of the inoculums, the maintenance of environmental and operational conditions, will favor the growth of hydrogen producing species (Abreu, 2011). Hydrogenotrophic methanogens might be still active under acidic conditions, and one possible controlling approach is to maintain the hydrogen fermentation under thermophilic condition. Several studies demonstrate that the operation of the reactors under thermophilic condition leads to greater production of hydrogen.(Chu et al., 2008; H. Zheng, Zeng, & Angelidaki, 2008).
1.3.3 Advantages of using granular-sludge systems
In granular sludge systems cell immobilization occur, under certain conditions, in the absence of a support material by self-aggregation of anaerobic microorganisms into granules. A major disadvantage in hydrogen producing granule formation is the long start-up period, which requires several months (Mu & Yu, 2006). An attractive alternative to this problem is to use engineering microbial mixed communities that already form anaerobic granules, by means of environmental pressure, towards improved hydrogen production. The bacterial community structure of hydrogen-producing systems have been characterized. Several studies report diverse mesophiles and thermophiles affiliated with the classes Clostridia and Bacilli in the phylum Firmicutes (Wu et al., 2006). However, there are only a few studies on community structure of hydrogen-producing anaerobic microflora at temperatures higher than 60 °C (Othong, Prasertsan, Karakashev, & Angelidaki, 2008; Yokoyama et al., 2007).
Processes using seed sludge are usually preferred for pilot scale application because they are easier to operate and control compared to pure cultures (Li & Fang, 2007). They contain a large diversity of microorganisms, including H2 producers and H2 consumers like methanogens (Wong, Wu, & Juan, 2014). For this reason, the sludge is usually pre-treated to suppress H2 consumers before to be used as inoculum in the bioreactors. One of the most important characteristics of H2 producing bacteria is that they are usually spore-forming conducing to a better chance to survive under hard conditions of temperature and pH, compared to H2 consumers, which are usually non-spore-forming (Wong et al., 2014).
1.3.4 Feedstocks and nutrients requirement
For the production of hydrogen, through fermentative processes, there are several renewable feedstocks that can be used allowing a sustainable production without environmental consequences, such as lignocellulosic materials, industrial organic waste and domestic waste. All of these substrates have a low commercial value, making the production of composts, as the hydrogen, a valuable utility for mankind (Fernandes, Peixoto, Albrecht, Saavedra del Aguila, & Zaiat, 2010).
The most common sugars used for production of hydrogen by fermentative processes are glucose, sucrose, xilose, arabinose and lactose. They are simple sugars and therefore readily biodegradable and commonly used as model substrates (Engenharia, 2011; Z. Liu et al., 2013). A great diversity of microorganisms have the capability of using simple sugars to produce H2 through metabolic processes such as dark fermentation (Z. Liu et al., 2013). Carbohydrates are the main source of hydrogen
during fermentative processes, and for that reason waste such as food wastes, and biomass are nowadays potential feedstocks for biohydrogen generation. They are very complex materials consisting of carbohydrates, proteins and lipids and are abundant organic materials in cities and in the food industry (Z. Liu et al., 2013). Feedstocks such as molasses, cassava stillage and olive pulp had also been used for hydrogen and methane fermentation (Luo et al., 2010; Park, Jo, Park, Lee, & Park, 2010).
Lignocellulosic materials can also be used as renewable feedstock for fermentative hydrogen production. This includes agricultural residues, such as sugar cane and wheat straw and forestry residues, such as wood trimmings (Abreu, 2011; N. Ren et al., 2011). These materials possess high levels of carbohydrates polymers such as cellulose and hemicellulose, which are tightly bonded to lignin. These polymers are hydrolised and function as sugar sources, such as pentoses and hexoses, which have a high potential in biofuel production (N. Ren et al., 2011).
One possible feedstock to use for biohydrogen production is Sargassum sp., a genus of brown macroalgae that is very abundant in the Portuguese coastline during spring, summer and autumn. This macroalgae is a carbohydrate-rich source and have many advantages, for example its cultivation does not involve the use of feed, fertilizer, pesticides or other chemicals. The macroalgae growth is fuelled only by natural nutrients in seawater as well as solar energy and carbon dioxide. Moreover, macroalgae contain easily hydrolysable sugars and proteins, low fractions of lignin and high fractions of hemicellulose and a good hydrolysis yield making this biomass suitable for anaerobic fermentation (Nkemka & Murto, 2010). The energy potential of marine biomass is estimated to be more than 100 EJ yr-1, significantly higher
than the terrestrial biomass (22 EJ yr-1) or municipal solid waste (7 EJ yr-1) (Costa et al., 2015).
The choice of the feedstock used for fermentative biohydrogen production is influenced by availability, cost, carbohydrate content, biodegradability and concentration of inhibitory compounds (Abreu, 2011).
Currently there are several ethical problems associated with the use of food as a feedstock for the production of hydrogen as biofuel. As it was mentioned, it is possible to produce hydrogen through industrial and agricultural waste meaning that there is a viable alternative to the process (Abreu, 2011).
For hydrogen production through fermentation processes it is necessary nutrients for bacterial metabolism, growth and activity. The principal nutrients required are nitrogen, phosphate and some trace elements such as magnesium, sodium, zinc and iron (Abreu, 2011).
1.4 Parameters influencing the activity of hydrogen-producing bacteria
1.4.1 pH Control
The pH is one of the parameters that should be controlled in the bioreactors once it affects the growth rate of microorganisms. pH variations can cause changes in the microbial constitution of consortium that will change the production rate of hydrogen. The pH affects the microorganism metabolism in the carbon and energy sources utilization levels, in the synthesis reactions and in the extracellular metabolites production.
It is necessary to know which pH maximizes the global efficiency of the process, knowing that the different species of bacteria presents a maximum activity in different pH values. The methanogenic bacteria have high activity for pH between 6.6 and 7.6 (Zehnder, Huser, Brock, & Wuhrmann, 1980). As previously mentioned, for the production of hydrogen is necessary to maintain the bioreactor pH between 5.5 and 6.2 avoiding the activity of bacterial species that consume hydrogen such as methanogens. In this range of pH is intended to, simultaneously, favor the activity of hydrogen producers bacteria. The control of pH can be realized by adding sodium bicarbonate (NaHCO3) to the feeding.
1.4.2 Temperature control
Temperature is, also, an important parameter in bioreactors control because it influences the activity of hydrogen-producing bacteria. Dark fermentation is an anaerobic process that is controlled by temperature and takes place in a wide range. Fermentation, under extreme thermophilic conditions (70° C), started to attract attention due to: much better pathogen destruction for residues coming from anaerobic fermentation process; lower risk of contamination with methanogenic organisms (Van Groenestijn, Hazewinkel, Nienoord, & Bussmann, 2002) and higher rate of hydrolysis (Lu, Gavala, Skiadas, Mladenovska, & Ahring, 2008); and higher hydrogen yield (Kádár et al., 2004).
Hydrogen production with mixed cultures can be performed under mesophilic (26-40°C) or thermophilic (45-60°C) conditions. However, nowadays many researchers prefer termophilic conditions because the risk of contamination by methanogenic archaea is lower and allows a more extensive destruction of pathogens (Van Groenestijn et al., 2002).
Biohydrogen fermentation at extreme thermophilic temperatures (over 70°C) is more thermodynamically advantageous over mesophilic fermentation. Allowing a greater yield of hydrogen
production, and at higher temperatures, the effect of hydrogen partial pressure is less significant (Abreu, 2011).
1.4.3 Hydraulic retention time (HTR) control
Hydraulic retention time (HRT) corresponds to the ratio between the volume of the reactor and the volumetric flow. It can also be defined by the inverse of the dilution rate (D) (Abreu, 2011). The HRT is an important parameter in bioreactor control. The ideal HRT depends on the operational conditions such as substrate, type of inoculum and temperature. Only the microbial populations with growth rates larger than the dilution rate (μmax > D) can remain in the reactor, so this is a very important control (Abreu, 2011). One of the possibilities to obtain the best yield in hydrogen production by dark fermentation is to decrease the HRT and verify the changes in the microbial population and yield of hydrogen over time.
1.4.4 Hydrogen partial pressure (p(H2))
Hydrogen partial pressure (p(H2)) is an important parameter in biohydrogen production, since it affects thermodynamic equilibrium of the reaction involving the reversible oxidation of the coenzyme nicotinamide adenine dinucleotide (NAD), which is a coenzyme produced by the microorganisms that plays a fundamental role in the pathway of molecular H2 production (Reaction 5)).
p(H2) is an extremely important factor for continuous hydrogen synthesis because the metabolic pathways of biohydrogen production are very sensitive to hydrogen concentrations and are subject to end-product inhibition. When hydrogen concentration in the liquid increases, the re-oxidation of reduced ferredoxin and hydrogen carrying enzymes become less favourable leading to a decrease of hydrogen production. This way the metabolic pathways shift to the production of more reduced substrates such as lactate, ethanol, acetone, butanol, or alanine (Abreu, 2011).
When the H2 partial pressure is less than 102 Pa at 25 °C, NADH2 can be re-oxidised and the
reaction (5) can proceed from the right to the left (Ruzicka, 1996). It was reported that simple sugars, as glucose and sucrose showed higher p(H2) than real wastewater and more complex carbohydrates, probably because the maximum p(H2) depends on the complexity of carbohydrates present in the
1.5 Importance of hydrogen storage materials
Nowadays, energy storage has become an extremely important issue, once the energy sources such as fossil fuels and natural gas are not infinitely available. Hydrogen is one of the most promising alternative as energy source, so the search for new hydrogen-storage methods has become an important aspect in hydrogen energy applications.
Currently, hydrogen storage is being done on a larger scale in order to develop safe, reliable, compact and cost-effective materials which can be used for fuel cell technology. Some of the most innovating ways to store hydrogen are compressed hydrogen, liquid hydrogen and storage material (Niaz et al., 2015).
Hydrogen can be stored in vast variety of materials under diverse conditions of pressure and temperature; or it can be made to store in case of certain materials using the process of chemical storage; or by physisorption. This process involves molecular adsorption, diffusion, chemical bonding and Van der Waals attraction and dissociation.
The most widely studied materials are porous materials, such as carbon materials (nanotubes), zeolites and many others (Niaz et al., 2015).
1.5.1 Zeolites
Zeolites is one of the most promising material for hydrogen storage. The word “Zeolites” derived from the two Greek words “zeo”, meaning “to boil”, and “lithos”, meaning “stone”. It is a large class of highly crystalline aluminosilicate materials, defined by a network of linked cavities and pores, with a variety of molecular dimensions that gives rise to their molecular sieving properties (Figure 3) (Niaz et al., 2015). They are used in various industrial applications, such as separation of hydrocarbons and the removal of impurities from gas streams (Niaz et al., 2015).
Currently, zeolites are used for treatment of wastewater contaminated with metals since it have positively charged exchangeable ions, which can be replaced by heavy metals. Due to this net negative charge, zeolites have a strong affinity for transition metal cations but, much lower affinity for anions allowing the removal of metals from contaminated water (Silva, Figueiredo, Quintelas, Neves, & Tavares, 2012).
The adsorption of gases by zeolites occur by physisorption where the H2 molecules gated weakly adsorbed at the surface of the material. Recently, physisorption has attracted more attention because the adsorption is reversible and thus the adsorbent can be recycle and offers the possibility of high
hydrogen-storage capacity and quick desorption (Barrer & Vaughan, 1967). This process has many advantages, such as the low cost, susceptible to impurities, possess low reversible gravimetric capacity and undergoes desorption at higher temperatures (600 K) (Niaz et al., 2015).
Previously studies revealed that zeolites contain sodalite cages, so the H2 is forced to move into the cavities of the molecular sieve under elevated temperatures and pressure (Barrer & Vaughan, 1967). It was described that under the conditions of 573 K and 10.0 MPa the hydrogen storage capacity it is 9.2 cm3 g-1 (Niaz et al., 2015). The principal advantages of this material is the high thermal stability, low cost
and adjustable composition (Langmi et al., 2005). Many parameters affect the hydrogen storage in microporous materials, including the specific surface area, the interaction of molecular hydrogen with the internal surfaces of the micropores, the stability of the molecular adducts and the optimal storage temperature (Zecchina et al., 2005).
The most important factor is the channel diameter that determine the hydrogen capacity under high pressure. An effective porous hydrogen-storage material should possess a large pore volume and a channel diameter close to the kinetic diameter of the hydrogen molecule (dH= 2.89Å) (Dong, Wang, Xu, Zhao, & Li, 2007). Nowadays, there are three principal families of synthetic zeolites A,X,Y.
Figure 3. (a) Schematic representation of a pore of the zeolite NaX. (b) SEM images of zeolites NaX (Dong et al., 2007).
The main goal of this project is to develop an efficient system for the generation of biohydrogen using dark fermentation process from organic wastes. The fermentative process will be conducted in EGBS reactors at extreme thermophilic conditions (70°C) for a high hydrogen production and carried out by a mixed microbial consortium (anaerobic sludge). The zeolites effect on biohydrogen production performance, in batch and continuous mode will be evaluated with glucose and arabinose as substrate and with the marine biomass, Sargassum sp., as substrate.
3.1 Zeolites
The zeolites used in this work were obtained from Sigma Aldrich and consisted of the type 13X with a composition of 1 Na2O: 1 Al2O3: 2.8 ± 0.2 SiO2: xH2O (Figure 4). The sodium form represents the basic structure and have an effective pore opening in the 910¼ range. In the table 1 are represented the principal characteristics of zeolites 13X.
Figure 4. Zeolites of NaX family, correspondent of type 13X. Table 1. Principal characteristics of zeolites 13X.
3.2 Hydrogen production assays with simple sugars
3.2.1 Inoculum
Anaerobic granular sludge from a brewery industry was used as inoculum in the hydrogen production assays. The sludge contained a volatile solids (VS) concentration of 0.08 ± 0.01 g g-1.
3.2.2 Experiment Set-up with simple sugars
Batch experiments were performed in two different medium: a complex medium containing 0.75 g L-1HK
2PO4, 1.5 g L-1 K2HPO4, 20 mL L-1 trace-elements stock solution (H+ and OH-), 15 mM BES, 0.6
Type Form Bead or particle
size temperature (°C) Regeneration Pore diameter (Å)
mL g-1 (COD) of macronutrients, 10 mM Sodium bicarbonate and a simple medium containing 15 mM
BES, 0.6 mL g-1 (COD) of macronutrients and 10 mM Sodium bicarbonate. The initial biomass
concentration was approximately 7.72 g L-1 of volatile suspended solids.
The batch experiments were conducted in 120 mL serum bottles, with a working volume of 56 mL. The pH of the medium was adjusted to 7.0-7.2 with NaOH or HCL 2 mol L-1. Two different substrates
were used, L-Arabinose and Glucose monohydrated, both in a final concentration of 12.5 mM. The bottles were sealed and the headspace flushed with N2. Cysteine, in a final concentration of 1 g L-1, was used to
reduce the medium. The bottles were incubated at 70 °C and each experiment was conducted in triplicate.
The zeolite ratios used in this experiment are described in Table 2. In this experiment, were also included a blank assay without biomass (substrate + zeolites) and a control without zeolites (biomass + substrate). The hydrogen, accumulated in the headspace of the sealed bottles, was measured by gas chromatography (GC) and the soluble fermentation products and residual arabinose and glucose were measured by high performance liquid chromatography (HPLC).
Table 2. Ratios zeolites and biomass (g g-1 (VS)) tested in batch assays performed with simple sugars
and with Sargassum sp..
Zeolites (g) Biomass g (VS) L-1 Ratios (g (zeolite) g-1 (VS) biomass)
0.09 7.72
0.26
0.06 7.72 0.13
0.03 7.72 0.065
3.3 Hydrogen production assays with
Sargassum sp.
3.3.1 Inoculum
Anaerobic granular sludge from a brewery industry was used as inoculum in the hydrogen production assays. The sludge contained a VS concentration of 0.08 ± 0.01 g g-1.
3.3.2 Residue characterization
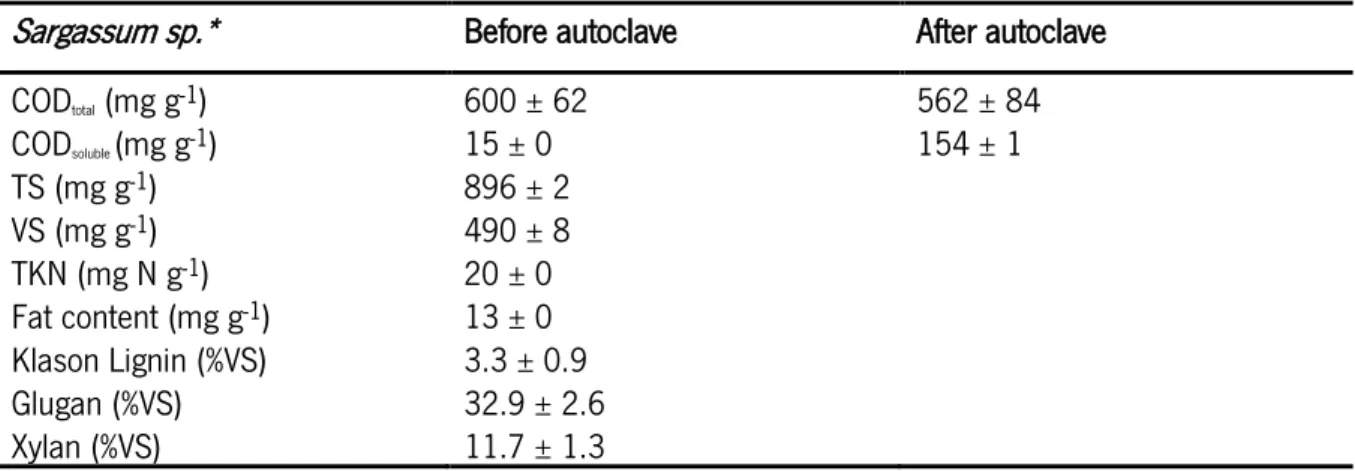
Sargassum sp. was collected in the spring of 2013 from a location in the north coastline of Portugal (Póvoa de Varzim). The macroalgae was dried at room temperature and then milled into pieces with less than 0.5 cm according to (Costa et al., 2015). Sargassum sp. biomass was characterized in terms of total and soluble Chemical Oxygen Demand (COD), total solids (TS), volatile solids (VS), Total Kjeldahl Nitrogen (TKN), fat content, Klason lignin, glucan and xylan content Table 3. A pre-treatment was applied to increase the soluble COD. Therefore Sargassum sp. was autoclaved at 121 °C and 1 bar for 10 min, after autoclaving the soluble COD increased 10x, corresponding to more than 25% of the total COD (Costa et al., 2015).
Table 3. Characterization of Sargassum sp. obtained from (Costa et al., 2015). Sargassum sp.* Before autoclave After autoclave CODtotal (mg g-1) 600 ± 62 562 ± 84 CODsoluble (mg g-1) 15 ± 0 154 ± 1 TS (mg g-1) 896 ± 2 VS (mg g-1) 490 ± 8 TKN (mg N g-1) 20 ± 0 Fat content (mg g-1) 13 ± 0 Klason Lignin (%VS) 3.3 ± 0.9 Glugan (%VS) 32.9 ± 2.6 Xylan (%VS) 11.7 ± 1.3
*Macroalgae dried at room temperature and milled into pieces with less than 0.5 cm. 3.3.3 Experiment set-up
Batch experiments were performed in a simple medium containing 0.6 mL g-1 (COD) of
macronutrients, 10 mM Sodium bicarbonate and 15 mM BES. The initial biomass concentration was approximately 7.72 g (VS) L-1 of volatile suspended solids. The batch experiments were conducted in 120
mL serum bottles, with a working volume of 59 mL. The pH of the medium was corrected to 7.0-7.2 with NaOH or HCL 2 mol L-1.Three different concentrations of Sargassum sp. described on Table 4, were
tested. The bottles were sealed and the headspace flushed with N2. Cysteine at final concentration of 1 g L-1 was used to reduce the medium. The bottles were incubated at 70 °C and each experiment was
conducted in triplicate. A blank assay to discount for the residual substrate present in the inoculum were also performed. Total and soluble COD of Sargassum sp. were determined at the beginning and end of
the assay. The hydrogen accumulated in the headspace of the closed bottles was measured by gas chromatography (GC) and the soluble fermentation products were measured by HPLC.
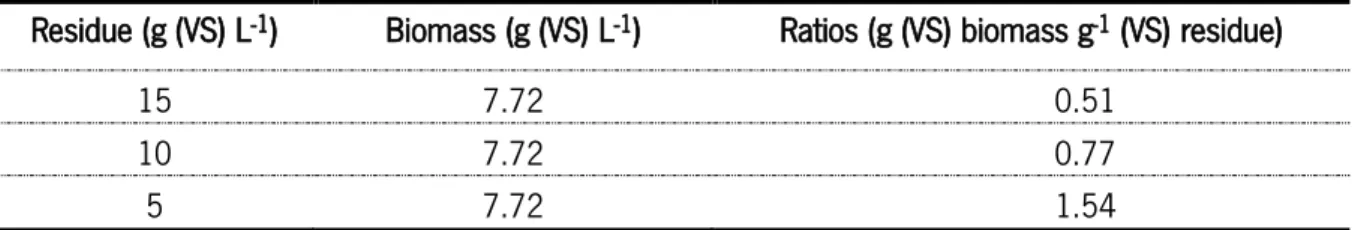
Table 4. Ratios of biomass/Sargassum sp. tested on batch assays.
Residue (g (VS) L-1) Biomass (g (VS) L-1) Ratios (g (VS) biomass g-1 (VS) residue)
15 7.72 0.51
10 7.72 0.77
5 7.72 1.54
3.3.4 Experiment set-up with Zeolites
Batch experiments were performed with a simple medium containing 0.6 mL g-1 (COD) of
macronutrients, 10 mM Sodium bicarbonate, 15 mM BES. The initial inoculum concentration was approximately 7.72 g (VS) L-1 of volatile suspended solids. The batch experiments were conducted in 120
mL serum bottles, with a working volume of 59 mL. The pH of the medium was adjusted to 7.0-7.2 with NaOH or HCL 2 mol L-1. For this assay, it was used the ratio 1.54 g (VS) biomass g-1 (VS) Sargassum sp.
since it was the best yield in the previous batch assay. The bottles were sealed and the headspace flushed with N2. Cysteine at final concentration of 1 g L-1 was used to reduce the medium. The bottles were
incubated at 70 °C and each experiment were conducted in triplicate. The ratios of zeolites and biomass used are described in the Table 2. A blank assay to discount the hydrogen produced from the residual substrate present in the inoculum and a control without zeolites (biomass + substrate) were also performed. Total and soluble COD of Sargassum sp. were determined at the beginning and end of the assay. The hydrogen accumulated in the headspace of the closed bottles was measured by gas chromatography (GC) and the soluble fermentation products were measured by HPLC.
3.4 Operation of the Hydrogen producing reactors
3.4.1 Inoculum
Anaerobic granular sludge from a brewery industry was previously acclimated for two months on an EGSB reactor at extreme thermophilic conditions and pH 5.5 in order to select hydrogen producers. The collected granular sludge was used as inoculum for the EGSB reactors. The sludge contained a VS
source, RA + G, and another with only glucose RG. In both operations the bioreactor was inoculated with 300 mL of anaerobic granular sludge.
3.4.2 Glucose and Arabinose reactor
The continuous experiments were carried out in EGSB reactor made of stainless steel with an internal diameter of 5.65 cm. Total liquid volume was 2.68 L inclusive reaction-zone volume of 2.14 L. The EGSB reactor was operated with a stable temperature of 70 ± 1 °C by means of an external jacket for water circulation. The EGSB reactor designed by RA + G was operated in a continuous mode for 72 days and feed with Glucose monohydrated and L-Arabinose with a ratio 1:1 (w/w) at final concentration of 4.4 g COD L-1. The feedstock was supplemented with macronutrients, with the following composition:
MgSO4.6H2O; KH2PO4; NH4CL; KCL. The macronutrients were added to the influent feed by addition of 0.6 ml g-1 COD fed. The feedstock was stored at 4 °C, to minimize acidification. During the first month
of continuous mode, RA + G was operated with a hydraulic retention time (HRT) of 12h and then decreased for 6h. After reached a critical value of hydrogen production, a ratio 0.26 g zeolites g-1 (VS) biomass was
introduced in the reactor. The continuous operation occurred for 22 days at a HRT of 6h, to determine the effect of zeolites in a continuous hydrogen production. The pH of the bioreactor was maintained at 5.5. The hydrogen produced was measured by gas chromatography (GC) and the soluble fermentation products and residual arabinose and glucose were measured by HPLC.
3.4.3 Glucose reactor
An EGSB reactor was operated in a continuous mode for 19 days and feed with Glucose monohydrated at final concentration of 4 g COD L-1. The feedstock was supplemented with 0.6 mL g-1
COD fed macronutrients with the same composition and stored at 4 °C.
During the first 7 days of continuous mode, RG was operated with a hydraulic retention time (HRT) of 12h and then decreased to 6h. After 7 days at this HRT a ratio 0.26 g zeolites g-1 (VS) biomass of
zeolites was applied to the bioreactor. The continuous operation occurred for 5 days, at a HRT of 6h, to verify the effect of zeolites on continuous hydrogen production. The pH of the bioreactor was maintained at 5.5. The hydrogen produced was measured by gas chromatography (GC) and the soluble fermentation products and residual glucose were measured by high HPLC.
3.5 Analytical methods
Determinations of Total and soluble COD of Sargassum sp. were realized using a standard kits (Hach Lange, Düsseldorf, Germany). Hydrogen and methane concentration in batch assays and in continuous operation was determined by GC using a column molsieve (MS-13 x 80/100 mesh) and thermal conductivity detector Bruker Scion 456 Chromatograph, (Bruker, Massachusetts, USA) with argon (30 mL min-1) as the carrier gas. The injector, detector and column temperatures were 100, 130,
and 35 °C, respectively. VFA, lactic acid and sugars (arabinose; glucose) were determined by high performance liquid chromatography using an HPLC (Jasco, Japan) with an Aminex ® column (HPX-87H Ion 300 mm x 7.8 mm2); Sulfuric acid (0.01 N) at a flow rate of 0.7 mL min-1 was used as mobile phase.
Column temperature was set at 60 °C and was used a retention time of 50 min. Detection of VFA’s and lactic acid was made through a UV detector at 210 nm, and the detection of glucose and arabinose was made by using an RI detector.
3.6 Molecular Methods
3.6.1 PCR-DGGE and Sequencing
Representative granular sludge samples were collected from the EGSB reactor after and before zeolites addition and stored at -20°C. Total genomic DNA was extracted from approximately 500 μL of sample by using the FastDNA SPIN kit for soil (MP Biomedicals LLC, Santa Ana, CA). 16S rRNA gene fragments of approximately 450 bp were amplified for DGGE analysis by PCR using a Taq DNA polymerase kit (ThermoFisher ScientificTM) and the primer set 968-f (5’- AAC GCG AAG AAC CTTAC-3’) plus GC-Clamp (5’-CGC CCG GGG CGC GCC CCG GGC GGG GCG GGG GCA CGG GGG G-3’) described by (Muyzer, de Waal, & Uitterlinden, 1993) and 1401-r (5’-CGG TGT GTA CAA GAC CC-3’), as previously described by (Nübel et al., 1996).
The size of the obtained PCR products was checked by comparison with appropriate size and mass standard (Thermo Scientific Gene ruler 1 Kb Plus DNA ladder), by electrophoresis on 1% (w/v) agarose gel and SYBR® Safe staining. Gels ran at a constant voltage of 100 V in an agarose gel electrophoresis system (Bio-Rad mini-sub® Cell GT).
Nucleic acids were detected through an UV transilluminator (BioRad, Hercules, CA, USA). DGGE analysis of the amplicons was done by using the DCode system (Bio-Rad). PCR products were
containing a linear gradient ranging from 30% to 60% denaturant. Silver staining of DGGE gels was performed as previously described by (Sanguinetti, Dias Neto, & Simpson, 1994). DGGE gels were scanned at 400 dpi and the profiles compared by using the Bionumerics 5.0 software package (Applied Maths, Gent, Belgium). The diversity of the similarity indices (Si) of the compared profiles was determined by clustering analyses using Dice correlation. DNA amplications were sequenced by illumina, using the protocol illumina two-step. The bacteria/archaeal primers pair used were 515-f (5’- AATGATACGGCGACCACCGAGATCTACACXXXXXXXXXXXXATGGTAATTGTGTGYCAGCMGCCGCGGTAA-3’) and 806-r (5’-CAAGCAGAAGACGGCATACGAGATAGTCAGTCAGCCGGACTACNVGGGTWTCTAAT-3’) (Caporaso et al., 2012). The data analysis was made by RTL (Research testing Laboratory, Texas, US) in a homemade pipeline that consists in two major stages, the denoising and chimera detection stage and the microbial diversity analysis stage.
4.1 Biohydrogen dark fermentation with simple sugars
In a first stage of this study, the effect of zeolites on hydrogen production from a mixture of arabinose and glucose (12.5 mM) was studied in batch reactors with a complex medium and a simple medium.
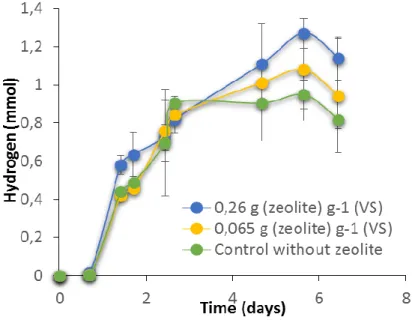
4.1.1 Zeolites effect on biohydrogen dark fermentation performed with a complex reaction medium Cumulative hydrogen production for the ratios 0.26 g zeolite g-1 (VS) biomass and 0.065 g zeolite
g-1 (VS) biomass are shown in Figure 5.The highest hydrogen production, 1.27 mmol H
2, was achieved
for the ratio 0.26 g zeolite g-1 (VS) biomass of zeolites. The increase on cumulative hydrogen production
in the presence of 0.26 g zeolite g-1 (VS) biomass was significantly higher (P (bi-caudal) < 0.004223987:
t-test) than the obtained for the control (without zeolites) which reached 0.94 mmol H2. Production of methane was not detected suggesting an effective inhibition of methanogenic archaea by BES.
Figure 5. Cumulative hydrogen production for each ratio zeolites/biomass tested. The error bars represent one standard deviation of triplicate bottles.
Soluble fermentation products (SFP), released during fermentation, are often used to evaluate the efficacy of hydrogen production. SFP of all ratios zeolites/biomass and control (without zeolites) are shown in Figure 6 (c), (d) and (e). Glucose and arabinose utilization is shown on Figure 6. (a) and (b). The COD balance for each ratio zeolites/biomass indicated that all of the metabolic products were identified (Table 5).
Figure 6. Arabinose (a) and glucose (b) utilization. Lactate (c), acetate (d) and formic acid (e) formation during hydrogen dark fermentation process for each ratio zeolites/biomass tested. Error bars represent one standard deviation of duplicate bottles.
Table 5. Maximum hydrogen partial pressure (p(H2)), maximum hydrogen yield (mmol mmol-1 substrate)
and COD balance (%) obtained for each ratio zeolite/biomass tested and for the control. Ratios
zeolites/biomass (g g-1 (VS))
Hydrogen partial pressure (p(H2)) (Pa)*
Hydrogen yield (mmol mmol-1 substrate) COD balance (%)** Control without zeolites 44.2 0.79 116 0.26 50.1 0.89 94 0.065 42.0 0.75 109
*The hydrogen partial pressure shown represents the maximum p(H2) reached during the assay. **The COD balance shown represents the soluble COD of the detected SFP.
In this study the SFP profile was also analysed in order to understand if the improvement of hydrogen production by zeolites is related to metabolic changes. Glucose, an easily degradable sugar, was totally consumed both in the presence and in the absence of zeolites. On the other hand, arabinose was totally consumed when zeolite was present at a ratio of 0.26 g zeolite g-1 (VS) biomass, but not in
the control without zeolites and with the ratio 0.065 g zeolite g-1 (VS) biomass. The arabinose consumed
in the control assay was 62.9 % and in the assay with the ratio 0.065 g zeolite g-1 (VS) biomass was 59.6
%. Lactic acid was the most prevalent of SFP for the control and ratios of zeolites/biomass tested. The ratio 0.26 g zeolite g-1 (VS) biomass produced the highest lactic acid concentration (1175.2 mg L-1),
which corresponded to 28 % (in COD) of the detected SFP, because in this case glucose and arabinose was totally consumed.
The highest acetic acid production was obtained for the ratio 0.26 g zeolite g-1 (VS) biomass
(689.5 mg L-1), which corresponds to the highest H
2 yield (0.89 mmol mmol-1 substrate) (Table 5).
Formic acid was detected in the presence and in the absence of zeolites, once the biomass used consisted of mixed cultures so Enteric bacteria could be present, converting pyruvate to acetyl-CoA and formic acid. The formic acid was released in lower concentrations than acetic acid in the control and in the presence of zeolites. As previously mentioned, formic acid is degraded into hydrogen and carbon dioxide (Figure 2 Chapter 1). The theoretical hydrogen yields obtained from formic acid are lower, compared to those obtained from acetate production (Sikora, Baszczyk, Jurkowski, & Zielenkiewicz, 2013). The highest HY possible, from the breakdown of 1 mol of glucose is obtained through the acetate
pathway which generates 2 mol of acetate and 4 mol of H2 (Li & Fang, 2007).Therefore, despite the formic acid production the produced hydrogen resulted mainly from the acetic acid formed.
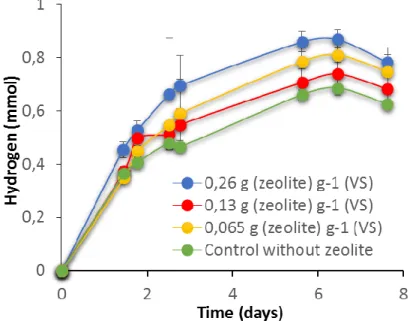
4.1.2 Zeolites effect on biohydrogen dark fermentation performed with a simple reaction medium The effect of zeolites on hydrogen production was also evaluated with a simple reaction medium, similar to the usually used as bioreactor feedstock. The purpose was to study if in this conditions zeolites had the same effect on hydrogen production, or if its effect was only related to some component of the complex medium, and to predict zeolites behaviour in a continuous operation. A new ratio zeolites/biomass of 0.13 g g-1 (VS), was tested in this assay.
Cumulative hydrogen production for the ratios zeolites/biomass and for the control (without zeolites) are shown in Figure 7.The highest hydrogen production was achieved for the zeolites ratio of 0.26 g zeolite g-1 (VS) biomass, 0.87 mmol H
2, followed by the ratio 0.065 g g-1 (VS) (0.81 mmol H2).
The improvement of hydrogen production was compared by the control (without zeolites) which reached 0.68 mmol H2. The increase on cumulative hydrogen production in the presence of 0.26 g zeolite g-1
(VS) biomass and 0.065 g zeolite g-1 (VS) biomass was significantly higher than the obtained for the
control, P(bi-caudal) <0,00406259: t-test and P(bi-caudal) <3,39155E-05: t-test, respectively. Production of methane was not detected, suggesting an effective inhibition of methanogenic archaea by BES.
Figure 7. Cumulative hydrogen production for each ratio zeolites/biomass tested. The error bars represent one standard deviation of triplicate bottles.
Figure 8. Arabinose (a) and glucose utilization (b). Lactate (c), acetate (d) and formic acid (e) formation during hydrogen dark fermentation process, for each ratio zeolite/inoculum tested. Errors bars represent standard deviation of duplicate bottles.